Essential Google Ads Metrics Every Marketer Should Track
Are you tracking dozens of Google Ads metrics but still struggling to scale your winners?
Most performance marketing teams lose money not because Google Ads doesn’t work, but because they focus on the wrong signals. When the metrics you watch don’t reflect real performance, bad creatives keep spending, good ones get paused too early, and ROAS quietly slips before anyone notices.
If you’re running Google Ads for mobile games, DTC brands, or subscription apps, this blog is for you. You’ll learn which Google Ads metrics actually matter for user acquisition, how to use them to spot scalable winners, and how to protect your budget before performance drops.
What Are Google Ads Metrics?
Google Ads metrics are the performance signals that tell you whether your user acquisition campaigns are actually working or quietly wasting budget. These metrics show how your ads are driving clicks, installs, purchases, or subscriptions, and the cost per action.
They help you understand which campaigns are worth scaling, which ones need fixing, and which ones should be paused. In short, Google Ads metrics turn your ad data into clear decisions about where to spend more, where to cut back, and what to optimize next.
The real value comes from knowing why these metrics matter.
Why Marketers Track Google Ads Metrics?
You track Google Ads metrics to understand whether your user acquisition spend is driving profitable actions or quietly wasting budget. These metrics help you evaluate campaign effectiveness, optimize ROI, and ensure your ads reach the right users with the right message.
By monitoring key signals like CTR, CPC, conversions, and CPA, you can see what’s working, fix what’s not, and shift budgets toward ads that actually deliver installs, purchases, or subscriptions.
Key reasons teams track Google Ads metrics include: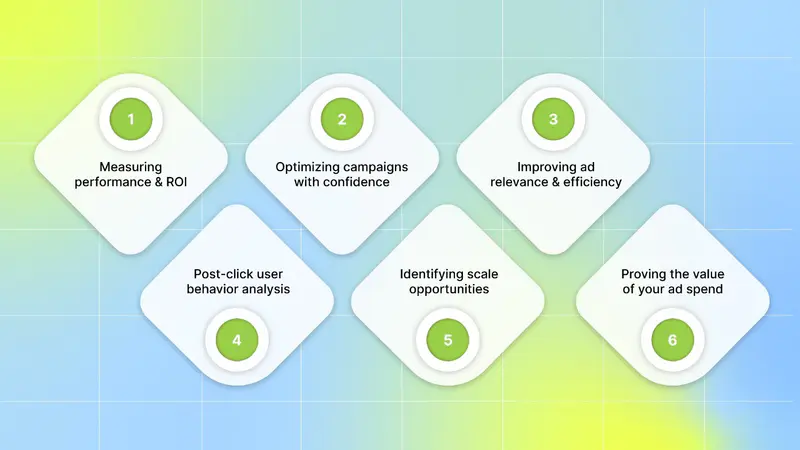
Measuring performance and ROI: Metrics like CPA and conversion value show whether your campaigns are driving profitable users or just generating traffic with no return.
Optimizing campaigns with confidence: Performance data helps you refine keywords, ad copy, and bidding strategies to improve results over time.
Improving ad relevance and efficiency: Tracking quality score helps you understand how relevant your ads are, allowing you to improve ad visibility while keeping CPC under control.
Understanding user behavior after the click: Metrics reveal who is clicking your ads, where they’re coming from, and how they behave after landing, helping you target higher-quality users.
Identifying scale opportunities and risks early: Metrics like impression share highlight missed reach, while CTR trends signal whether your ad messaging is still resonating.
Proving the value of your ad spend: Clear reporting connects ad performance to real outcomes, making it easier to justify budgets and scaling decisions.
The real impact comes from knowing which specific metrics actually guide better decisions, smarter optimizations, and profitable scaling.
Also Read: How Marketers Use Google Ads Transparency for Creative Wins
The Google Ads Metrics You Should Track
You should track Google Ads metrics that clearly show how your ads are driving user acquisition, controlling costs, and generating profitable outcomes. These metrics help you decide which campaigns to scale, optimize, or pause.
Here are the Google Ads metrics you should track to make better performance and budget decisions:
1. Foundational Google Ads Metrics: The Core Four
Before deeper analysis, you need to get the basics right. These four Google Ads metrics are the foundation of every user acquisition strategy. Every optimization, scaling decision, and budget shift builds on them. If these aren’t tracked correctly, everything else becomes guesswork.
Clicks: The Starting Point of User Interest
A click happens when someone sees your ad and clicks through to your website, app store page, or landing page. For UA teams, clicks show whether your ad is strong enough to trigger initial interest.
Clicks alone don’t equal success. But without a steady flow of relevant clicks, installs, purchases, or subscriptions can’t happen. Think of clicks as the door into your acquisition funnel.
Impressions: Measuring Your Ad’s Visibility
An impression is counted every time your ad is shown on Google Search, Display, or YouTube. Impressions tell you how visible your ads are within your target market.
High impressions mean your ads are being seen by many users. However, impressions alone don’t tell you about ad quality or effectiveness. They simply show exposure.
Cost: Understanding Your Total Ad Spend
Cost is the total amount you spend on Google Ads over a given time period. For performance marketers, this is your most basic budget management metric.
Tracking cost helps you stay within spend limits and evaluate efficiency. It also feeds directly into crucial efficiency metrics, like Cost Per Click and Cost Per Acquisition.
Conversions: The Ultimate Measure of Success
A conversion is the action you want users to take after clicking your ad. This could be an app install, a purchase, a subscription signup, or a lead submission.
Conversions matter because they tie ad spend to real outcomes. Without accurate conversion tracking, you can’t tell which campaigns are actually driving growth. Proper conversion setup is one of the most important steps in any Google Ads account.
2. Engagement & Relevance Metrics: Is Your Audience Paying Attention?
Once your ads are visible and getting clicks, the next question is whether they’re relevant to the right users. Engagement and relevance metrics help you understand how well your ads match user intent and expectations.
Click-Through Rate (CTR): The Primary Gauge of Ad Relevance
CTR shows the percentage of impressions that turn into clicks. It helps you understand how compelling your ad is to the audience seeing it.
It's calculated as;
(Clicks ÷ Impressions) 100
A strong CTR usually means your targeting, keywords, and ad copy are aligned with user intent. A weak CTR often signals your ad isn't resonating with your target audience. A sudden drop in CTR may signal the need for refreshed ad copy and creatives or tighter targeting.
CTR also acts as a proxy for your competitive position in the auction. When you monitor CTR alongside metrics like Impression Share, you can clearly see how effectively your ads compete for attention in key markets.
Quality Score: Google’s Verdict on Your Ads
Quality Score is Google’s rating of how relevant and useful your ad experience is. A higher Quality Score can improve ad positions and lower CPCs, directly impacting acquisition efficiency.
Quality Score is driven by:
Expected CTR: How likely users are to click your ad for a particular keyword.
Ad relevance: How well your ad matches the user search query.
Landing page experience: How useful and relevant your landing page is for users.
Ignoring Quality Score often leads to higher costs and weaker performance over time.
Engagement Rate: Beyond the Click for Display & Video
For display and video campaigns, engagement goes beyond clicks. Engagement rate measures the percentage of times someone engaged with your ad after seeing it. It also includes actions like watching a certain amount of your video or interacting with a rich media ad.
3. Efficiency & Cost Metrics: Are You Spending Smartly?
Getting traffic and conversions is only half the job. Efficiency metrics show whether you’re acquiring users at a cost that aligns with your advertising strategy.
Cost Per Click (CPC): The Price of a Single Click
CPC is the average amount you pay each time someone clicks your ad. It helps you understand keyword competitiveness and cost pressure.
It's calculated as;
(Total Cost ÷ Total Clicks)
Lower CPCs can be good, but only if balanced with click quality. Low CPCs can bring cheap clicks that don’t convert, hurting overall performance.
Cost Per Mille (CPM): Paying for Eyeballs
CPM measures how much you pay for 1,000 impressions. This metric is common in display and video campaigns.
CPM is useful when your goal is reach, awareness, or top-of-funnel exposure rather than immediate clicks or conversions. It helps you control the cost based on exposure.
Cost Per Acquisition (CPA): The Cost of a Goal
CPA measures how much you spend per conversion. For UA managers and performance leads, CPA is a key sustainability metric.
It's calculated as;
(Total Cost ÷ Total Conversions)
If your CPA is higher than the value or profit you make per user, your campaign is losing money. Tracking CPA helps you scale acquisition while keeping costs under control and profitability intact.
4. Profitability & ROI Metrics: What’s Your Bottom Line?
At the end of the day, user acquisition must drive revenue. Profitability metrics tell you whether your Google Ads campaigns are truly worth the spend. These are the numbers your team cares about most.
Return on Ad Spend (ROAS): The Gold Standard of Profitability
ROAS shows how much revenue you generate for every dollar spent on ads.
It's calculated as;
(Total Conversion Value ÷ Total Cost)
For example, a ROAS of 4:1 (or 400%) means you generate $4 in revenue for every $1 you spend.
For e-commerce, subscription apps, and high-scale UA teams, ROAS is the clearest signal of whether campaigns should be scaled, optimized, or paused.
Conversion Value: Assigning Worth to Your Goals
Conversion value assigns a monetary value to each conversion. For e-commerce, this is usually purchase revenue. For leads or subscriptions, it’s based on expected customer value. Without conversion value, it’s impossible to measure true performance.
5. Visibility & Competitiveness Metrics: How Do You Stack Up?
Google Ads is competitive by nature. Visibility metrics show how often your ads actually appear, versus how often they could appear.
Impression Share: Your Share of Available Demand
Impression share is the percentage of impressions you received divided by the estimated number of impressions you were eligible to receive.
A low Impression Share means missed opportunities. It often points to budget limits, bidding issues, or relevance problems.
Top Impression Share: Visibility Above Organic Results
This metric shows how often your ad appears above organic search results. Top-of-page visibility usually drives more attention, clicks, and stronger performance, especially for high-intent searches.
Absolute Top Impression Share: Winning the First Spot
It measures the percentage of impressions where your ad was the very first ad shown at the top of the search results. While expensive, this position can be powerful for competitive, high-value keywords. This metric tells you how often you are winning the top spot.
Lost Impression Share (Budget & Rank): Why You’re Missing Out
Google explains lost visibility in two ways:
Lost IS (Budget): Your ads didn’t show because your budget was too low. Its a clear sign that you need to increase your budget to get more traffic.
Lost IS (Rank): Your ads didn’t show because bids or Quality Score weren’t competitive. Its a clear sign that you need to improve your quality score or increase your bids.
To interpret Google Ads metrics correctly, it helps to view them by category.
Also Read:
Comparison of Key Metrics Categories
Not all Google Ads metrics answer the same questions or drive the same decisions. Comparing metric categories helps you understand what to measure and why it matters at each stage of user acquisition.
Here are the key Google Ads metric categories and how they guide performance:
The next step is to go deeper into a few additional metrics that matter in user journeys.
Additional Google Ads Metrics You Should Track
Beyond core metrics, different Google Ads campaign types require different performance signals. If you’re running search, display, video, or Performance Max campaigns, tracking the right campaign-specific and conversion path metrics helps you optimize more accurately.
Here are the additional Google Ads metrics you should track:
1. Campaign-Specific Metrics You Can’t Ignore
Not all campaigns behave the same way. Search relies on intent, display depends on placement quality, video is driven by attention, and Performance Max is algorithm-led. Tracking the right metrics for each campaign type ensures you optimize based on how users actually interact with your ads.
Search Campaign Metrics
Search campaigns succeed or fail based on intent alignment and keyword efficiency. For teams, search performance depends on a disciplined approach to keyword diagnostics, match-type control, and query refinement.
Key areas to analyze:
Keyword-level performance: Evaluate CPC, CTR, Quality Score components, and CPA at the keyword level. Break results by match type to identify where inefficiencies originate.
Search terms report: Analyze the actual queries triggering your ads. Identify high-intent queries to scale and eliminate terms driving low-quality clicks.
Negative keyword strategy: Build structured negative lists (brand, category, competitor, junk terms) and expand them regularly to prevent wasted spend.
Ad group structure: Keep ad groups tightly themed so ads, keywords, and landing pages stay aligned, improving quality score, relevance, and efficiency.
Auction insights: Find competitors influencing impression share, CPC, and position changes for your most important queries.
Display Campaign Metrics
Display campaigns rely on inventory quality, audience targeting, and creative suitability. Since users aren’t actively searching, performance can vary widely by placement.
Critical metrics to track:
Viewability metrics (viewable impressions, vCPM): Low viewability often means wasted budget and poor inventory quality. Prioritize placements where ads are actually seen.
Placement performance: Use placement reports to remove sites or apps with high spend but low engagement or conversions.
Audience performance: Compare in-market, affinity, custom intent, and remarketing segments to identify which audiences deliver real value.
Frequency and reach balance: Monitor frequency to avoid ad fatigue and diminishing returns.
Brand safety controls: Apply exclusions and content filters to protect brand reputation and improve media quality.
Video Campaign Metrics
Video campaigns drive value through attention and engagement, not just clicks. For mobile games, DTC, and subscription apps, understanding how users watch is critical. Traditional ad metrics only tell part of the story; deeper analysis is required to understand creative effectiveness and audience behavior.
Key video metrics to monitor:
View rate: Shows whether your creative captures attention early. Compare across formats like skippable, non-skippable, and bumper ads.
Cost per view (CPV): Track CPV trends to understand where creative resonates versus where spend is inefficient.
Watch time and retention curves: Identify where viewers drop off. Early exits often signal weak hooks, while mid-video drops point to pacing or messaging issues.
Earned actions: Monitor earned likes, shares, and subscriptions as signals of strong relevance beyond the paid impression.
Creative variant performance: Segment performance by creative variant. Compare different messaging angles and CTAs to see which elements drive stronger engagement and downstream results.
Performance Max Metrics
Performance Max campaigns are algorithm-driven, so optimization depends on feeding the system high-quality data and evaluating performance signals correctly.
Key areas to evaluate:
Asset group diagnostics: Review performance ratings to identify which asset combinations drive incremental conversions and replace weak assets quickly.
Creative coverage: Ensure a complete mix of headlines, descriptions, images, videos, and audience signals to avoid limiting algorithmic reach.
Listing group performance (ecommerce): Track ROAS and conversion value by product type to see what the system algorithm prioritizes.
Search term insights: Evaluate emerging search intent and identify misaligned queries by using PMax search term visibility..
Budget distribution patterns: Monitor how spend is split across Search, Display, YouTube, and Shopping to ensure alignment with business goals.
2. Conversion Path Metrics
User acquisition rarely follows a straight line. Users often interact with multiple ads, devices, and formats before converting. Attribution metrics help you understand the full journey.
View-Through Conversions (VTC)
View-through conversions measure the impact of ads that influence users without generating a click. This is especially important for display and video campaigns, where users often don’t click immediately but convert later.
VTC insights help you:
Identify campaigns that assist conversions even with low CTR.
Spot creatives that build brand recall and delayed response.
Avoid undervaluing display and video when using only last-click data.
Understand how passive ad exposure contributes to multi-touch journeys.
Cross-Device Conversions
Cross-device behavior is now the norm. Many users discover on mobile, research on another device, and convert later on a desktop. Without cross-device tracking, mobile campaigns often appear inefficient even as they drive demand.
Key areas to evaluate include:
Common device paths (mobile → desktop, mobile → tablet).
Conversion rate differences between the discovery device and the purchase device.
Incremental conversions driven by mobile awareness campaigns.
Budget adjustments needed when mobile is the main entry point.
Path Metrics: Time Lag and Path Length
Time Lag and Path Length metrics help you understand how long users take to convert and how many interactions they need along the way. These patterns vary by product type, price point, and audience maturity.
How to use them:
Time Lag: Time Lag measures the gap between a user’s first ad exposure and the final conversion. Tracking this helps you understand how long users typically take to decide, which allows you to set realistic bidding and optimization windows.
Path Length: Path Length shows how many ad interactions a user usually needs before converting. By analyzing this, you can identify where remarketing or branded search support is necessary and evaluate whether early touchpoints meaningfully contribute to the final conversion.
Together, these metrics reveal whether your funnel is functioning efficiently or needs stronger sequencing, messaging, or remarketing support.
Metrics only become useful when they’re translated into signals teams can interpret, compare, and act on consistently.
What High-Performing Teams Include in Google Ads Reporting?
Tracking Google Ads metrics only matters if you can act on them quickly. High-performing user acquisition teams organize metrics into reporting and visualization systems that surface patterns, risks, and opportunities early.
What effective Google Ads reporting and visualization should include:
Column sets built around auction dynamics (Impression Share, Overlap Rate, Position Above Rate), combined with efficiency metrics like CPA, ROAS, and Conversion Value.
Segmented views by device, audience, match type, and time of day to expose performance variability instead of hiding it in averages.
Saved reports for recurring workflows such as search term expansion, negative keyword audits, asset performance reviews, and budget pacing.
Trend-level indicators that reveal directional shifts before they fully impact CPA or ROAS.
Breakouts by funnel stage or campaign type to separate systemic issues from isolated problems.
Clear goal targets and pacing thresholds so metrics are evaluated in context.
Near real-time visibility into spend spikes, impression share losses, and conversion volatility.
Automation and visualization aren’t about convenience. They ensure Google Ads metrics are reliable, comparable, and actionable—so user acquisition decisions are based on signals, not assumptions.
Even with strong reporting in place, it’s important to recognize the limits of native Google Ads reporting.
Limitations of Native Google Ads Reporting

Google Ads reporting is powerful, but it is fundamentally designed to analyze performance within Google’s own ecosystem. For user acquisition teams running multi-channel campaigns, this creates important blind spots when decisions depend on understanding the full picture.
Here are a few limitations of native Google Ad reporting:
1. Limited Cross-Channel Visibility
Google Ads reporting shows how campaigns perform inside Google inventory, but it cannot act as a true cross-network source of truth. You can’t reliably answer questions like how Google Ads compares to Meta, TikTok, or other paid channels, or how combined spend impacts blended ROAS and revenue.
Without external aggregation, performance is evaluated in isolation, making it harder to allocate budgets across channels based on real business impact rather than channel-specific metrics.
2. Restricted Creative-Level Insights
For automated formats like Performance Max, Google itself limits visibility into individual ad performance. Because ads are dynamically assembled, you can’t see which specific creatives, messages, or visual elements are driving results.
This makes it difficult for UA and creative teams to extract learnings, iterate on winning patterns, or understand why performance changes, especially when scaling spend across automated campaigns.
3. No Native Creative Fatigue Tracking
Google acknowledges creative fatigue as a performance issue, but detecting it requires manual analysis of trends like rising CPAs or declining CTRs. There’s no built-in system to proactively track fatigue or alert teams when creatives start to lose effectiveness.
As a result, fatigued ads often keep spending longer than they should, while teams react after performance has already dropped.
When reporting is limited to channel-level views, UA teams are forced to optimize with incomplete information. This leads to delayed reactions, inefficient budget allocation, and creative decisions based on assumptions rather than evidence.
As acquisition campaigns scale across networks, these limitations become more pronounced, pushing teams to look beyond native reporting for deeper, more connected insights.
These gaps don’t mean Google Ads metrics lack value; they mean teams need an additional layer to connect fragmented signals into a complete performance picture. This is where a purpose-built analytics platform becomes essential.
Also Read: How to Combat Creative Fatigue with AI Solutions
How Segwise Helps Turn Google Ads Data Into Growth Signals
To overcome the limitations of native Google Ads reporting, user acquisition teams need more than another dashboard. They need a system that connects creative, performance, and revenue signals across channels and turns metrics into clear actions. This is where Segwise fits into the workflow.
Here are the key ways Segwise helps teams turn Google Ads data into actionable growth signals:
1. Unified View for All Your Creative Data
Instead of analyzing Google Ads in isolation, Segwise brings together performance data from Facebook Ads Manager, Google Ads, TikTok, and your MMP dashboard. See creative-level ROAS, CPA, LTV, and conversion rates from all sources in one unified view.
With unified data, you can compare campaigns fairly, understand blended performance, and allocate budgets based on real impact rather than siloed metrics.
2. Creative-Level Insights That Go Beyond the Google UI
Segwise focuses on creative analytics, not just campaign stats. It connects creative elements (hooks, dialogs, visuals, formats, etc.) directly to business outcomes (ROAS, CPA/CPI, LTV, IPM, conversion rates), so teams stop guessing what works and start scaling creatives with data-backed confidence.
This allows teams to see why performance changes, whether it’s a hook, message, visual style, or format, rather than guessing based on aggregated campaign results.
3. Proactive Creative Fatigue Tracking and Alerts
Instead of manually spotting fatigue after CPAs rise or CTRs fall, Segwise fatigue tracking monitors continuous decline in performance metrics and spend share using internal logic. You can catch fatigue before it impacts your budget allocation and campaign results. Teams can set custom success criteria, track new creatives, and receive alerts when ads start to fatigue or miss targets.
This makes it easier to pause underperforming creatives on time, protect ROAS, and maintain acquisition momentum.
By combining cross-network data, creative-level insights, and automated monitoring, Segwise turns Google Ads metrics into actionable intelligence. UA teams spend less time pulling reports and more time making confident decisions about what to scale, what to refresh, and where to shift budget.
For teams managing high creative volume across multiple platforms, this closes the gap between tracking metrics and driving growth.
Conclusion
Tracking Google Ads metrics is not about watching more numbers; it’s about watching the right ones. From foundational metrics like clicks and conversions to signals of efficiency, profitability, and visibility, the metrics you track determine how confidently you can scale user acquisition. When these metrics are tied together with campaign-specific and conversion path insights, you gain a clear view of what’s working, what’s wasting budget, and where growth actually comes from.
However, as campaigns scale across formats and networks, native Google Ads reporting starts to show its limits. This is where tools like Segwise naturally fit in.
Sewise integrates directly with various ad networks in just a few steps. You just need to go to the Segwise Dashboard → Settings → Ad Networks, click Connect under Google /Meta/ TikTok/LinkedIn accounts, sign in, and select your Ads account. That’s it! Segwise automatically analyzes your ad creatives.
Segwise helps performance teams go beyond channel-level metrics. With cross-platform performance reports, you can track performance for individual platforms or get consolidated cross-network insights. With creative analytics, you just don't need to jump between Facebook Ads Manager, Google Ads, TikTok, and your MMP dashboard. Moreover, you can build custom dashboards around your specific KPIs. Also, create automated reports that show how creative decisions impact ROAS across all your apps and campaigns.
So, why wait? Start your free trial to turn Google Ads metrics into clear growth signals and scale with confidence!
