AI Ad Analysis Tools in 2026: Find What Drives Creative Success
You run lots of creative tests, and you're ready to use a tool, but the problem is choosing the one that actually proves which creative pieces drive installs, cut costs, and raise lifetime value.
Look for a platform that links creative tags to real KPIs, reads video, image, on-screen text, and audio, connects straight to ad and measurement partners, flags creative fatigue early, and gives clear next steps you can test. Fast setup and a real trial let you confirm the tool works with your own data before you commit.
In this blog, we'll compare the top ad analysis tools for 2025, show what each one can prove about creative performance, and finish with a short checklist to help you pick the right tool.
What Are Ad Analysis Tools?
Ad analysis tools turn your creative assets, video, images, playables, audio, and on-screen text into structured data that connects directly to installs, conversion rates, and revenue. Instead of judging creatives by eye, the tool automatically detects elements such as hooks, captions, product shots, CTAs, and audio cues, then ranks each element's contribution to performance.
You get a searchable view of all creative variations across channels in one place. That makes it simple to answer practical questions like which thumbnail generates stronger intent, which CTA improves install quality, or which moment in a video causes viewers to exit. These tools eliminate the need for manual tagging or spreadsheet stitching, giving you a clear snapshot of what’s working and why.
What Is AI Used for in Ad Analysis Tools?
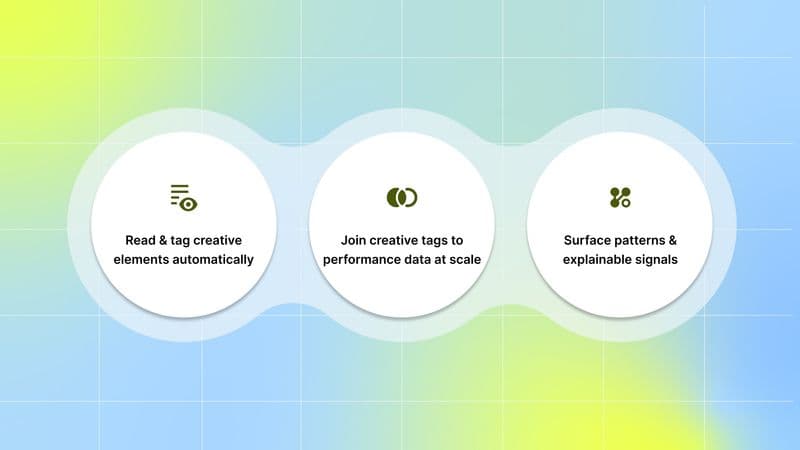
AI speeds up three core jobs that would be slow or inconsistent by hand:
Read and tag creative elements automatically: Computer vision and audio transcription scan each asset and label the parts that matter: faces, text overlays, product shots, music cues, spoken lines, and so on. That lets you search by element (for example, “all ads with a smiling user within the first 2 seconds”).
Join creative tags to performance data at scale: Once creatives are tagged, the system links those tags to campaign metrics across ad networks so you can see which tags correlate with installs, conversion rates, or ROAS. This mapping is what converts a visual pattern into an actionable hypothesis.
Surface patterns and explainable signals: Instead of a single opaque score, modern platforms highlight combinations that win or fail (for example: “product close-up + male voiceover performs better on Network X for this audience”). Some vendors add a conversational layer so you can ask plain-language questions and get quick summaries.
All three functions remove the manual heavy lifting: tagging thousands of creatives by hand, merging spreadsheets, and hunting for patterns across networks. That gives you faster, repeatable insight about which creative mechanics to test next.
Why These Tools Matter for You
When you manage large creative volumes, small changes in execution can swing results. These tools help you see which elements truly influence user quality and return on spend:
Optimize for signal, not noise: By tying creative elements (hook style, visual scenes, voiceovers) to outcomes like retention or ROAS, you reduce spend on creatives that underperform.
Speed up scaling of winners: Element-level insights help you spot repeatable mechanics early. That means you find what works faster and scale it.
Leverage data-backed trends at scale: According to AppsFlyer’s 2025 report, their analysis covered 1.1 million video creatives across 1,300 apps and $2.4 billion in ad spend, proving these patterns are real and actionable.
Balance concentration and exploration: In Gaming, the top 2% of creatives capture 53%of spend, while in Non-Gaming, the top 2% receive 43%. That shows you need both repeatable high-performers and creative variety.
Save time and reduce manual work: Instead of manually merging creative libraries with performance data, you get a single dashboard that consolidates all the data.
Shorten your test-learn-scale cycle: With clean, automated tagging and cross-network insights, you iterate faster, generating, testing, learning, and scaling more efficiently than before.
Make creative mechanics testable: Thanks to creative-level measurement, you don’t just test “this ad vs that ad,” you test “this hook vs that hook,” “this scene order vs another,” or “this stylistic element vs another.” That turns subjective creative craft into repeatable science.
Once you understand how much creative choices influence results and how these platforms turn those choices into measurable signals, the next step is knowing which tools can give you this level of clarity. That’s where the leading options in 2025 stand out.
Also Read: Creative Optimization in 2025: Actionable Insights Report
Top 5 Ad Analysis Tools in 2025
Ad analysis tools now play a key role in showing which ads truly influence outcomes. With growing creative volume and multi-platform campaigns, teams need systems that read creative elements accurately and connect them to real performance signals. The tools below highlight the strongest options for teams in 2025 who want faster insights and clearer creative direction:
1. Segwise
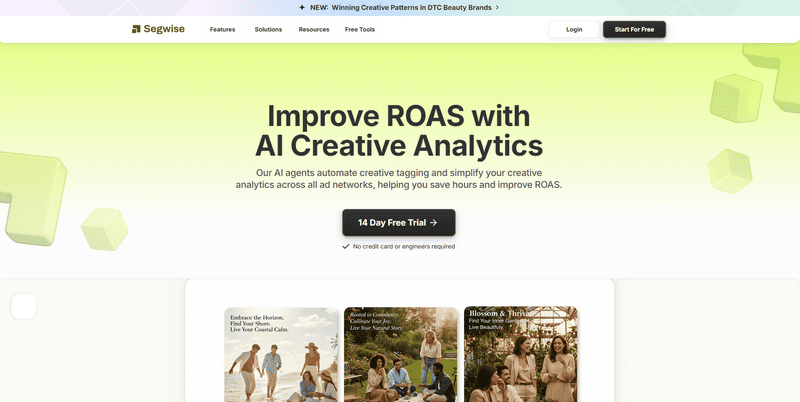
Segwise gives high-volume UA and creative teams element-level evidence of what in an ad moves business metrics. Its multimodal AI automatically tags hooks, characters, CTAs, product shots, on-screen text, audio cues, and playable elements, then maps those tags to KPIs (IPM, CTR, installs/CPA, ROAS, LTV) so you can see which specific creative element correlates with acquisition and retention. This creates a clear, verifiable picture of which creative elements influence outcomes, rather than broad pattern-guessing.
With no-code integrations across major networks, DSPs, and MMPs, Segwise aligns creative signals with attributed results in one view, then layers fatigue tracking, early alerts, and AI agents that propose next steps grounded in the same data. For teams managing large volumes of creative across platforms, this combination delivers faster, evidence-based iteration than tools limited to benchmarking or surface-level insights.
Key features:
Multimodal automatic tagging: Automatically extracts and tags on-screen text, scenes, characters, products, CTAs, audio lines, and other creative elements from videos, images, and playables, turning assets into queryable data.
Cross-platform, no-code integrations: Native/no-code connectors bring data from major ad networks, DSPs, and MMPs into a single workspace, enabling creative tags to be linked to raw campaign metrics.
Tag → KPI mapping: Maps each creative tag to acquisition and performance KPIs (examples listed: IPM, CTR, installs, ROAS) so you can see which exact element correlates with business outcomes.
Custom fatigue tracking & alerts: lets you set fatigue criteria and triggers, continuously monitors creative performance across platforms, and sends alerts when assets show early signs of fatigue or anomalous decline.
Actionable boards and AI agents: Visual leaderboards, automated suggestions, and AI agents surface next steps (for example, shorten a hook or move a CTA) and generate test ideas grounded in your creative data.
Best for:
Performance marketing and creative teams that run high volumes of variants across networks and need per-element evidence tying creative changes to acquisition and revenue metrics.
Pros:
Granular, tag-level signals that support data-driven creative tests and media decisions.
Works across major ad networks and connects creative signals to revenue and attribution partners.
Fatigue and performance alerts help stop wasted spend earlier.
Cons:
Onboarding is geared to higher-volume accounts, so setup has more steps than a simple plug-and-play tool. This only matters if you run tiny tests.
Pricing conversations are sales-led for larger deployments, so public self-serve pricing is limited.
If your workflow is strictly single-platform and tiny-scale, some of Segwise’s scale features may be more than you need.
Pricing:
Segwise highlights free trials and contact-for-pricing options rather than a simple public price list. Expect planned conversations with sales for larger accounts.
Suggested Watch: Track New Creative Performance with Segwise Creative Analytics
2. Alison.ai
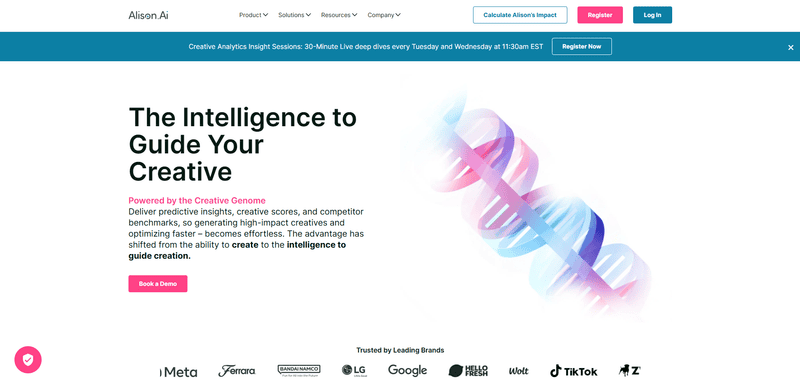
Alison.ai pairs a large Creative Genome dataset with generative AI to create briefs, storyboards, and performance-driven creative variants. The focus is on converting performance patterns into new creative concepts and video variants.
Key features:
Creative Genome (benchmarks & mapping): A data model that links creative elements to performance patterns across categories and channels.
AI-Agent for ideation: An agent that produces briefs, storyboards, and creative directions guided by your context and the Genome’s signals.
Data-driven video generation: Converts performance signals into test-ready video variants to reduce production time and cost.
Automated creative tagging: Smart tagging of visuals, text, and other elements so assets become queryable data.
Competitive intelligence & benchmarking: Shows how your assets compare to competitors and surfaces winning creative patterns to copy or avoid.
Best for:
This fits teams that want AI help in developing new creative concepts and don’t need deep tag-level mappings across many networks.
Pros:
Speeds ideation with AI-assisted drafts and benchmark context.
Good at surfacing high-level patterns and creative directions.
Cons:
Lacks deep multimodal tag-to-metric mapping that ties individual frames/lines to ROAS or LTV, so it’s harder to prove causation for scale decisions.
Focused on creative ideation and scoring; does not centralize cross-network performance at the tag level for complex attribution needs.
Pricing and enterprise features are demo- or sales-led; you may need additional integration work for full cross-platform measurement.
Pricing:
Primarily demo and sales-based; public plan details are not listed.
Also Read: Segwise vs Alison.ai: Which Creative Tool Fits Your Brand?
3. Motion
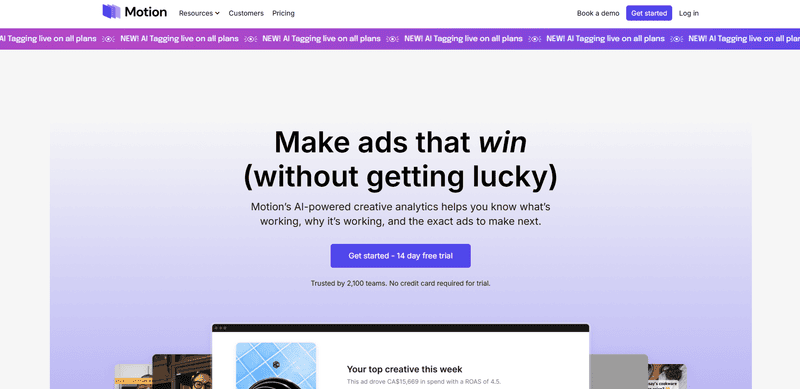
Motion imports creative assets and performance data, groups similar concepts, and shows where viewers engage or drop off so teams can choose what to make next. It highlights frame-level engagement and provides team tools such as leaderboards and task tracking.
Key features:
AI tagging across creatives: automatic tagging (not custom tagging, only normal tagging) and grouping to reveal patterns across many ads.
Frame-by-frame video analysis: Examine exactly where viewers drop off or engage with each video.
Context-aware AI agents: Agents that recommend which ads to make next using your account’s historical wins and recent data.
Competitor ad tracking & reporting: Finds competitor ads and builds plans to test or counter them.
Integrations for richer attribution: Connects with tools like Northbeam and GA4 to join creative signals with revenue and custom conversions.
Best for:
If you need a cheaper, work-focused tool for smaller teams and value collaboration and task tracking, Motion can be a good fit.
Pros:
Clear entry pricing and a starter plan are available.
Built-in teamwork features (unlimited seats, tasks, leaderboards).
Cons:
As ad spend grows, you may outgrow starter tiers and need to move to a different plan.
Less emphasis on element-level tag-to-ROAS proof makes it harder to show which exact frame or audio cue drove installs.
Some reviews note feature gaps for large, cross-network attribution workflows; extra integrations may be required.
Pricing:
Starter plans listed around $250/month, with higher tiers for larger ad spend and enterprise features. Check the vendor page for current plan details.
Also Read: Segwise vs Motion: Choosing the Right Creative Analytics Tool
4. CreativeX
CreativeX produces a Creative Quality Score (CQS) that measures digital suitability against platform best practices. The score helps drive media efficiency and governance across markets and brands. Their research links improvements in quality scores to media cost savings.
Key features:
Creative Quality Score (CQS): A single, data-backed score that measures digital suitability against platform best practices.
Pre-flight evaluation (digital suitability checks): Automatic checks to flag format, branding, pacing, or policy issues before an asset goes live.
In-flight monitoring & reporting: Track live and historical creative performance and quality across markets and platforms.
Global governance & brand compliance: Rules and automation to enforce logos, safe zones, language, and brand guidelines at scale.
Benchmarking & media activation insights: Compare CQS to industry averages and use scores to inform media allocation and expected cost efficiencies.
Best for:
Best for large brand or media programs that use a quality score to guide buys, not the right pick if you need per-frame evidence of what drove installs or LTV.
Pros:
Strong research-backed scoring that helps predict viewing costs and media outcomes.
Enterprise reporting and use in media planning.
Cons:
Focuses on a single quality score rather than tag-level causation; it won’t show which specific frame or line produced an install.
Custom pricing and an enterprise orientation can create onboarding and cost barriers for smaller teams.
The score is useful for media negotiation, but it can obscure the micro-level creative moves you test in short A/B loops.
Pricing:
CreativeX generally uses custom pricing and quotes for enterprise buyers. Public plan details are not listed, so expect a sales conversation.
5. AdSkate
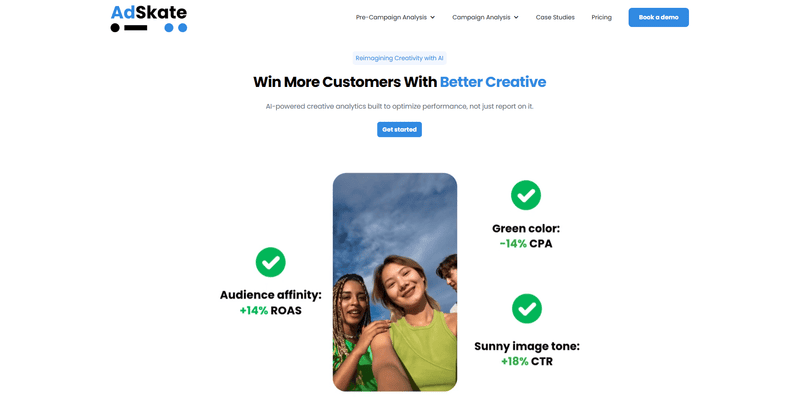
AdSkate analyzes creative assets by extracting attributes like tone, layout, and objects, then simulates audience responses using modeled segments. It includes a conversational analyst (AdSkate GPT) for plain-language Q&A and synthetic audience testing that does not rely on cookies or first-party user data.
Key features:
AdSkate GPT (conversational analyst): Ask questions in plain language and get evidence-backed answers about creative elements and likely impact.
Pre-campaign Audience Analysis (synthetic audiences): Simulate responses across 1,000+ modeled audience segments without cookies or first-party data.
Persona Insights: AI-driven persona profiles that show which creative cues map to specific audience motivations and behaviors.
Creative attribute analysis: Breaks assets into visual and messaging attributes (tone, objects, layout) and scores alignment to target segments.
Export & API access for workflows: Results can be exported or integrated through an API for reporting or automation.
Best for:
If you want quick readouts and simple guidance to improve creative pacing or tone before a campaign, this tool can help.
Pros:
Fast insights and pre-campaign audience or persona tools.
New free and low-cost entry plans for testing the product.
Cons:
High-level conversational answers can miss the hard proof you need when asking “which exact creative element caused this lift.”
Claims of large ROAS lifts may require careful vetting and attribution work to confirm for your accounts.
Lower entry tiers may not include the cross-network joins and MMP mapping required to show tag-to-LTV links.
Pricing:
AdSkate announced free and early-access Lite plans, with the Lite plan shown at $29/month during early access. Enterprise tiers remain available via sales.
These ad analysis tools vary in depth, speed, and the type of creative evidence they provide. Your choice depends on the level of granularity you need and the scale of the campaigns you run. Choosing the right tool helps teams make creative decisions backed by measurable patterns instead of assumptions.
How to Choose The Best Ad Analysis Tools
You need tools that solve the exact problems you face. Use this checklist and score each vendor you consider:
Does it map creative tags to real KPIs? The ability to join tag-level creative signals to installs, CPA, ROAS, or LTV across networks is the single biggest differentiator for scaling. If a vendor doesn’t show unified tag→KPI joins, plan for extra engineering work or weaker causal claims.
Does it read all creative modes? Video, still images, on-screen text, and audio lines matter. Multimodal tagging matters when you run varied formats.
Does it connect natively to ad platforms and MMPs? Native or no-code connectors let you join creative tags to raw campaign metrics without long ETL projects.
Can it spot fatigue early and give the next steps? Fatigue alerts and automated suggestions let you pause asset loss before it wastes spend. Not every tool offers this.How easy is onboarding for your team size and volume? Tools with enterprise-grade features can take longer to set up. If you run many variants, invest in a platform built for scale.
Does it fit your workflow? If your work is research and idea generation, a creativity-first tool is a good fit. If your priority is per-element evidence tied to revenue, pick a tag-first analytics platform.
Pricing and trial availability: Try to test with real data. Vendors that offer trials or proof-of-value demos let you validate if the tag→KPI mapping holds up in your stack.
Choosing the right setup helps you stay focused on what moves your numbers and removes guesswork from your creative decisions.
Suggested Watch: Catch Creative Fatigue Before It Drains Budget with Segwise
Conclusion
A strong creative strategy starts with ad analysis tools that show which elements actually lift installs, improve user quality, and drive revenue. Once you work with clear, element-level signals instead of gut calls, your team makes sharper decisions, tests faster, and builds a creative engine that grows on evidence, not guesswork. The real advantage comes from choosing a platform built for your volume, channels, and data needs so every insight turns into action.
If you’re evaluating tools now, trying Segwise first could give you a head start in identifying top-performing creatives, spotting fatigue early, and making data-backed decisions fast. Segwise’s no-code integration with major ad networks and MMPs means you don’t need complex engineering to get started.
Start a Free Trial on Segwise today to connect creative tags to ROI, catch fatigue early, and build high-performing ad variations with AI-driven insights.
FAQs
1. Will ad analysis tools replace creative teams?
No, these tools speed up testing and point to what to try next, but creative teams still make judgment calls, craft brand voice, and turn ideas into assets.
2. How reliable is the link between a tagged element (like a CTA) and performance?
Element→metric links can be strong when tools join tags to real campaign data, but you should treat findings as testable hypotheses and validate with experiments tied to ROAS or LTV.
3. Can these platforms work after third-party cookies are gone?
Yes, many vendors use cookieless approaches, modeled audiences, or server-to-server joins to match creative signals to outcomes while respecting privacy rules.
4. What input is needed for useful insights from ad analysis tools?
You need the creative files, plus campaign performance data from your ad networks or MMP, so the platform can tag assets and link those tags to conversions and spend.
5. How can a small team check if a tool’s ROI is worth it?
Run a short proof-of-value: connect one campaign, test a small budget, measure if element-level suggestions lift key KPIs (CPA, installs, or retention), and compare that lift to subscription cost.
