ROAS Benchmarks by Industry: 2026 App Marketing Guide
Spending on ads can feel uncertain when it's hard to tell which campaigns actually pay back. Creative tests may not clearly show revenue impact, and platform averages alone don't reveal if your spend is efficient. Without reliable reference points, scaling campaigns or cutting budgets becomes a guessing game.
ROAS benchmarks by industry provide a clear context. They help you understand typical returns across different types of apps and ad platforms, so you can see where your campaigns perform above or below expected levels. Knowing these benchmarks allows you to make smarter decisions, optimize ad spend, and prioritize the campaigns that deliver real value.
In this blog, we'll break down industry-specific ROAS benchmarks for 2026, explain how to interpret them for your campaigns, and outline actionable steps to improve return on ad spend.
Updated July 2026.
Quick answer: a good ROAS in 2026 sits between 2:1 and 4:1 for most advertisers. Google Ads returns average around 3.7:1, Meta lands closer to 2.2:1, and TikTok near 1.4:1, while mobile app user-acquisition campaigns often run below 1:1 in the first week and only clear payback over a 30 to 90 day window as installed users monetize.
What is ROAS?
ROAS means Return on Ad Spend, showing how many dollars come back for every dollar spent on ads. For apps, this can include revenue from in-app purchases, subscriptions, or advertising.
A "good" ROAS shifts with the way your app earns money, but broader data gives a starting point. Google lists an average of around 2:1 in its Economic Impact findings, and results above that level are often viewed as strong on its shopping formats.
Mobile app campaigns tend to behave differently from ecommerce. Early user-acquisition efforts typically deliver lower ROAS, and some platform benchmarks show median results below 1.0 in the first stages of the user journey. Retargeting or subscription-driven campaigns, on the other hand, tend to show higher payback once users settle into regular engagement.
These ranges help with early expectations, but the right goal for you depends on your margins, the time it takes users to start paying back, and the long-term value they create after install.
Now that the basics are clear, you can move into the actual method used to calculate the metric.
How to Accurately Calculate ROAS for Mobile Apps
Start with the basic formula. Use revenue that you can reliably attribute to the campaign, and divide it by the ad spend tied to that campaign:
ROAS = Revenue attributed to ads ÷ Ad spend
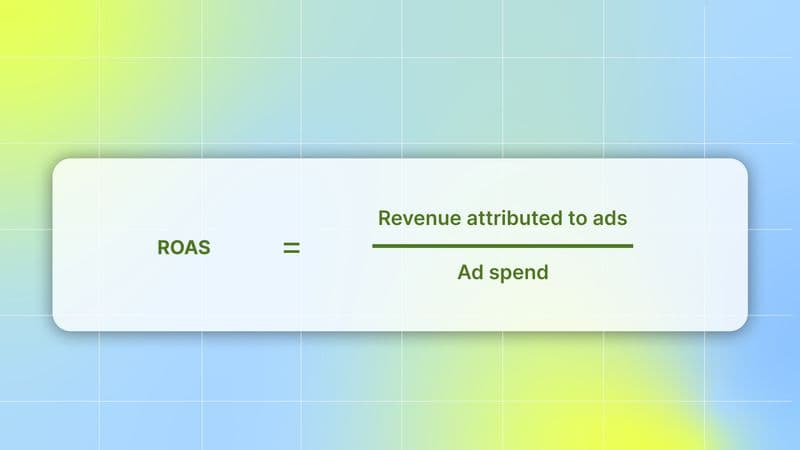
If a campaign drove $12,000 in tracked revenue and you spent $3,000 on the campaign, ROAS = 12,000 ÷ 3,000 = 4.
Key steps to make that number accurate for apps:
Decide which revenue streams you count: Choose the revenue sources you will include (for example: subscription payments, one-time purchases, in-app ads). Be consistent. Mixing definitions across campaigns will lead to misleading comparisons.
Pick a sensible attribution and LTV window: For many apps, a single-day ROAS is misleading. Measure ROAS over a set window, common choices are 7, 30, and 90 days, or use predicted LTV for subscription products. Match the window to how long users usually start paying or show value in your app. That gives you a clearer idea of whether an ad is truly profitable.
Use reliable attribution data: Rely on a mobile measurement partner or your attribution setup so ad spend and installs/events are matched correctly. Different attribution settings or windows can change ROAS a lot, so confirm the rules your partner uses.
Watch the difference between gross ROAS and profit ROAS: ROAS alone compares revenue to spend. To see if a campaign makes money after costs, compute a break-even ROAS using your gross profit margin. A common formula for break-even ROAS is 1 ÷ profit margin. For example, a 20% margin gives a break-even ROAS of 5 (1 ÷ 0.20 = 5). That means you need $5 in revenue for every $1 spent just to cover product costs. Use this when you judge whether to scale spend.
Attribute revenue by cohort, not only by immediate conversions: Group users by install date or campaign and track their cumulative revenue over your chosen window. Cohort ROAS prevents you from over- or undervaluing campaigns that deliver value over time. Use cohort reports, weekly or monthly, to identify which creatives or channels deliver the most long-term value.
This gives you a steady base to judge what's working, adjust your spend with confidence, and move into the next stage of growth with clarity. With the calculation method covered, you can compare your figures against several industries.
Average ROAS Benchmarks by Industry for 2026
When you plan ad spend for your app campaigns in 2026, knowing industry-specific ROAS benchmarks helps you set realistic expectations. Returns tightened over the past year: Google Ads ROAS declined across 13 of 14 industries as acquisition costs rose, so treat the figures below as moving reference points rather than fixed targets.
Below is a table showing industry median ROAS for three major ad platforms, Google Ads, Meta (Facebook/Instagram), and TikTok Ads, based on the latest aggregated ecommerce performance data heading into 2026:
Industry | Median Google Ads ROAS | Median Meta Ads ROAS | Median TikTok Ads ROAS |
Apparel | 4.48 | 2.96 | 1.69 |
Art | 5.06 | 1.94 | 1.34 |
Baby | 4 | 4.39 | 2.62 |
Beauty | 3.57 | 1.57 | 1.36 |
Books | 4.31 | 0.98 | 0.87 |
Electronics | 3.76 | 2.95 | 0.58 |
Food & Beverages | 3.45 | 1.67 | 1.26 |
Home & Garden | 3.9 | 2.6 | 4.89 |
Healthcare | 2.24 | 1.2 | 1.07 |
Fashion Accessories | 4.07 | 2.65 | 3.09 |
Pet Supplies | 1.74 | 1.78 | 0.45 |
Toys | 6.07 | 2.69 | 1.08 |
Sporting & Fitness | 4.35 | 2.41 | 1.14 |
Figures reflect directional 2026 ecommerce ROAS benchmarks compiled from platform performance data, cross-checked against the year-over-year Google Ads decline noted above.
Values in this table reflect common benchmark ranges based on recent industry performance data and trends heading into 2026. These should not replace your own measured results; they serve as reference points when assessing platform performance.
These reference points set the stage for understanding what they mean in practice and how to use them to guide improvements.
Also Read: Benchmark ROAS For Mobile Games In Different Countries And Across Different Ad-Networks
Mobile App ROAS Benchmarks by Vertical for 2026
Ecommerce ROAS is measured close to the point of sale, but mobile apps earn spend back gradually, so app teams track ROAS at day 7, day 30, and day 90 after install. The table below shows typical D7, D30, and D90 ROAS targets by app vertical for 2026.
App vertical | Target D7 ROAS | Target D30 ROAS | Target D90 ROAS |
Subscription apps | 15-30% | 40-70% | 70-110% |
Casual games | 25-50% | 50-90% | 90-140% |
Hypercasual games | 50-90% | 80-120% | 110-150% |
Mid-core / strategy games | 15-35% | 35-70% | 70-120% |
eCommerce / DTC apps | 30-80% | 80-150% | 150-300% |
Dating apps | 10-25% | 30-60% | 60-100% |
FinTech apps | 5-15% | 20-50% | 50-100% |
These targets sit against a tougher acquisition market. Global mobile CPI rose 8.4% to $1.12, with iOS near $3.83 and Android near $0.66, so hitting the same ROAS now takes more efficient creative and tighter targeting.
Because app payback compounds over 30 to 90 days, the creative you launch in week one largely sets the ceiling. Segwise's Creative Tagging Agent automatically tags every hook, CTA, character, and visual element across images, videos, and playables, then maps each tag to ROAS, so you can scale the elements driving returns and cut the ones that do not.
How ROAS Benchmarks Apply to Your Campaigns and What You Can Do to Improve
For 2026 planning, median values indicate typical performance levels, but what matters most is how you improve your own results based on your user and revenue patterns. This brings the insights into one place, showing what the benchmarks mean for your campaigns and how you can improve ROAS over time.
Understanding the Baselines
Across the aggregated data heading into 2026, typical median ROAS figures you'll encounter are: Google Ads ~3.7x, Meta (Facebook/Instagram) ~2.2x, and TikTok Ads ~1.4x. These reflect average performance across many industries and campaign types.
These medians are not targets you have to hit every quarter. They are benchmarks that help you see where your ads stand, especially when you run similar campaigns.
What These Figures Actually Tell You
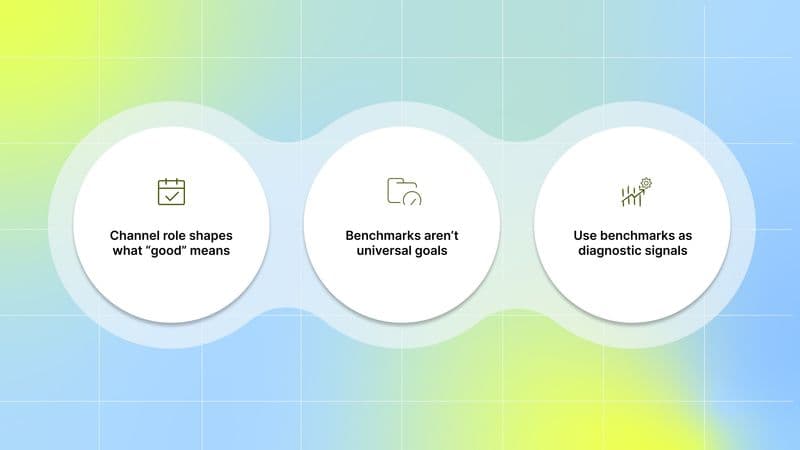
1. Channel role shapes what "good" means
Search traffic tends to show higher ROAS because people are already looking to take action.
Social platforms often deliver lower immediate ROAS because many users are discovering rather than being ready to convert.
2. Benchmarks aren't universal goals
A 2x ROAS on a single platform may be acceptable if your users make repeat purchases or generate high lifetime value (LTV). A 4x target might be essential if your margins are tight.
3. Use benchmarks as diagnostic signals
If your campaigns lag behind these medians, look closely at creative quality, audience fit, bidding approach, and measurement accuracy before pulling budgets.
Now let's tie these insights into clear, practical ways to improve ROAS.
Ways to Improve Your ROAS
These steps work together to help you reduce wasted spend and increase revenue per ad dollar, the definition of better ROAS.
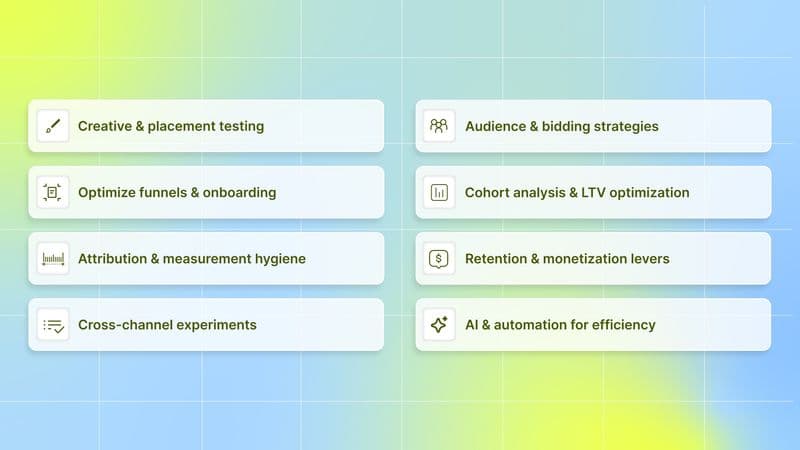
1. Creative & placement testing
Create multiple versions of your ads with different visuals, text, and hooks. Test them across placements such as feed, reels, and stories. A strong creative often drives higher conversions faster.
Tip: Swap out the creative weekly if performance drops.
2. Audience & bidding strategies
Split your spend across distinct audience segments such as lookalike, retargeting, and cold interest groups. Use automated bidding, like value optimization, where available, so the platform can focus on users more likely to generate revenue.
Tip: Warm audiences usually show higher ROAS than broad cold audiences.
3. Optimize funnels & onboarding
If your onboarding flow is long or confusing, you lose users early. Tighten steps so users reach the first key value quickly and start generating revenue sooner.
Tip: Track and resolve drop-off points between installation and the first purchase.
4. Cohort analysis & LTV optimization
Review user groups (cohorts) over the 7/30/90 days to see how much they spend over time. If users tend to spend more later, it's fine to accept a lower initial ROAS.
Tip: Use LTV to justify higher early spend if long-term revenue is strong.
5. Attribution & measurement hygiene
Make sure your tracking is accurate. Platform reports can overstate ROAS by attributing revenue that may belong to other touchpoints. Use consistent analytics and third-party tools to reconcile real revenue to ad spend.
Tip: Check your attributed revenue weekly and fix any reporting gaps.
6. Retention & monetization levers
Once users install or sign up, keep them engaged. Retention flows, such as push notifications or email sequences, bring users back to the app, increasing lifetime revenue and boosting eventual ROAS.
Tip: Even a small bump in 30-day retention can lift long-term returns.
7. Cross-channel experiments
Don't silo platforms. Use discovery channels (such as TikTok) to drive audiences into higher-intent channels (such as search). A cross-channel strategy often yields blended ROAS that's stronger than platform ROAS alone.
Tip: Run lift tests to see how one channel helps another.
8. AI & automation for efficiency
Modern platforms can automatically optimize bids and placements when guided by clear goals and high-quality data. Use AI-driven tools and machine learning where possible, especially for creative scoring and bid adjustments.
Tip: Keep human oversight; automation fills gaps, but needs good signals to work well.
Apply these points consistently, and you'll build a setup that keeps improving your returns over time.
Also read: CPI, IPM, and ROAS Benchmarks for Optimizing Ad Spend
Conclusion
Use ROAS benchmarks by industry to set realistic targets, then turn those gaps into a short list of experiments (creative variants, audience splits, and attribution windows) that prove what actually moves revenue for your app. Prioritize tests that lift profit after costs and measure results by cohort, so you see true payback over 7/30/90 days. Constant, small experiments focused on creative signals and funnel fixes will compound into steadily better returns.
After you use benchmarks and quick experiments to find gaps, the next step is to connect creative signals to real outcomes so you can scale the winners and stop the spend that doesn't pay back.
That's where Segwise comes in, an AI‑firstcreative analyticsplatform that automatically tags creative elements such as hook scenes, opening dialogues, headlines, characters, influencer traits, CTA text, CTA dialogue, and audio cues across images, videos, playables, and copy. It then links these tags to key metrics like ROAS, CTR, IPM, and retention.
By consolidating data from major ad networks and measurement partners, Segwise highlights creative fatigue and identifies which elements consistently drive higher returns, helping you make evidence-based decisions rather than relying on guesswork.
Segwise offers a free trial with no credit card or engineering required, so you can connect ad accounts, surface the creative patterns tied to higher ROAS, and test whether those insights change your campaign outcomes.
FAQ's
1. What are industry-specific ROAS benchmarks, and why use them?
ROAS benchmarks by industry are typical return-on-ad-spend figures broken down by sector and platform; they provide context so marketers can determine whether a campaign is underperforming or on track.
2. What counts as a "good" ROAS for mobile apps?
A "good" ROAS varies by business model and margins, but many sources use a rough range of ~2:1 - 4:1 as a planning reference; compute break-even ROAS as 1 ÷ profit margin to know your true target.
3. Which ROAS time window should app teams use (day 1, 7, 30, 90)?
Measure ROAS over windows that match how users monetize common choices, such as 7/30/90 days or predicted LTV for subscriptions, and use cohort reports so long-term payback isn't missed.
4. Why do Google, Meta, and TikTok show different ROAS benchmarks?
Platforms serve different user intents: search usually yields higher immediate ROAS, while social platforms often drive discovery and lower short-term ROAS. Compare platform benchmarks separately.
5. What quick actions usually lift ROAS the fastest?
Run creative A/B tests, tighten onboarding to speed first purchase, split audiences (retargeting vs cold), and fix attribution/reporting gaps. These moves typically improve return on ad spend the fastest.
6. What is a good ROAS in 2026?
For most advertisers a good ROAS sits between 2:1 and 4:1, with Google Ads averaging around 3.7x, Meta near 2.2x, and TikTok near 1.4x. The real target is your break-even ROAS, calculated as 1 divided by your profit margin.
7. What D7 and D30 ROAS should mobile apps target in 2026?
App targets vary by vertical: D7 ROAS commonly runs 15-50% and D30 ROAS 40-90%, with hypercasual games aiming highest because their payback compresses into the first week. Subscription and FinTech apps accept lower early ROAS and rely on D90 payback.
8. Are ROAS benchmarks rising or falling in 2026?
They are tightening. Google Ads ROAS declined across 13 of 14 industries year over year, while global mobile CPI rose 8.4% to $1.12, so the same return now takes more efficient creative and measurement.