
Creative Analytics
See exactly which creative elements drive your ROAS.
Segwise brings creative-level performance from 15+ ad networks and MMPs into one view, so you can see which creatives, hooks and formats actually earn their spend and cut the ones quietly draining it.
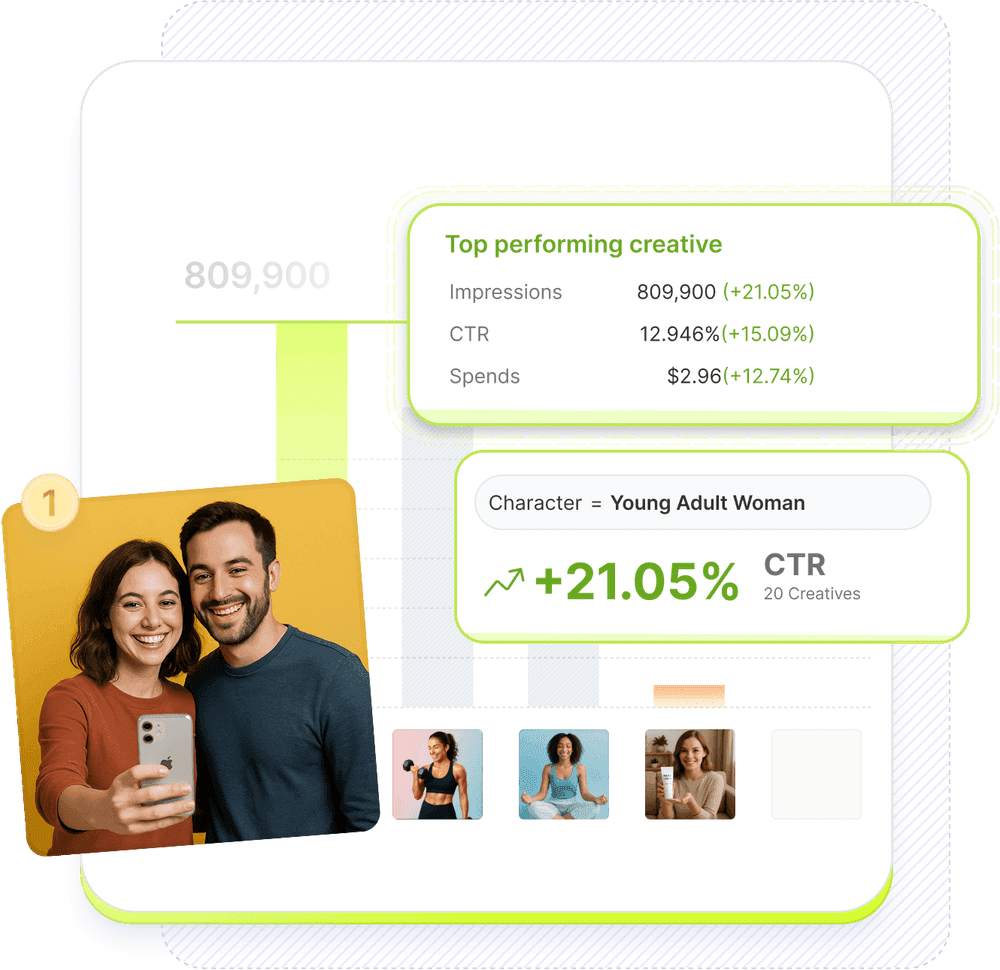
See why some creatives win and others drain spend.

One Place for All Your Creative Data
Stop jumping between Facebook Ads Manager, Google Ads, TikTok, and your MMP dashboard. See creative-level ROAS, CPA, LTV, and conversion rates from all sources in one unified view.
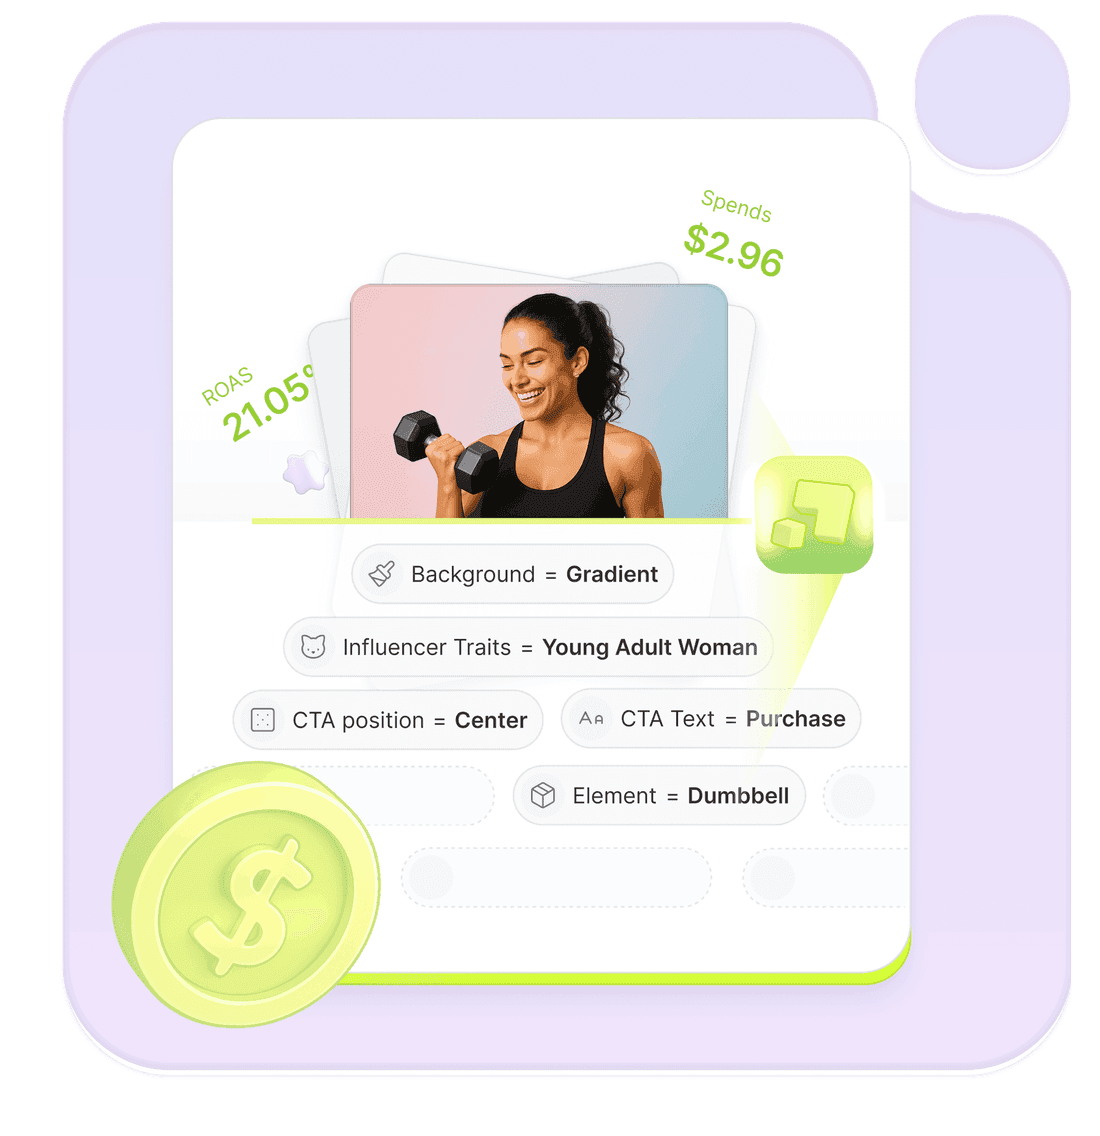
Tag-Level Creative Element Mapping
See which specific creative elements drive performance. Discover patterns like "this hook dialogue appears in 80% of our top-performing creatives" with complete MMP attribution integration.
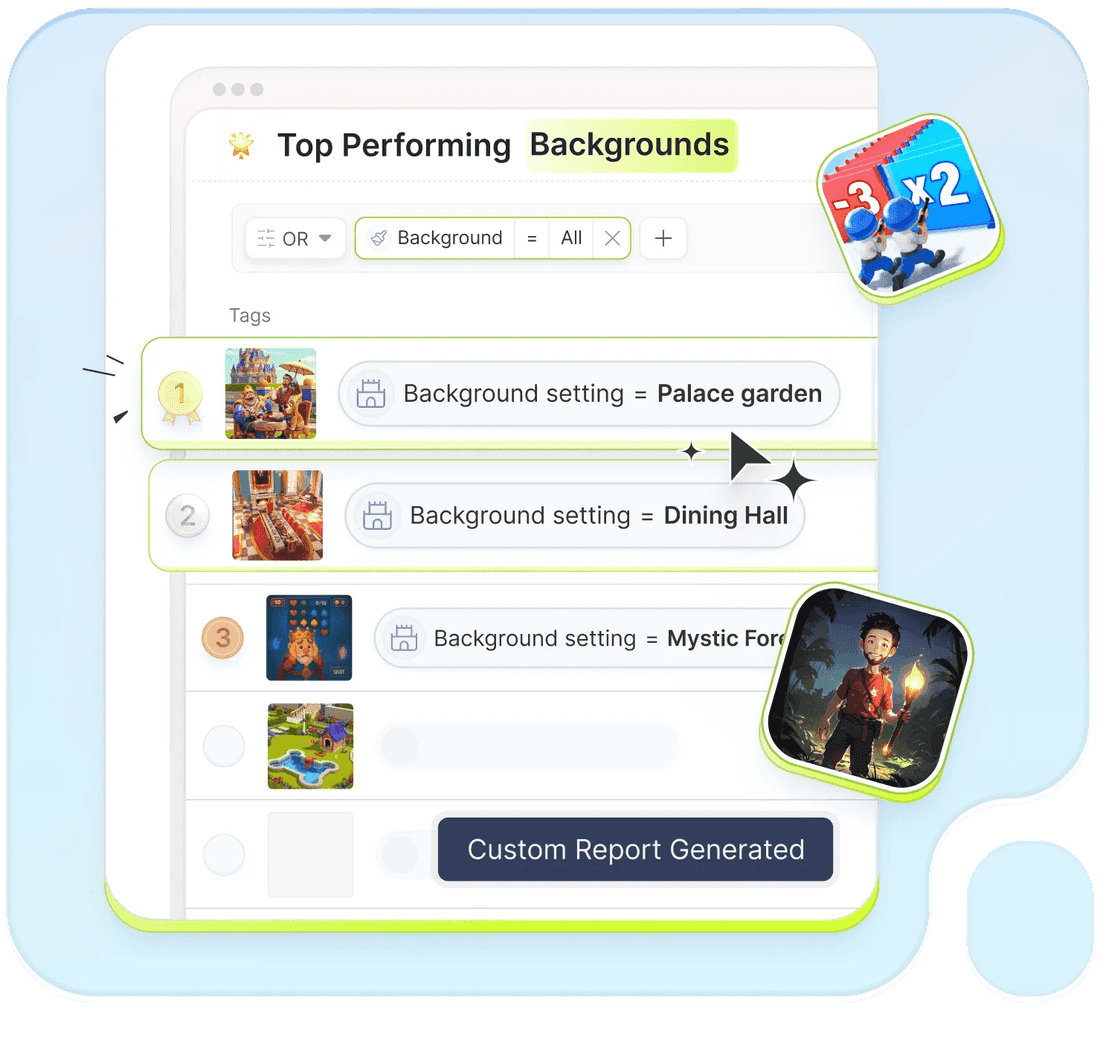
Custom Dashboards and Reporting
Build dashboards around your specific KPIs and stakeholder needs. Create automated reports that show how creative decisions impact ROAS across all your apps and campaigns.
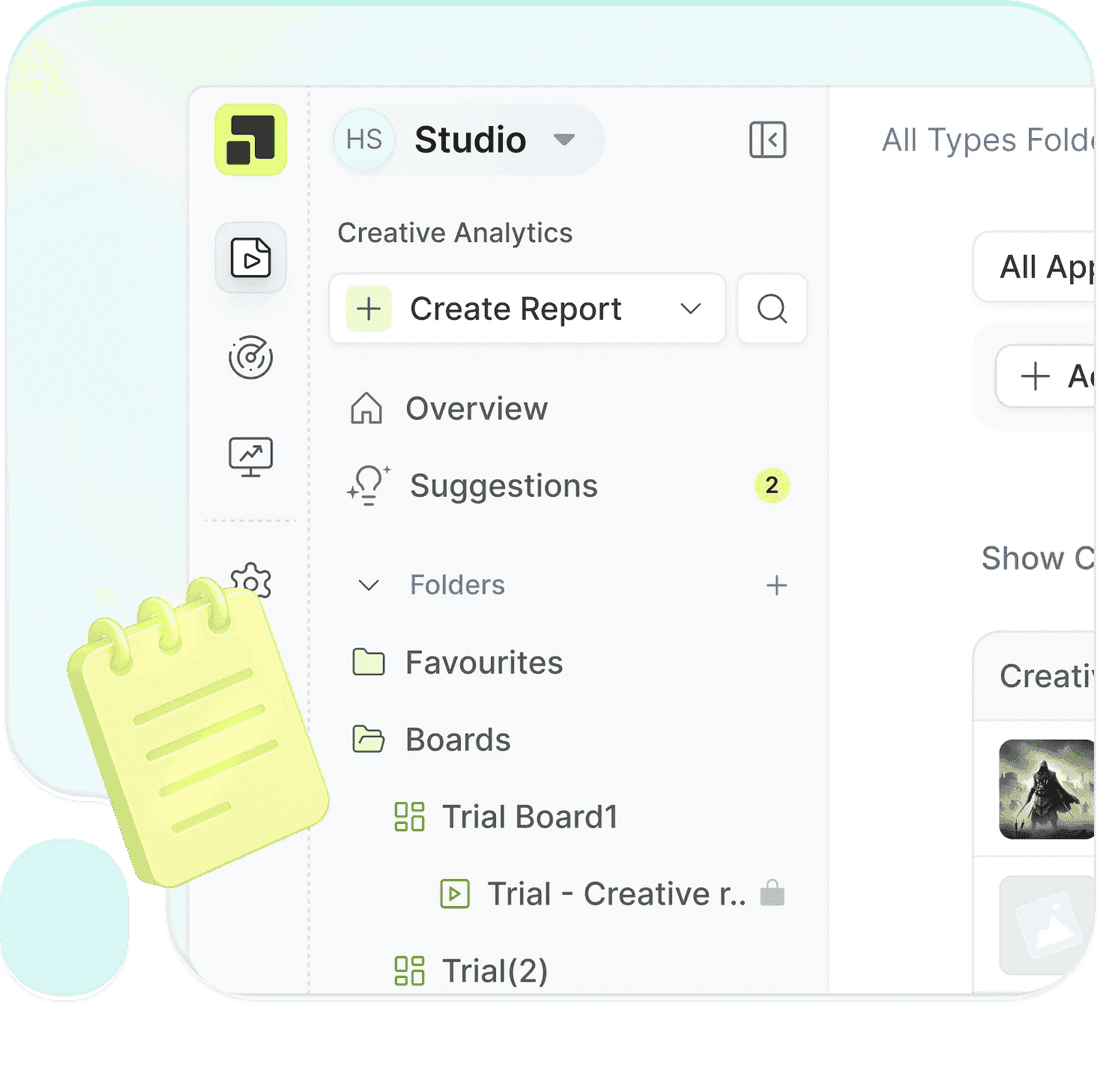
Studio View for Multiple Projects
Manage creative analytics for multiple apps, games, or brands from one unified interface. Switch between projects instantly while maintaining consistent performance tracking across your entire portfolio.
Integrations
Connect your ad accounts.
Segwise shows you what wins.
Plug in 15+ ad networks and MMPs in minutes, with no code. Then see which parts of your ads bring in the results.











 Branch


 AppsFlyer
 StackAdapt
 Adjust
SOC 2 Type II compliant
Role-based access · Isolated customer workspaces
Why performance marketers choose Segwise Creative Analytics
Better Team Collaboration
Invite team members with role-based access and share customizable reports without overwhelming stakeholders with unnecessary data.
Comprehensive Dashboard
Unified view of ad network and MMP data eliminates manual data collection across multiple platforms.
Performance Data Mapping
Connect creative elements to ROAS outcomes and understand which hook scenes, dialogue, and visuals drive the highest returns.
Data-Backed Creative Iteration
Make creative decisions based on actual performance data from both ad networks and MMPs to scale winners and avoid losers.
Tag-Level Performance Optimization
Instantly see which creative elements, themes, and formats drive results across all your campaigns and apps.
Multi-Project Management
Studio View enables creative analytics across multiple apps, games, or brands from one unified interface.
Frequently asked questions
Do I have to build dashboards, or can I just ask?
You can just ask. The analytics are powered by the Creative Strategy Agent, so you can ask it anything about your creative performance in plain language and get a straight answer, no dashboard-building required.
How is this different from the analytics in my ad network dashboards?
Ad network dashboards stop at campaigns and ad sets. Segwise connects the creative itself, every hook, CTA, and visual, to spend, ROAS, CPI, CPA, and downstream revenue across 15+ networks and your MMP in one view. You see which elements drive results, not just which campaigns spent.
What can I measure at the creative level?
Impressions, clicks, installs, CPI, ROAS, CTR, CVR, and spend, plus your own custom events pulled from ad networks and MMPs, all broken down by any creative tag.
Do I have to tag creatives before I can analyze them?
No. The Creative Tagging Agent auto-tags every creative and maps those tags to performance for you, so the analysis is ready without any manual labeling.
Can I manage more than one app or brand?
Yes. Studio View keeps each app, brand, or client in its own reporting context inside one workspace, so nothing mixes.
Stop guessing which creatives earn their spend.
Explore more
More Segwise features
Creative Intelligence
Turn your creative data into insights and data-backed ads.
ExploreCreative Tagging
Stop tagging your ad creatives manually.
ExploreCreative Strategy Agent
Your always-on AI creative strategist.
ExploreFatigue Tracking
Catch creative fatigue before it burns your budget.
ExploreAI Creative Generation
Generate winning ad creatives from what's already working for you.
ExploreCompetitor Tracking
See what your competitors are running, and the gaps you can own.
ExplorePlayable Ad Generation
Get winning playable ads, backed by your data.
ExplorePre-flight Testing
Test your ad creatives before you spend marketing dollars on them.
ExploreCTV Ad Generation