Mobile Gaming Statistics 2026: Market Size, Revenue and Trends
Mobile games generated about $92 billion in 2024, roughly 49% of the entire $187.7 billion global games market, and mobile stays the industry's largest segment heading into 2026. There are now over 3.3 billion gamers worldwide, and about 80% of them play on mobile. After the pandemic boom cooled in 2022 to 2023, the market returned to growth in 2024, and the mobile segment is forecast to reach roughly $103 billion by 2027.
Updated July 2026.
This guide covers the key mobile gaming statistics for 2026, including market size, player behavior, revenue patterns, and user acquisition tactics. It gives developers, marketers, and publishers actionable benchmarks to optimize creative strategies, set realistic KPIs, and plan for sustainable growth. Every figure below is hyperlinked inline to its 2026 source, drawn from the latest reports by Udonis, AppsFlyer, Adjust, and AppMagic.
Global Mobile Gaming Market Overview
For mobile gaming marketing teams, these facts show where budget and creative effort matter most in 2026.
1. Market Size and Revenue
Mobile accounts for nearly half of global game revenue, sitting inside a $187.7 billion global games market. Mobile generated about $92 billion (49%) in 2024, with console at roughly $51 billion (28%) and PC at about $43 billion (23%). Mobile keeps the largest share of industry revenue, so user acquisition and retention on mobile remain high-priority investments for marketers. By 2025, mobile accounted for 55% of the gaming industry's total revenue.
2. Regional Market Distribution
Emerging markets are driving consumer-spend growth, with 2024 gains led by:
These markets are essential for scaling IAP campaigns and regional UA.
3. Growth Projections and Market Rhythm
The global games market is forecast to approach $205 billion by 2026, with the mobile segment reaching roughly $103 billion by 2027. After the 2022 to 2023 correction, the market returned to growth in 2024, which supports steadier planning for spend and product roadmaps.
Market value shows only part of the story. To develop user acquisition strategies, you also need to know how often players download games and how engaged they stay after installs.
Downloads and User Engagement Statistics
Mobile gaming marketing teams need clear download and engagement signals to set UA and retention targets for 2026.
1. Download Trends
The market is saturating fast: app releases grew 25% year-over-year to more than 1.4 million in 2025, yet only about 10% capture any user attention.
Games now dominate release volume: the games' share of all releases rose from 63% in 2024 to 72% in 2025, intensifying competition for installs.
Top download markets remain India (the number one market with over 25 billion downloads), the United States, and Brazil, while Indonesia posted standout growth with downloads up 10%.
With visibility harder to win than ever, efficient user acquisition and stronger retention matter more than raw volume. Growth markets like Indonesia are worth exploring for their potential to drive lower-cost scale and increased engagement.
2. Genre Performance by Downloads
Hyper casual games accounted for the largest share of gaming installs in 2025 at 29.1%, followed by casual and hybrid casual (just over 10% each), puzzle (10%), and action (8%).
Install growth was led by slots (+46%), casino (+22%), and casual (+19%), while strategy saw the biggest jump in sessions, up 57%, signaling growing engagement in mid-core experiences.
High-download genres offer a broad reach for UA creatives, while rising genres (such as strategy) indicate pockets where paid LTV can outperform install volume. Creative messaging and ad creatives should reflect the gameplay expectations of each genre to improve the conversion from install to retention.
High download numbers do not necessarily lead to high revenue. Analyzing monetization patterns reveals which markets and genres truly generate the best returns.
Revenue and Monetization Analysis
Revenue insights show which markets and genres deliver the highest return on acquisition:
1. Top Revenue Markets (IAP focus)
In-app purchase revenue across casual, mid-core, and hyper casual games grew to $81.8 billion in 2025, the third consecutive year of growth across the App Store and Google Play. The United States remains the single biggest source of consumer spend, absorbing roughly half of all gaming user acquisition spend.
Implication: campaigns that optimize for high-value US cohorts and prioritize LTV forecasting will often outperform broad, low-ARPU scale buys.
2. Revenue by Genre
Mid-core genres such as RPGs and strategy lead spending, monetizing heavily through in-app purchases, while casual puzzle titles drive the broadest reach. Free-to-play remains dominant, generating 85% of all game revenue.
3. Revenue vs. Downloads Paradox
The install-to-revenue gap is stark: hyper casual games make up 29.1% of installs but only about 15% of sessions, whereas mid-core RPG and strategy titles monetize far above their install share. Small-install genres can achieve outsized monetization, justifying higher UA bids per install.
Prioritize LTV models and cohort testing. Bids and creatives for high-ARPU genres can be set higher per install, while broad-reach creatives can serve discovery for high-download casual titles.
4. Monetization Mix and Player Behavior
Hybrid is now standard: the industry has shifted decisively toward hybrid monetization that blends in-app purchases, ads, and subscriptions, so reliance on a single channel is shrinking.
In-app advertising: global in-app ad spend is projected to reach about $390 billion in 2025, averaging $59.23 per mobile internet user, which supports rewarded and ad-funded models alongside IAP.
In-game ad revenue: grows from $9.39 billion in 2025 to about $10.10 billion in 2026, drawing more non-endemic brands into games.
Actionable note for teams: blend rewarded ads and IAP funnels to capture both non-paying users (ad revenue) and payers (IAP). Use ARPU targets to back into acceptable CPA and bid ranges for each market and genre.
Revenue trends become clearer when you understand the key players and their interactions with mobile games. Demographic and behavioral data help refine both targeting and creative strategy.
Mobile Gamer Demographics and Behavior
To plan user acquisition, retention, and monetization effectively, you need a clear understanding of who your players are, how they spend their time, and what keeps them engaged.
Who the Players Are:
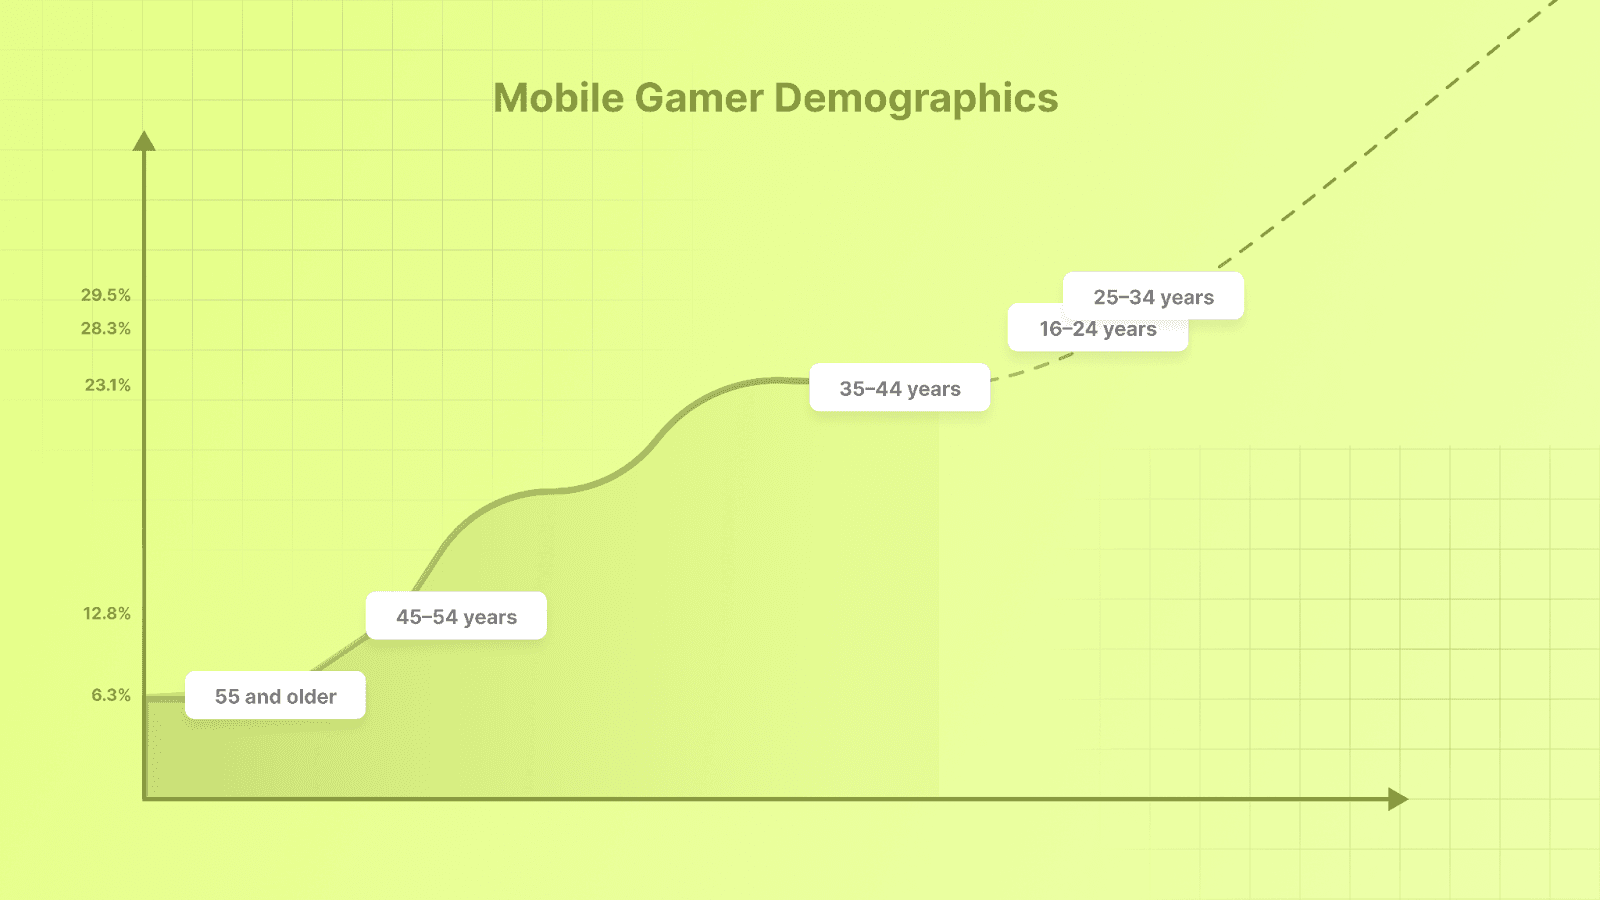
Gaming is now mainstream across every age group. There are over 3.3 billion players worldwide, about half the global population, and the average US gamer is 36 years old. The gender split is nearly even: about 46% female and 53% male among US players, with women driving a large share of mobile in-app purchases. Campaigns should appeal to both casual younger players and older cohorts with stronger spending power.
How Players Use Mobile Games
In 2025, players spent a total of 444.6 billion hours in mobile games, a 1% year-over-year increase. Engagement varies sharply by genre:
Average session length (Adjust, 2025): action leads at 43.8 minutes, strategy at 37.5 minutes (+18% YoY), and racing at 16.3 minutes (+17%)
Day-0 sessions per user: stable at 1.65 in 2025
Casual players dip in and out, while mid-core and action genres draw longer, more frequent sessions. These benchmarks help you set expectations for session depth and retention in your own campaigns.
Generational Platform Preferences
Mobile is the most common gaming device, and in the US 70% of players game on smartphones, roughly 50% on consoles, and about 40% on PC (with overlap). This confirms that mobile-first ad formats (short-form video, playable ads, rewarded ads) should be the focus when targeting younger cohorts, while older players may respond better to messaging that bridges across devices.
What Keeps Players Coming Back
Motivations include stress relief, passing the time, social interaction, and in-game rewards. After 30 days, players are most likely to return when:
They see new content updates
Friends share their progress or social invites
They receive return rewards or bonuses
Designing campaigns that highlight updates, social proof, and timed rewards will support both re-engagement and long-term retention.
While demographics provide a broad view of the audience, the top-performing games and publishers show what success looks like in practice.
Also read: Why Creative Tagging Matters for Mobile Game Marketers in 2025
Top Games and Publisher Performance
Understanding which games and publishers lead the market helps reveal where user interest and spending power are concentrated.
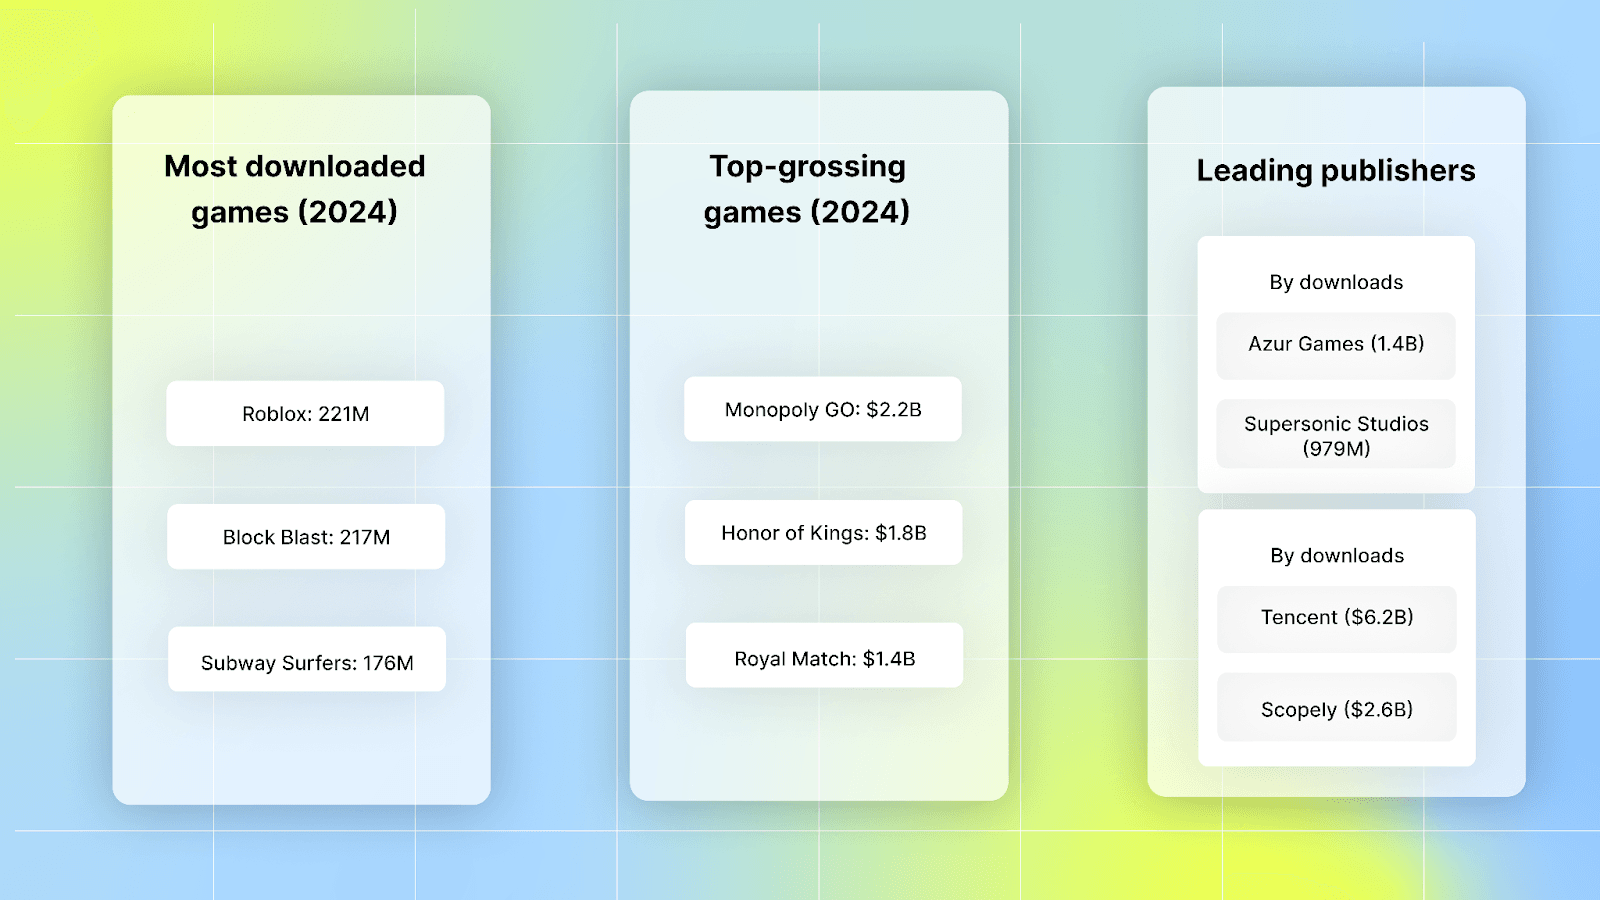
1. Most downloaded games (2025):
The top mobile games by global downloads in 2025 were Block Blast!, Roblox, Garena Free Fire, and Subway Surfers, with puzzle and action titles leading install charts across regions.
2. Top-grossing games (all-time):
Newer breakout hits show the ceiling is still rising: Last War: Survival grew to about $1.15 billion in revenue within a year.
3. Leading companies:
By overall game revenue, Sony leads at about $31 billion, followed by Tencent at roughly $25.5 billion and Microsoft at about $21.5 billion. Tencent remains the dominant mobile publisher, powered by Honor of Kings.
These numbers show two sides of the market. Download leaders drive broad install volume, while revenue leaders highlight where high-value players spend. As a marketer, studying the creatives, live ops cadence, and monetization tactics of these top performers can provide direction for your own strategy.
But to stay ahead, you also need to understand how the advertising landscape and UA tactics are changing.
Marketing and User Acquisition Trends
For mobile gaming marketing teams, the 2025 ad market reshapes how UA, creative production, and budget planning should be done. The numbers below show where to focus efforts and why.
1. Rapid Growth in Advertisers and Creatives
The number of mobile game advertisers surged about 60% year-over-year to roughly 260,000 by 2024 as user acquisition ramped back up. AI has become the default in creative production: 56% of the top 100 grossing mobile games used AI to produce ad creatives in 2025, and smaller advertisers scaled creative output 20% to 40% year-over-year to keep pace. Competition for attention is higher, making fresh, well-tested creatives more essential than ever.
More advertisers and more creatives drive up noise. Marketing teams should prioritize faster creative testing, tighter KPI tracking, and clearer creative hooks to keep CPAs under control.
2. Platform Split and Cost Pressure
Platform economics diverge sharply. Android skews toward paid acquisition with 59% of installs coming from paid, versus 44% on iOS, which has stronger organic pull but higher media costs. Costs are climbing across the board: global cost per install rose 30% year-over-year to $0.56 in 2025, with US CPI reaching $1.71 and US cost per click hitting $0.13. The paid-to-organic ratio also jumped 61% globally, from 2.07 to 3.33.
For campaign planning, Android offers scale for broad testing and volume buys, while iOS attracts higher-value users at a higher cost, so creative pipelines and bids should be tailored to each platform rather than being one-size-fits-all.
3. Ad Spend Outlook and Format Trends
Total gaming UA spend reached $25 billion in 2025 (+3.8% YoY), with paid install share up 10% and ad impressions up 20%, even as US gaming ad spend dropped 5% year-over-year under high costs. The broader mobile ad market is forecast to grow from $402 billion in 2024 to about $492 billion in 2026. One structural shift to watch: China-headquartered publishers grew their global UA spend share 22% year-over-year to 35% of the market.
With costs rising, disciplined market and genre selection matters more than raw scale. Marketing teams should balance spend between high-ARPU geos and lower-cost growth markets while watching creative ROI and frequency caps closely.
What This Means Operationally
Creative ops: Build templates for rapid variants, prioritize image + short-form video hybrids, and automate A/B testing where possible. (Data shows monthly new creatives make up about half of all creatives on each platform.)
Channel mix: Use Android for broad reach and cost-efficient installs; use iOS for targeted, higher-LTV cohorts with a faster refresh cadence.
Budgeting: Expect rising competition in major markets; set ARPDAU/ARPU-based bid caps and shift toward geos with improving revenue trends when CPIs spike.
Creative format: Test image-first creatives alongside short video cuts and playables. Track creative fatigue closely, as the number of creatives and advertisers is growing rapidly.
These 2025 advertising and UA trends shape mobile gaming competition. Marketing teams should accelerate creative testing, optimize platform pipelines, and align bids to ARPU for sustainable growth. While broader trends are helpful, success relies on measurable goals, with genre-specific KPIs providing benchmarks for effective performance.
Also Read: Creative Optimization in 2025: Actionable Insights Report
Key Performance Indicators by Genre
These KPIs show what healthy games look like by genre. Marketing teams can use them to set realistic D1/D7/D28 goals, plan creative cadence, and choose channels.
1. Retention Metrics (Benchmarks)
The day-1 retention rate across all gaming apps held steady at 27% in 2025, with hybrid casual and hyper casual games highest at 27% each. By region, day-1 retention was:
How to use these figures: treat the 27% all-games rate as a baseline and the genre and regional leaders as stretch targets. Aim to keep day-1 retention at or above your genre norm for a given cohort, which signals early product and creative fit, then track later windows to measure whether live ops and retention hooks are working. Retention is now the priority metric as acquisition costs climb.
2. Engagement Metrics (Sessions, Session Length, Efficiency)
Average session length (2025)
Action: 43.8 min (longest of any genre)
Strategy: 37.5 min (+18% YoY)
Racing: 16.3 min (+17% YoY)
Day-0 sessions per user
Install efficiency (IPM)
Practical context for marketers:
Long-session genres (action, strategy) increase the likelihood of conversion via IAP or subscription, so bid and creative strategies should support longer onboarding and deeper funnels.
Casual titles drive scale with more frequent, shorter sessions; creatives must focus on an instant hook and repeatability to lift day-1 retention.
IPM helps judge whether a creative attracts genuinely interested users; a high IPM indicates quality installs worth higher bids.
3. Benchmarks to Set In 2026
Day-1 target: aim to match or beat the 27% all-games baseline for your genre, stretching toward regional leaders (Japan at 25% overall) where CAC allows.
Later windows: track the drop from day 1; if retention decays faster than your genre norm, prioritize onboarding fixes and incentivized re-engagement.
Cost discipline: with global CPI up 30% to $0.56 (and US CPI at $1.71), watch paid-to-organic ratios and shift budget toward geos with improving efficiency when costs spike.
Use session length and frequency to choose ad-format placement (rewarded ads suit longer sessions; interstitials fit short-session casuals).
KPIs set the targets for today. The next step is to look ahead at the trends and innovations that will shape mobile gaming and marketing strategies beyond 2026.
Also Read: Creative Analytics Explained: How To Track, Measure, And Improve Ad Performance
Emerging Trends and Future Outlook
These trends shape UA strategy, monetization, and product roadmaps through 2026 and beyond:
1. Major Market Trends (Clear Signals)
AI-generated creatives are now standard: 56% of the top 100 grossing mobile games used AI to produce ad creatives in 2025. AI largely solved the production bottleneck, so attention, not production capacity, is now the constraint.
Retention-first growth: with acquisition costs rising, retention has become the priority play, and studios are investing in D2C and web stores to own player relationships and higher-margin revenue.
Privacy adaptation: consent is improving, with gaming ATT opt-in rates reaching 39% globally in Q1 2026 (and 51% in India). First-party data and creative testing matter more than ever.
Hybrid monetization: combining IAP, ads, and subscriptions is now standard, and reliance on a single method is shrinking.
2. Technological Shifts to Watch
In-app bidding dominance: Programmatic in-app bidding has replaced old waterfall setups for ad monetization, changing eCPM dynamics and yield strategies.
Better targeting & UA tactics: Innovative marketing and improved UA approaches are becoming essential in the new privacy environment (more tests, content-first creative strategies).
3. Market Predictions and Scale
Store saturation: more than 1.4 million apps launched in 2025 (up 25% YoY), yet only about 10% capture any user attention, so competition for installs is fierce.
Emerging market growth: emerging markets such as Turkey, Mexico, and India are fueling consumer-spend growth and should stay part of expansion plans.
Player preferences will shift: Players are moving toward games that reward time and social interaction, and they favor hybrid monetization and frequent content drops.
For marketing teams, these KPIs and trends create a clear playbook: set genre-specific retention and engagement targets, match creative and channel strategy to session patterns, and lean into hybrid monetization and privacy-aware UA methods to win in 2026.
Also Read: Top Creative Analytics Tools for Successful Ad Campaigns 2025
Conclusion
Mobile gaming marketing teams should focus on a short list of practical moves: set clear genre-specific KPIs, tighten creative testing and tagging workflows, and align monetization to player life cycles. These steps turn the trends and KPIs in the post into measurable priorities for campaign planning and budget decisions.
Segwise automates creative tagging across images, video, and playable ads using AI agents that label hooks, characters, visuals, and audio, and it is the only platform that tags playable (interactive) ads, a critical capability for mobile gaming advertisers. It connects those tags to performance metrics (ROAS, CPI, CTR), catches creative fatigue early, and surfaces tag-level analytics so teams can see which creative elements correlate with results. Through no-code integrations, Segwise unifies data from 15+ ad networks and MMPs into customizable dashboards, and its Creative Strategy Agent (AI Chat) lets you ask anything about your creative performance in plain language, while the Creative Generation Agent turns winning patterns into net-new image, video, and playable creatives.
Start your 7-day free trial today. No credit card or engineering required.
FAQs
1. How big is the mobile gaming market in 2026?
Mobile is the largest segment of the games industry. Mobile games generated about $92 billion in 2024, roughly 49% of the $187.7 billion global games market, and accounted for 55% of total gaming revenue in 2025. The mobile segment is forecast to reach roughly $103 billion by 2027.
2. What is the average cost per install (CPI) for mobile games in 2026?
Global gaming CPI rose 30% year-over-year to $0.56 in 2025, while US CPI reached $1.71. Costs vary widely by genre and region, with slots and idle RPG among the most expensive to acquire.
3. How do you pick the right LTV window for measuring campaign performance?
Start by comparing cohort curves at 30, 60, and 90 days; pick the earliest window that reliably correlates with long-term revenue for your genre. Use the window that best predicts payback/ROAS for cohorts used in scaling decisions. Validate with holdback experiments (keep a small test cohort unscaled and compare full-year outcomes).
4. How can you effectively localize creatives for new markets without a large team?
Build modular ads (replace text/voice/UI overlays without redoing assets), run small A/B tests with local testers or quick market samples, and scale only the variants that improve installs + early retention. Automate tagging to identify which localized elements actually impact metrics before a broad roll-out.
5. What steps can you take to spot and reduce ad fraud in UA campaigns?
Use a reputable MMP, along with a fraud-detection layer, to monitor anomalies (such as spikes in install volume, extremely low click-to-install times, unusually high CTRs, or short session lengths). Set automated rules to quarantine suspicious publishers/geos. Combine real-time blocking with post-attribution audits and maintain a blacklist of bad sources. External fraud partners (or MMP fraud suites) are standard practice.
6. When is influencer marketing more useful than paid user acquisition?
Use influencers for discovery, community-building, and activation around soft launches or live ops. They are best when you need social proof or organic momentum. Use paid UA when you need predictable scale, clear attribution, and fast experimentation. Combine both: run influencer tests, turn top creatives into paid assets, and measure incremental installs/retention.
7. How do you design price and offer tests that actually grow revenue?
Run randomized A/B or holdout tests on offers (bundles, first-time purchase, time-limited packs), compare net revenue per user and retention across matched cohorts, and only roll out changes that show statistically significant, persistent uplift. Use control groups to measure incremental ARPU and check payback windows against your LTV/CAC target.
