Best Facebook Ads Reporting Tools for Teams in 2026
Are you still reviewing Facebook ad performance across scattered dashboards, trying to piece together why some creatives work, and others don’t?
When you’re managing dozens of video ads, concepts, and variations, slow or unclear reporting hides early signs of creative fatigue and wasted spend. By the time performance reviews happen, the same weak hooks and messages have already run too long, and strong ideas haven’t been scaled fast enough. In 2026, relying on delayed reports is one of the fastest ways to stall creative impact.
If you’re a creative strategist or creative lead, this blog is for you. It covers the best Facebook ads reporting tools for marketers in 2026, so you can clearly see what’s working, back creative decisions with data, and confidently double down on ideas that actually move performance.
Why Reporting Tools are Essential When Running Facebook Ads
Facebook ads reporting tools are platforms that collect, organize, and visualize Meta ads data so you can clearly see how your creative ideas perform. Instead of looking only at surface-level campaign stats, these tools help you understand how different creatives, formats, hooks, and messages influence results across multiple ads and accounts.
For creative strategists, these tools turn scattered performance data into clear creative signals you can actually use. Rather than guessing which ideas worked or relying on subjective feedback, you get evidence of what resonates, what’s losing impact, and what needs to be refreshed or rebuilt next.
Here are the key reasons reporting tools are essential when you’re running Facebook ads at scale: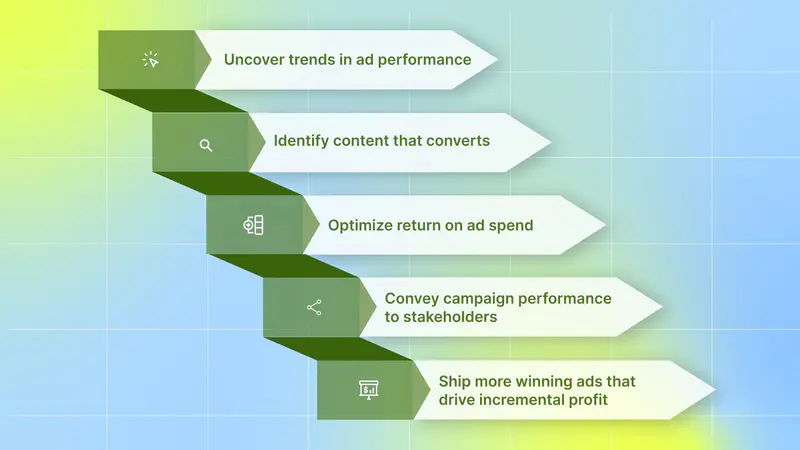
Uncover trends in ad performance: Spot patterns early, like which creatives improve IPM, which formats scale better, or when performance starts to dip before results drop across your campaigns
Identify content that converts: See which ad creatives, hooks, and messaging actually drive installs, purchases, or subscriptions, not just clicks or impressions.
Optimize return on ad spend (ROAS): Quickly move budget toward winning ads and pause underperformers, so your spend is always aligned with performance goals.
Convey campaign performance to stakeholders: Share clear, structured reports with leadership or clients that explain what changed, why it changed, and what actions you’re taking.
Ship more winning ads that drive incremental profit: Use performance insights to iterate with confidence, launch stronger variations, and continuously improve creative output without relying on gut feel.
For creative strategists at mobile game studios, DTC brands, subscription apps, and growth agencies, strong reporting isn’t just about numbers; it’s how you build better ads, prove creative value, and stay ahead in highly competitive Facebook ad environments.
Next, let’s understand why relying solely on Meta’s native tool isn't enough when you need deeper creative insights and scalable reporting.
Also Read: Best AI Ad Reporting Tools to Maximize ROI in 2025
Why Meta Ads Manager Falls Short at Scale
You might ask why not just use Meta’s native Ads Manager for reporting? You can, and for quick checks or day-to-day campaign setup, Ads Manager does its job. But once you’re running campaigns at scale across multiple creatives, audiences, and accounts, the limitations become clear.
Here’s where Ads Manager falls short for mobile games, DTC brands, subscription apps, and UA agencies:
Limited granularity of performance metrics: Ads Manager heavily emphasizes reach, impressions, and engagement. While useful, these metrics don’t tell you which creatives are actually driving installs, purchases, subscriptions, or long-term value. Post-iOS 14, Meta’s native attribution has also become less reliable, making it harder to connect ad performance to real business outcomes.
Reporting formats that don’t work for stakeholders: Most insights in Ads Manager live in dense tables and spreadsheets. As a UA manager or growth lead, you may understand them, but executives, clients, and creative teams often don’t. Communicating impact becomes harder when reports aren’t clear, visual, or decision-focused.
Poor usability for fast-moving teams: Ads Manager has a steep learning curve. Unlocking deeper insights requires time, experience, and constant manual setup. Even with recent UI improvements, it’s still not built for quick, repeatable reporting across teams or clients.
Simply put, Ads Manager is a solid in-platform tool, but it isn’t built for deep creative analysis or strategic decision-making. If you want to clearly understand which creative ideas are working and decide what to build next with confidence, you need an external Facebook ads reporting tool that goes beyond what Meta offers natively.
To overcome these limitations, you need a reporting tool with features designed for deeper creative analysis and smarter decision-making.
Features to Look for in Facebook Ads Reporting Tools
The best Facebook ads reporting tools help you understand how your creative ideas perform and what to build next without digging through spreadsheets or raw data. For creative strategists, the right features replace gut instinct with evidence.
Here are the key features to look for in a Facebook ads reporting tool:
1. Visually friendly reporting formats
Visual reporting is critical when you’re sharing performance with growth leaders, creative teams, or clients. Clear visuals make it easier to explain results and align faster on next actions, especially when campaigns move quickly.
What makes visual reports effective?
Creative assets shown alongside performance, not buried in spreadsheets.
Simplified charts and metrics that avoid information overload.
Tagging, labels, and color cues make patterns easy to spot.
2. Tracking for industry-standard KPIs
A strong reporting tool should support all the core metrics to evaluate performance and scale confidently. This helps you measure how your ads contribute to brand goals, identify winning ads, and iterate on non-performers. A few common KPIs to watch for are ROAS, CTR, CPC, CPM, and CPA.
3. Comparative campaign analysis and benchmarking
Comparative analysis helps you learn from past work instead of starting from scratch each time. By comparing campaigns, creatives, and formats, you can understand what changed, what worked, and what should guide your next concepts.
With proper comparisons, you can:
Spot creative performance trends early.
Identify which concepts and formats consistently deliver stronger results.
Replicate winning structures, messages, and styles in new launches.
For creative strategists, benchmarking turns historical performance into a creative playbook so every new idea is informed by what already works.
4. Insight into creative performance
Creatives are one of your biggest growth levers. A reporting tool should help you understand which creatives drive results and why.
Look for tools that help you:
Compare performance by creative angle or message.
Identify top-performing formats and concepts.
Decide what to iterate, refresh, or scale next.
But which platform actually shows you which creative performs and why?
This is where a creative intelligence platform like Segwise comes in. With its tag-level creative element mapping, you can see which specific creative elements drive performance. You can discover patterns like "this hook appears in 80% of top-performing creatives" with complete MMP attribution integration.
5. Near real-time data monitoring
Creative performance can change quickly. Near real-time monitoring helps you see early signals of fatigue or lift, so you can react before impact is lost.
With up-to-date dashboards, you can:
Catch creative fatigue early.
Reduce time spent pulling and cleaning reports.
Make faster, more confident creative decisions without waiting for weekly reviews.
For creative strategists at mobile game studios, DTC brands, subscription apps, and growth agencies, these features are essential for improving Facebook ad reporting.
Now that you know what features truly matter, let’s look at the platforms that actually deliver on those expectations.
Leading Reporting Tools for Facebook Ads
The best Facebook ads reporting tools help you see how your creative ideas perform, understand which concepts actually influence results, and make faster decisions about what to build next as campaigns scale. These platforms go beyond surface-level metrics to support creative reviews, cross-team alignment, and high-volume creative workflows across brands or clients.
Here are the leading platforms for Facebook ads reporting:
1. Segwise

Segwise is an AI-powered creative intelligence platform that helps mobile game studios, DTC brands, subscription apps, and performance marketing agencies optimize ad creative performance. It unifies creative data from 10+ ad networks and MMPs, automatically tags creative elements using multimodal AI, and turns performance data into actionable insights that improve creative ROAS.
You can build personalized dashboards tailored to your workflow and reporting needs. Segwise helps you build better creative strategies, reduce guesswork, and connect ad performance directly to business outcomes, such as ROAS.
Key Features
No code integration with Facebook Ads: With no-code integration, you can start analyzing creative performance without any engineering work. To set it up, go to the Segwise Dashboard → Settings → Ad Networks, click Connect under Meta Ads, sign in, and select your Ads account for full creative analysis.
AI-Powered Creative Tagging: Segwise automatically identifies and tags creative elements such as hook dialogs, characters, product shots, CTAs, text overlays, and audio components across images, videos, and playable ads. These multimodal tags are then mapped to performance metrics like ROAS, CTR, and conversion rates so you can see which elements actually drive results without manually tagging hundreds of creatives.
Custom Dashboards and Reporting: You can build dashboards around your specific KPIs and stakeholder needs. Create automated reports that show how creative decisions impact ROAS across all your apps and campaigns.
Tag-Level Creative element mapping: See which creative elements consistently drive ROAS across Facebook campaigns, backed by MMP-attributed data. You can discover patterns like "this hook appears in 80% of top-performing creatives."
Cross-Platform Performance Reports: Track your creatives across platforms in unified reports. Track performance for individual platforms or get consolidated cross-network insights. This helps you identify performance decline patterns across networks and spot early signs of creative fatigue before it impacts overall results.
How does it improve your creative performance?
Segwise helps you identify exactly which creative elements drive the highest ROAS, so you can focus on producing more winning creatives. With clear, tag-level performance insights, you can build data-backed creative briefs and iterate faster with confidence. Ultimately, this allows you to scale successful ideas, refresh creatives before fatigue, and continuously improve creative performance.
Limitation
If you want to know the pricing structure, you’ll need to request a demo, as the platform does not list public pricing on the website.
In short, Segwise goes beyond basic Facebook ad reporting by showing why creatives perform, not just how. Moreover, this is the only platform that tags playable ad elements and interactive components. For creative strategists, Segwise turns reporting into a clear competitive advantage.
2. Superads

Superads is an AI-powered ad analytics and reporting platform that helps marketers analyze campaign performance and uncover trends across channels. It enables you to create automated dashboards, track creative performance, and generate actionable insights to improve ad results.
Key Features
1. Automated Reports and Dashboards Across Channels: It lets you create reports and dashboards to track ad performance across Meta, Google, TikTok, and LinkedIn in one place. This helps you quickly identify high-performing creatives and understand what’s working.
2. Easy Sharing of Interactive Reports: It allows you to share automated, interactive dashboards with your team or clients without manual exports. This makes it easier to communicate creative performance and keep stakeholders aligned.
3. Granular Creative Performance Insights: It provides reporting on creative elements like copy, CTAs, and headlines across campaigns. This helps you compare performance and identify which creative elements drive the best results.
How does it improve your creative performance?
Superads helps you identify which creatives, copy, and messages perform best so you can focus on improving winning ideas. Its automated dashboards make it easier to review performance and guide creative iteration.
Limitation
However, Superads does not support tagging or analyzing playable ad elements, which limits visibility into how interactive components impact performance.
3. Madgicx

Madgicx is an AI ad management and reporting platform that helps marketers streamline advertising operations and maximize ad ROI and profit. It provides cross-channel reporting across Meta, Google Ads, Google Analytics, TikTok, and Shopify in one unified dashboard. The platform helps you monitor performance, uncover insights, and make data-driven decisions across all your ad accounts.
Key Features
Cross-Channel Reporting in One Dashboard: It provides cross-channel reporting for Meta, Google Ads, Google Analytics, TikTok, and Shopify in one place. This allows you to see the bigger picture and track performance across all accounts from a single dashboard.
Automated Real-Time Reporting: It automates reporting in real time, so you never have to create reports manually again. You always have access to up-to-date performance insights whenever you need them.
One Unified Report Across All Accounts: It gives you one report to view all your client or ad accounts together. This helps you focus on important metrics and make data-driven decisions faster.
How does it improve your creative performance?
Madgicx helps you monitor performance across all your ad accounts in one dashboard, so you can clearly see which campaigns are delivering stronger results. This allows you to make faster, data-driven adjustments based on overall campaign performance trends.
Limitation
Madgicx primarily focuses on account-level and cross-channel reporting, but it lacks deep creative-level analysis that connects specific creative elements to performance outcomes. This makes it harder to understand which exact hooks, visuals, or creative components are driving results and to build repeatable winning creative strategies.
4. MagicBrief

MagicBrief is a creative reporting and ad research platform built to help teams analyze ad performance, uncover competitor strategies, and generate better creative briefs. It centralizes performance data, competitor insights, and visual reporting into one workspace.
Key Features
Automatic Slack Reporting: It provides automated summaries of your performance and competitor activity directly in Slack. This keeps your team updated without manual reporting.
AI-Powered Recommendations: With an always-on performance radar, MagicBrief gives AI-powered recommendations on what to create next. It helps you identify iteration opportunities based on benchmarking and performance data.
Visual Creative Reports & Competitor Intelligence: MagicBrief unites media buyers and creative teams with visual reports everyone understands. You can track any brand to access AI competitor summaries to stay ahead.
How does it improve your creative performance?
MagicBrief helps you identify winning ad traits, hooks, and formats so you can refine your creative direction faster. By analyzing competitor activity and performance trends, you reduce guesswork and avoid repeating failed experiments.
Limitation
However, MagicBrief focuses heavily on competitor research and visual reporting but does not integrate directly with MMPs. This limits your ability to fetch deep attribution data.
5. Foreplay

Foreplay platform helps you analyze, organize, and share ad performance across Meta and other platforms. It enables you to build customizable, white-labeled reports and track creative performance by segment, metric, and campaign.
Key Features
Automated Creative Reporting: It allows you to quickly create and share creative reports for any segment or metric. This helps you analyze performance and communicate results clearly with your team or clients.
Customizable, White-Labeled Visual Reports: You can create fully customizable, white-labeled reports and generate external links to share performance. This makes reporting more professional and keeps everyone aligned on creative performance.
Contextual Ad Reports with Enriched Data: Foreplay enables you to build and share reports with enriched data that provide context beyond standard metrics. This helps creative and performance teams understand the story behind performance and make better decisions.
How does it improve your creative performance?
With Foreplay, you can share insights with your team faster. This helps you make more informed creative decisions and improve overall campaign performance.
Limitation
However, Foreplay does not support custom success criteria to automatically identify when a creative is fatiguing. This makes it harder to proactively refresh creatives and protect ad performance.
6. Singular (Creative IQ)

Singular (Creative IQ) is a platform that analyzes the performance of its ad creatives across campaigns and channels. It enables you to view creative assets alongside performance metrics, use AI-powered tagging to organize creatives, and build customized reports.
Key Features
Visual reporting: You can see your ad assets, like videos and images, side-by-side with their performance metrics.
AI-powered tagging: Automatically categorize and identify all your creative assets with AI-powered tagging.
Creative Explore (Complete Creative Reporting): Creative Explore provides complete creative reporting so you can optimize smarter and faster for true ROI on all your creative assets. It enables you to analyze creatives with advanced reporting capabilities and understand performance at a deeper level.
How does it improve your creative performance?
With AI-powered tagging and customizable reporting, you can analyze creative impact more effectively and optimize campaigns based on data instead of guesswork. This enables faster decision-making and improves overall creative effectiveness.
Limitation
However, the platform does not provide advanced, automated tagging specifically designed for playable ads, making it harder to analyze performance at the interactive element level. This limits your ability to identify which playable components drive engagement.
With so many reporting tools available, selecting the right one can make the difference between guessing what works and knowing exactly what to scale.
How to choose the right platform?
Choosing a reporting platform is not just about features. The right tool should align with your creative volume, team structure, and the depth to which you want to connect creative decisions to performance.
Here are the key questions you should ask before choosing:
Depth of creative insights, not just dashboards: Some platforms only show performance metrics, while others help you understand which creative elements drive results. Choose a platform that helps you clearly identify what to replicate and what to change.
Ability to scale with your creative volume: If you manage dozens or hundreds of creatives, manual analysis becomes impossible. The right platform should help you analyze large creative volumes efficiently without slowing your workflow.
How easily you can turn insights into creative decisions: The platform should make it easy to review performance and translate insights into clear creative direction. This helps you build better briefs and iterate faster.
Support for different creative formats: If you use video, image, and playable creatives, the platform should support reporting across all formats. This ensures you get a complete view of your creative performance.
Ease of use for creative teams: Creative teams should be able to access insights easily without relying heavily on media buyers or analysts. The platform should simplify performance review and decision-making.
Choosing the right platform helps you reduce guesswork, scale winning ideas faster, and build a more consistent and effective creative strategy.
Also Read: Segwise vs Foreplay: Which One Is Right for You?
Conclusion
Choosing the best Facebook ads reporting tool in 2026 is no longer just about tracking metrics; it’s about understanding which creative ideas actually drive performance. As creative volume increases, relying on basic dashboards or delayed reports makes it harder to identify winning concepts and detect creative fatigue early. The right reporting platform helps you connect creative decisions directly to outcomes, uncover repeatable winning patterns, and iterate faster with confidence.
So, which tool is best if you want to move beyond surface-level reporting and truly understand what makes your creatives perform?
Segwise stands out by providing creative-level intelligence. It integrates directly with your Facebook Ads account without any technical code. It's AI-powered tagging, tag-level creative element mapping, and unify creative data from 10+ ad networks and MMPs to help you see exactly which hooks, visuals, and concepts drive ROAS. It connects creative elements (hooks, visuals, formats, etc.) directly to business outcomes (ROAS, CPA/CPI, LTV, IPM, conversion rates), so teams stop guessing what works and start scaling creatives with data-backed confidence.
With its custom dashboards and reporting, you can build dashboards around your specific KPIs and stakeholder needs. You can also create automated reports that show how creative decisions impact ROAS across all your apps and campaigns. This allows you to build stronger creative strategies, scale winning ideas faster, and make every creative decision based on performance data.
So, if you want to turn your creative reporting into a true competitive advantage, start your free trial today and see exactly which creative elements drive your performance!