Top 7 Ad Reporting and Creative Analytics Platforms for Performance Marketers (2026)
The best ad reporting and creative analytics platforms in 2026 are Segwise, Funnel.io, and Supermetrics: Segwise for AI-powered creative intelligence and element-level analysis, Funnel.io for large-scale marketing data aggregation, and Supermetrics for flexible spreadsheet and BI reporting. This guide compares seven leading platforms across features, pricing, and ratings so you can pick the right fit for your team.
Updated July 2026.
The modern performance marketer lives in a state of data overload. You're running campaigns across Meta, TikTok, Google, and a dozen other networks, while tracking post-install events in a Mobile Measurement Partner (MMP) like AppsFlyer or Singular. The critical problem isn't a lack of data, it's the difficulty of consolidating that data and transforming it into creative strategy.
Standard ad reporting tools excel at pulling raw campaign spend and impressions. However, they stop short of providing the creative intelligence you need: the element-level analysis that tells you exactly which hook, character, or audio component drove the best ROAS.
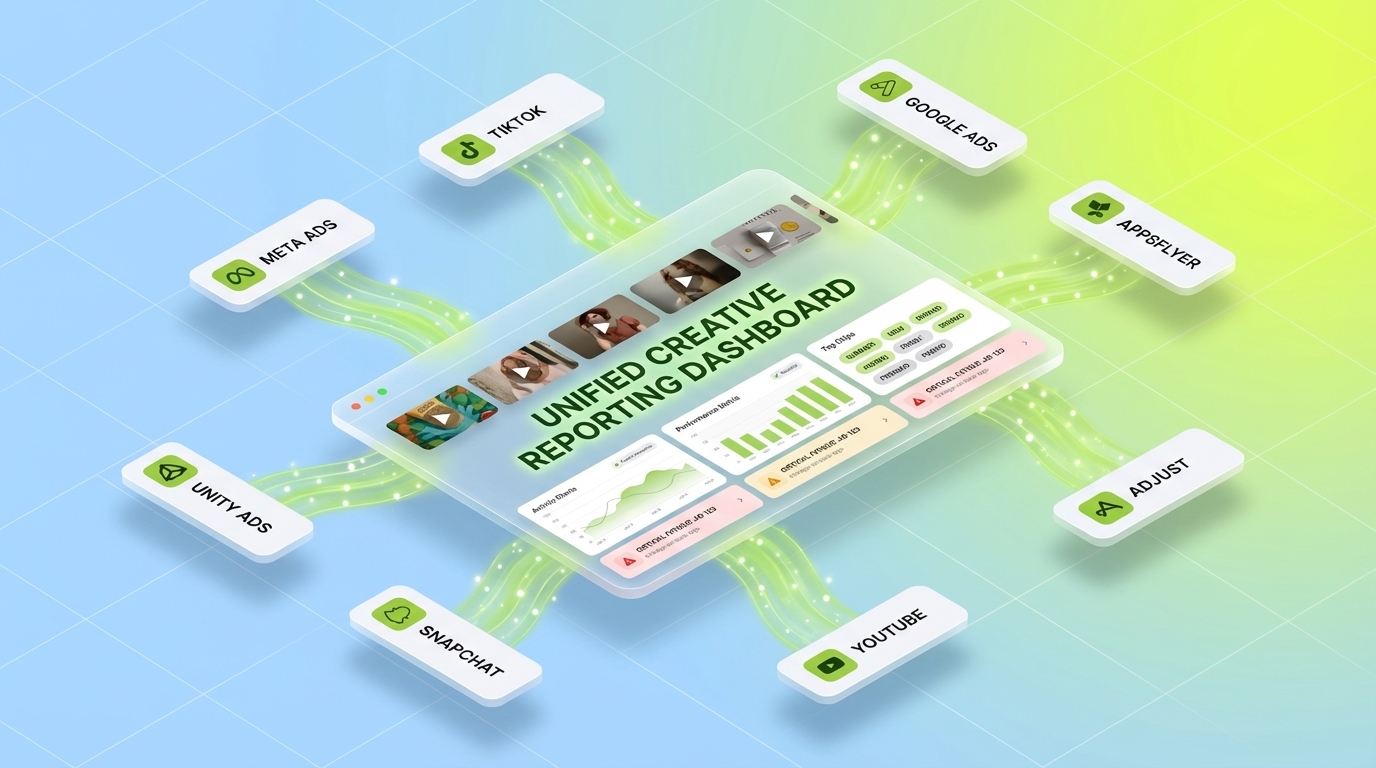
The highest-scaling teams, mobile game studios, fast-growing subscription apps, and leading agencies, are moving past simple data connectors. They are adopting a unified Creative Analytics Stack that connects campaign-level data to asset-level performance and provides actionable iteration guidance.
This comprehensive guide focuses on the best ad reporting platforms, from pure data aggregation tools to advanced AI-powered creative intelligence solutions, to help you streamline reporting and make faster, data-driven creative decisions.
Quick Comparison: 7 Ad Reporting and Creative Analytics Platforms
Pricing reflects publicly listed starting tiers as of July 2026 and can change; MMP and enterprise platforms quote custom pricing based on data volume and ad spend. Ratings are from G2.
Key Takeaways
Creative Intelligence vs. Aggregation: Tools fall into two main categories. Data aggregation tools (like Supermetrics and Funnel) pull raw data for you to analyze, while dedicated Creative Intelligence platforms (like Segwise) apply AI to automatically analyze and tag the creative elements for prescriptive insights.
The Problem with Raw Data: Simply unifying data doesn't solve the core creative challenge. Manual tagging and spreadsheet analysis create a bottleneck that leads to slower iteration, poor cross-platform learning, and delayed fatigue detection.
AI is the New ETL: Automated, multimodal AI tagging is now the most critical feature in a creative reporting platform. It creates a structured dataset, mapping specific creative components to down-funnel KPIs (ROAS, LTV) without the need for manual, spreadsheet-based effort.
Unified Attribution is Non-Negotiable: The best platforms must integrate with both ad networks and all major MMPs (AppsFlyer, Adjust, Branch, and Singular) to ensure every creative performance metric is based on accurate, attributed data.
Speed is ROAS: Look for platforms that accelerate your workflow. Features like automated fatigue alerts, pre-built dashboards, and AI-powered recommendations remove the manual data wrangling that slows teams down, freeing up hours each week and helping you act on ROAS signals before budget is wasted.

Also see How to Improve ROAS: Top Strategies to Maximize Returns
What Separates Ad Reporting from Creative Intelligence?
For a modern performance team, "ad reporting" has evolved.
Top 7 Ad Reporting and Creative Analytics Platforms
Here are the top tools performance marketing teams rely on to get a unified view of their data, simplify creative reporting, and make high-impact decisions.
1. Segwise: AI-Powered Creative Intelligence
Best for: UA managers and creative strategists who need AI to tag creative elements, catch fatigue early, and turn winning patterns into new creatives.
Segwise is the leading AI-powered creative intelligence platform built from the ground up to solve the creative iteration problem for mobile game studios, DTC brands, subscription apps, and high-velocity performance marketing agencies. It moves beyond data reporting by prioritizing element-level analysis that maps directly to key business outcomes.
Key Features
AI-Powered Creative Tagging (Core Differentiator): Segwise uses advanced multimodal AI analysis that goes deeper than traditional tools. It analyzes video elements (scene changes, visual styles), audio elements (transcribes spoken dialogue, voiceover, background music type), and image/text elements to automatically apply tags. Crucially, it is the only platform that tags playable (interactive) ads, a vital capability for mobile game studios.
Unified Creative Analytics Dashboard: The platform provides a single source of truth by unifying creative data from 15+ ad networks including Meta, Google, TikTok, Snapchat, YouTube, AppLovin, Unity Ads, Mintegral, and IronSource; and integrating all major MMPs (AppsFlyer, Adjust, Branch, and Singular). This ensures insights are based on accurately attributed performance data.
Native Fatigue Detection: Segwise monitors performance decline and custom success criteria across every connected platform at once, acting as an early warning system. Catching burnout before spend is wasted is where teams see meaningful ROAS gains (Segwise reports improvements of up to 50%).
AI-Powered Creative Generation: Segwise generates net-new creatives and variations grounded in your winning tag-to-metric patterns, across static, video, and playable formats, plus video storyboards. Because the recommendations point to proven hooks and visual styles rather than guesses, teams cut the time spent on briefs and iteration cycles significantly.
Competitor Creative Tracking: Gain a competitive edge by tracking and analyzing your competitors' ads (currently Meta Supported). The platform's AI tagging applies to competitor ads, allowing you to identify emerging market trends, white space opportunities, and messaging patterns instantly.
When You Should Try Segwise
Try Segwise if your primary challenge is making data-driven creative decisions at scale. It's ideal if you manage hundreds of creative assets across multiple platforms and need to eliminate manual tagging, reduce wasted ad spend from creative fatigue, and accelerate your testing velocity. By automating the tagging and reporting work that normally eats into a strategist's week, Segwise gives that time back to actual creative iteration.
Pricing
Custom pricing, scaled to your ad spend and number of brands or apps. Segwise offers a 7-day free trial (no credit card required), and up to 14 days of historical data are imported automatically during the trial (up to 3 months for paid customers), so you can see attributed creative insights before you commit.
Limitations
Segwise is built for high-volume advertisers. Smaller businesses with low monthly ad spend or those running only a single ad network might find the full suite of multimodal AI and cross-platform capabilities to be more than they need today.
2. Funnel.io: Robust Marketing Data Aggregation
Best for: Data teams with complex, multi-channel stacks that need clean, standardized data feeding a BI tool or warehouse.
Funnel.io is a powerful marketing data aggregation platform that specializes in collecting, cleaning, and centralizing data from over 500 advertising, analytics, and e-commerce platforms[1]. It focuses on providing a single, standardized data set ready for use in BI tools or internal data warehouses.
Key Features
Extensive Integrations: Funnel supports a massive range of sources, including major ad platforms (Meta Ads, Google Ads, Amazon), CRMs, and e-commerce platforms. This makes it a highly flexible option for complex data stacks[1].
Data Transformation and Custom Metrics: The platform allows users to define customizable data models and create specific custom metrics that align with unique business requirements, ensuring the data is ready for analysis and reporting[2].
Standardized Data Output: Funnel normalizes data nomenclature across platforms, solving the common problem of mismatched fields and metrics, and delivering a "single source of truth" to measure performance[1].
BI Tool Ready: Its primary function is to feed clean, standardized data into a team's preferred visualization tools like Tableau, Looker Studio, or Power BI, rather than hosting its own dedicated creative intelligence environment.
When You Should Try Funnel.io
Funnel is a strong choice if your team has a complex, multi-channel setup (50+ data sources) and you need a robust, reliable system to clean and aggregate raw data before it reaches your BI tool. It's best for teams with internal data analysts who require a standardized, highly customizable data model for advanced reporting.
Pricing
Paid plans start around $200/mo for the Starter tier, with Business plans running into the high hundreds to low thousands per month depending on flexpoint (data capacity) usage. There is no free plan; enterprise pricing is quoted on request. Costs can climb as you add sources, accounts, or granularity, so model your usage before committing.
Rating
4.5/5 on G2 (about 165 reviews).
Limitations
While excellent for data management, Funnel is primarily an ETL (Extract, Transform, Load) solution, not a creative intelligence platform. It lacks the built-in, multimodal, element-level AI-powered creative tagging and fatigue detection that dedicated creative analytics tools offer. Teams still need to build their own reporting dashboards and analytical frameworks on top of the Funnel data.
3. Supermetrics: The Spreadsheet Reporting Standard
Best for: Lean marketing teams and agencies that live in spreadsheets or a BI tool and want data pulled in automatically.
Supermetrics is often the starting point for teams looking to move beyond manual copy-pasting into spreadsheets. It is a flexible data connector that excels at pulling unified marketing and creative data directly into spreadsheets (Google Sheets, Excel) or various Business Intelligence (BI) tools.
Key Features
Versatile Destination Connectors: The platform connects various data sources to multiple destinations, including Looker Studio, Power BI, Google Sheets, and data warehouses, offering flexibility depending on the team's existing stack[3].
Ease of Use: Supermetrics is known for its straightforward, flexible interface and easy setup, making it accessible for marketers who are not data engineers[3].
Transparent Pricing Model: It offers flexible pricing, often based on the number of data sources and users, which appeals to teams scaling up their reporting capabilities[3].
Flexibility for Custom Reporting: By pulling data directly into spreadsheets or BI tools, it provides full control over how the data is transformed, blended, and visualized, catering to users who prefer a high degree of customization.
When You Should Try Supermetrics
Supermetrics is ideal for lean marketing teams, agencies, or SMBs whose reporting needs are met by leveraging their existing skills in Google Sheets or Excel, or who prefer to use their own BI tool (like Looker Studio) for visualization. It solves the data consolidation problem quickly and affordably.
Pricing
Plans start at about $39/mo for the Starter tier (annual billing) and scale to roughly $399/mo for Pro, with custom Enterprise pricing. A 14-day free trial is available. Additional destinations, users, and data sources are paid add-ons, so costs grow as your setup expands.
Rating
4.4/5 on G2 (about 820 reviews).
Limitations
Supermetrics is a connector, not an intelligence platform. It does not offer AI-powered creative tagging, automatic cross-platform creative asset matching, or proactive features like fatigue detection. The creative team still needs to manually tag and analyze creatives once the data is in the spreadsheet or BI tool.
4. AppsFlyer (Creative Optimization): MMP-Driven Insights
Best for: Mobile teams already using AppsFlyer for attribution who want creative reporting tied to post-install metrics.
AppsFlyer, a leading Mobile Measurement Partner (MMP), includes its Creative Optimization feature as part of its full-suite offering. Its strength lies in combining creative performance with the highly accurate, post-install attribution data it collects as an MMP.
Key Features
Attribution-Creative Link: The core value is the ability to link creative performance directly to accurate, post-install metrics like LTV, retention, and custom in-app events, as it leverages its position as the attribution authority.
AI Tagging for Optimization: It provides automated creative tagging and allows for custom dimensions, helping teams break down creative assets by elements (like scenes or formats) for deeper performance analysis.
Asset Duplication Detection: AppsFlyer's technology can automatically identify creative assets that are identical, even if they have different file names across ad networks. This is a crucial reporting feature for ensuring accuracy in cross-platform comparisons.
Data Export (ETL): For enterprise customers, the Creative Optimization ETL (Extract, Transform, Load) allows exporting creative-level performance data into internal data warehouses for advanced modeling.
When You Should Try AppsFlyer Creative Optimization
This feature is best suited for existing AppsFlyer customers, especially mobile game or subscription apps, who need to ensure their creative performance reporting is directly linked to the most accurate mobile attribution data possible. It is a powerful, integrated solution for those prioritizing LTV and retention-based creative decisions.
Pricing
Custom / contact sales. Creative Optimization is part of AppsFlyer's broader MMP suite, so pricing depends on your attribution volume and the modules you enable; AppsFlyer does not publish standard rates for this feature.
Rating
4.5/5 on G2 (about 713 reviews) for the AppsFlyer platform.
Limitations
This is an add-on feature to the core AppsFlyer MMP platform and is primarily for mobile apps. Non-mobile advertisers or those not already using AppsFlyer for attribution will not realize the full benefits of this integration. The creative analysis features, while powerful for asset clustering, lack the depth of multimodal, element-level AI tagging for video and audio content found in dedicated, AI-first creative intelligence platforms.
5. Singular (Creative IQ): Full-Stack Attribution & Creative Reporting
Best for: Enterprise mobile advertisers that want creative reporting built on attribution-first, fraud-protected data.
Singular is another industry-leading Mobile Measurement Partner (MMP) that offers a robust Creative Analytics feature set called Creative IQ. Similar to AppsFlyer, its advantage is combining its core attribution data with creative reporting across the entire marketing funnel.
Key Features
Creative IQ Platform: This feature provides unified creative performance reporting across dozens of ad networks and enables the identification of similar or identical creative assets.
Attribution-First Measurement: By being attribution-centric, Singular ensures that all creative performance metrics (CPI, ROAS, LTV) are based on their validated, fraud-protected attribution data, giving confidence in the numbers.
Extensive Data Source Coverage: Singular supports a wide array of data sources, beyond just ad networks, including various BI tools and internal systems.
Granular Performance Breakdown: The platform supports granular breakdown of creative performance, helping UA teams segment data by campaign, ad set, creative version, and other custom parameters for in-depth analysis.
When You Should Try Singular
Singular is an excellent fit for enterprise-level mobile advertisers (subscription apps, mobile games) who need to measure overall ROI across complex, high-scale campaign environments. Choose Singular if you need a comprehensive, attribution-first platform that includes a strong, integrated solution for creative performance measurement.
Pricing
Custom / contact sales. Creative IQ sits inside Singular's attribution and analytics platform; pricing is quoted per deployment based on data volume and scale, with a premium enterprise price point.
Rating
4.5/5 on G2 (about 451 reviews) for the Singular platform.
Limitations
Like AppsFlyer, Singular's primary focus is full-stack attribution and marketing analytics. The Creative IQ features, while strong, are part of a broader, more complex platform. Similar to other MMP-centric solutions, while Creative IQ excels at connecting attributed data to assets, its focus is not on deep multimodal, element-level analysis of video, audio, and playable content like dedicated creative intelligence platforms. Teams without dedicated data resources might find the platform has a higher learning curve and a premium price point.
6. Improvado: Enterprise Marketing Intelligence
Best for: Mid-market and enterprise teams or large agencies that need an end-to-end data pipeline across many sources.
Improvado is positioned as a complete marketing analytics platform, not just a data connector, designed for mid-sized to enterprise businesses and agencies requiring a scalable, reliable source of truth for their marketing performance[4]. It excels at automating the full data pipeline and offering features that simplify data analysis.
Key Features
ETL and Analytics Combined: Improvado includes a robust ETL engine to automate the entire data pipeline and provides built-in analytics features to simplify further data analysis and transformation[4].
Extensive Data Source Coverage: It connects to over 500 marketing and sales platforms, allowing for a massive consolidation of data from niche platforms, CRMs, and ad networks[5].
AI-Powered Data Insights: The platform offers general AI-powered insights for data transformation and trend detection, which is distinct from the multimodal, element-level AI tagging needed for prescriptive creative strategy guidance.
Granular Control and Customization: Improvado offers granular control over how data is shaped and transformed, allowing teams to create automated pipelines and apply custom logic before the data reaches a BI tool.
When You Should Try Improvado
Choose Improvado if you are an enterprise business or a large agency with a high number of data sources (500+) and a need for a complete, end-to-end marketing data platform. It is a powerful solution for teams that require advanced transformation, data governance, and scalable, reliable data centralization.
Pricing
Custom / contact sales. Improvado does not publish rates; quotes are built from your data sources, data volume, transformation complexity, and destinations, typically after a scoping call. Advanced features are often credit-based add-ons.
Rating
4.5/5 on G2 (about 80 reviews).
Limitations
As a full-stack marketing intelligence platform, Improvado can represent a significant investment and may require a higher level of internal data expertise to utilize its full data transformation capabilities effectively.
7. Whatagraph: Agency-Friendly Reporting and Visualization
Best for: Agencies and in-house teams that value fast, polished, client-ready reports over deep creative analysis.
Whatagraph is a user-friendly, centralized reporting platform with a strong focus on data visualization and agency-client reporting. It is designed to quickly aggregate data and generate customizable, beautiful reports that are easy to share with both internal stakeholders and external clients[1].
Key Features
Strong Visualization: Whatagraph's core strength is its easy-to-use interface and strong visualization capabilities. It is built to create clear, visually impactful dashboards without needing deep BI tool experience[1].
Automated and Customizable Reports: The platform allows for automated report generation and delivery, saving agency teams significant time on recurring monthly and weekly reporting.
Centralized Data: It connects to over 50 data sources, offering robust data aggregation across various marketing platforms and channels, including advertising, analytics, and social media[1].
White-Labeling: Its agency focus means it provides white-labeling features, making it a professional and seamless reporting solution for client presentations.
When You Should Try Whatagraph
Whatagraph is an excellent choice for marketing and media buying agencies, or in-house teams that prioritize ease of use, strong visualization, and simple client-facing reports. If your goal is to reduce the time spent building reports in spreadsheets and generate professional, scannable dashboards quickly, this is a strong fit.
Pricing
Plans start around $229/mo for the Start tier (billed annually), with the Boost tier roughly $463/mo and a custom top tier. Paid plans require annual billing (month-to-month costs more), and higher tiers add source credits.
Rating
4.5/5 on G2 (about 277 reviews).
Limitations
While user-friendly, Whatagraph is primarily a data visualization tool built on top of data connectors. It generally lacks the advanced AI-powered creative element tagging, deep attribution-based analysis, and proactive fatigue detection found in true creative intelligence platforms.
How to Choose the Right Platform: Decision Framework
Creative Analytics Demo Checklist
Before committing to a platform, run this quick check during your demo to ensure the tool provides true creative intelligence:
Tag-to-metric Mapping: Ask the vendor to show you a report mapping a specific creative element (e.g., "fast-paced video") to an attributed, down-funnel metric (e.g., 7-day ROAS).
Asset Clustering: Show a set of 10 creatives with different file names and ask the platform to identify which assets are identical or share a high percentage of visual components.
Fatigue Alert: Request to see the interface for a pre-configured creative fatigue alert. How early can the system detect a 10% drop in CVR?
MMP Data Flow: Confirm the platform integrates with your specific MMP (AppsFlyer, Adjust, Branch, or Singular) and that the performance data you see is the final, attributed metric, not just the raw ad network API data.
Iteration Guidance: Ask what the tool tells you to build next. Does it just show you the winning ad, or does it recommend a winning element (hook, CTA, style) to apply to a new concept?
Conclusion: The Shift to Prescriptive Creative Insights
The market for ad reporting has clearly segmented. You must decide if you need a data aggregation tool (to collect the data) or a creative intelligence platform (to analyze the data and tell you what to do next).
While data connectors like Funnel and Supermetrics excel at getting raw data into one place, they leave the most difficult, and highest-value work of creative analysis to your team and your spreadsheets. This reliance on manual work creates a bottleneck in the one area that defines modern UA success: creative velocity.
For mobile game studios, DTC brands, and agencies that need to accelerate their creative testing cycles, investing in a platform that provides element-level, AI-driven insights is the only way to sustain aggressive growth targets. By leveraging AI to automatically tag, analyze, and detect creative fatigue, you move from descriptive reporting to prescriptive creative strategy.
Ready to see how fast AI can translate creative performance data into production-ready assets? Book a demo with Segwise to explore its multimodal AI analysis and unified dashboard. See firsthand how element-level insights can give your team back up to 20 hours a week and accelerate your time-to-scale.
Frequently Asked Questions
Do I need a creative analytics tool if I already use Funnel.io or Supermetrics?
Yes, because Funnel.io and Supermetrics are primarily data connectors/aggregators. They solve the problem of getting the raw data. They do not solve the problem of analyzing the creative content. You still need a tool or a manual process to tag the creative elements (hook, format, offer) within the data and map them to performance. A tool like Segwise automates this entire creative analysis process.
Why is it important for a creative reporting tool to integrate with all four major MMPs?
It is critical because ad network data (e.g., Meta/Google ROAS) is often based on modeled or estimated conversion events. MMPs (AppsFlyer, Adjust, Branch, Singular) provide the final, attributed LTV and ROAS figures. For a creative reporting platform to provide truly accurate insights, it must unify its creative data with the precise, validated attribution data from the MMP.
How does AI-powered creative tagging save time?
AI-powered creative tagging saves time by eliminating the need for a UA manager or creative strategist to manually categorize every ad with tags like "UGC style," "Fast-paced video," "On-screen text," or "Character X." Platforms with multimodal AI, such as Segwise, automatically apply these tags by analyzing the video, audio, and text, creating a structured, searchable dataset in minutes instead of days.
Which type of platform is best for an agency managing 20+ clients?
Agencies should prioritize platforms with strong multi-client management features, easy report sharing, and flexible data handling. Data aggregators like Funnel.io or specialized visualization tools like Whatagraph are good for client reporting. However, for a competitive edge and better creative strategy, an agency needs a platform with element-level analysis like Segwise to scale winning concepts across all client accounts.
Is it possible to track playable ad performance with these tools?
Most ad reporting platforms cannot track the interactive elements within a playable ad unit. Segwise is currently the only platform that uses its multimodal AI to tag playable (interactive) ads, allowing mobile game studios to analyze which specific gameplay mechanics or interactive moments drive the highest install and retention rates.
What is the biggest risk of relying solely on native ad network reporting?
The biggest risk is siloed data and inaccurate creative comparisons. Native platforms like Meta and Google only show their own data. They don't provide a unified, cross-platform view, nor do they easily integrate MMP attribution data. This forces creative teams to make decisions based on incomplete, siloed, and often un-attributed data, which leads to poor resource allocation.
How much do ad reporting and creative analytics tools cost?
Pricing spans a wide range. Data connectors are the most affordable entry point: Supermetrics starts around $39/mo and Whatagraph around $229/mo (annual billing), while Funnel.io starts near $200/mo and scales with data capacity. Enterprise data platforms (Improvado) and MMP-based creative reporting (AppsFlyer Creative Optimization, Singular Creative IQ) use custom pricing quoted on your data volume and ad spend. Dedicated creative intelligence platforms like Segwise also price custom, scaled to ad spend and brand count, and offer a 7-day free trial so you can validate the fit first. Always confirm current pricing with the vendor, since tiers and add-ons change.
Why do many creative analytics tools require custom enterprise pricing?
Dedicated creative intelligence platforms offer custom pricing because their cost is highly dependent on the volume of data (daily ad spend), the number of creative assets that need AI tagging, and the depth of historical data that needs to be imported. Their value is directly tied to the complexity and scale of the advertiser's operation, necessitating a customized tier structure.
