From Data to Decisions: Analyzing Ad Creative Performance
Are you jumping between ad platforms, spreadsheets, and reports, trying to explain why one creative worked and another failed?
You’re tracking CTR, CPA, and ROAS every day, yet creative decisions still feel risky. A few wrong calls can burn weeks of spend, slow down user acquisition, and make it harder to justify results to your team or clients. And by the time performance drops show up in your reports, the damage is often already done.
If you’re running user acquisition for mobile games, DTC video ads, subscription apps, or managing multiple client accounts, this blog is for you. It breaks down how to analyze ad creative performance in a way that actually leads to clear decisions, so your creative strategy drives growth instead of guesswork.
What is Ad Creative Performance?
Ad creative performance is how well your ad creatives work in practice. It measures whether your ad’s visuals and messaging actually make people stop scrolling and take action, such as clicking, installing, purchasing, or signing up.
In simple terms, it tells you which creatives help you grow and which ones quietly waste budget. To evaluate this clearly, creative performance depends on a few core pillars.
The Four Core Pillars of Ad Creative Performance
The four pillars explain what makes an ad capture attention, stay memorable, reach the right users, and improve over time.
Here are the core pillars: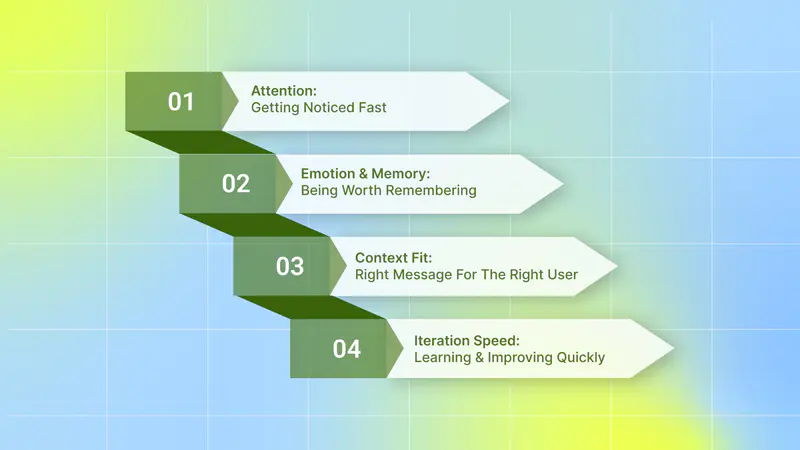
Attention: Getting noticed fast: If your ad doesn’t stop the scroll, nothing else matters. Attention is about whether users notice your ad in the first few seconds and whether they stay long enough to understand the message. Weak hooks lead to skipped ads, low engagement, and wasted spend.
Emotion and memory: Being worth remembering: High-performing creatives don’t just get views, they trigger a reaction. When users connect with your message or recognize the problem you’re solving, they’re more likely to install, subscribe, or buy later instead of dropping off after the first touch.
Context fit: Right message for the right user: Creative performance depends heavily on where and who you’re showing the ad to. What works on TikTok may fail on Meta. What converts new users may not work for retargeting. Strong creatives match the platform, placement, and audience intent.
Iteration speed: Learning and improving quickly: Creative performance isn’t fixed. The UA or performance marketing teams win by testing often, spotting patterns early, and iterating fast. The faster you learn what works and refresh what doesn’t, the more consistently your campaigns scale without burning budget.
To unlock the full value of creative performance, you need to understand why analyzing it truly matters.
Also Read: Enhancing Creative Campaigns with AI: Top Strategies for Performance Marketing
Why Analyzing Ad Creative Performance Matters
Analyzing ad creative performance matters because it helps you understand what actually drives user acquisition results, not just what looks good or feels right. Without this clarity, scaling campaigns becomes risky and unpredictable.
Here are the key reasons why analyzing ad creative performance is essential for UA teams:
To improve ROAS and overall ROI: Creative plays a major role in how efficiently your ad spend turns into installs, purchases, or subscriptions. By analyzing creative performance, you can see which visuals, hooks, or messages drive better results and double down on them.
To understand what actually resonates with your audience:Creative analytics helps you see how different users respond to different messages and formats. This removes guesswork and makes it easier to launch creatives that match user intent.
To make faster, more confident decisions: When you analyze creative performance continuously, you don’t have to wait weeks to act. You know early what to scale, what to fix, and what to pause.
To stop wasting budget on underperforming creatives: Not every creative deserves more spend. Creative-level analysis helps you cut inefficient creatives before they drain budget and reallocate spend to what’s working.
To build a repeatable creative strategy: Instead of relying on gut feel, creative performance data helps you build a system for testing, learning, and improving. Over time, this leads to more predictable user acquisition growth.
Once you understand why creative performance matters, the next step is to learn methods for analyzing your creative performance.
Common Methods to Analyze Creative Performance
There are several ways to analyze creative performance, each offering a different level of insight. Some methods help you validate small changes, while others give directional signals about what might be working.
Here are the most common methods UA teams use today:
1. A/B Testing (Split Testing)
A/B testing compares two versions of an ad that differ by only one creative element, such as the image, headline, or call to action. The goal is to see which version performs better with your audience.
How to use it effectively
Choose one creative element to test (for example, image A vs image B).
Keep everything else the same.
Run both versions at the same time to similar audience segments.
Compare performance using metrics like CTR, conversions, or ROAS.
Why it matters for UA teams
A/B testing helps you reduce risk when making small creative changes, so you can improve performance without disrupting campaigns that are already working.
For example, a DTC skincare brand ran two static ads with the same copy and targeting. One ad showed the product on a plain background, while the other showed a real person using it. The ad with the lifestyle image drove more purchases, helping the UA team confidently scale that creative direction.
2. Multivariate Testing
Multivariate testing evaluates multiple creative elements at the same time, such as headlines, visuals, and CTAs, to find the best-performing combination.
How to use it effectively
Select several creative elements you want to test.
Create multiple combinations of those elements.
Run them across your audience and compare overall performance.
Why it matters for UA teams
Multivariate testing helps UA teams evaluate entire creative concepts before scaling. It’s useful when launching new angles or formats, and you need confidence that the full creative direction works, not just one element.
For example, a subscription fitness app tested multiple combinations of headlines, visuals, and CTAs in one campaign. One specific combination consistently drove higher installs and better conversion rates. Based on this result, the UA team scaled similar creative patterns across new campaigns and saw more stable acquisition performance.
3. Click-Through Rate (CTR) Analysis
CTR analysis looks at how often users click on your ad after seeing it. It’s often used as a quick signal of whether a creative grabs attention.
How to use it effectively
Track CTR across creatives, platforms, and placements.
Compare high-CTR ads to identify common creative patterns.
Use CTR as an early indicator, not a final decision point.
Why it matters for UA teams
CTR helps UA teams quickly identify which creatives fail to stop the scroll. This allows you to eliminate weak ads early and focus spend on creatives that at least earn user attention.
For example, a mobile game noticed that one creative had a much higher CTR than others. After reviewing the ad, the team realized the creative showed exciting gameplay moments that encouraged clicks.
4. Engagement Analysis
Engagement analysis looks at how users interact with your ads through likes, comments, shares, video views, or watch time.
How to use it effectively
Video views and drop-off points to understand where users lose interest and which moments fail to hold attention.
Likes, comments, and shares to know how strongly your creative resonates or sparks a reaction.
Interaction rates across different creatives to compare which ads encourage users to engage more actively.
Why it matters for UA teams
Engagement analysis helps you understand early user interest before conversion data is available. It’s especially useful during creative testing phases when installs or purchases haven’t stabilized yet.
For example, a DTC apparel brand saw one static ad receive significantly more likes and comments than others. This helped the team understand that the creative sparked interest.
5. Sentiment Analysis (Understanding Emotional Response)
Sentiment analysis looks at how users feel about your ads, not just how they interact with them. It helps you understand whether your creative triggers positive, neutral, or negative reactions, which can strongly influence user acquisition outcomes.
How to use it effectively
Review comments, replies, and messages on your ads to spot common reactions or objections.
Look for repeated words or themes that signal frustration, excitement, or confusion.
Track sentiment changes when you test new creative angles, messaging, or formats.
Why it matters for UA teams:
Negative sentiment can hurt performance even if engagement looks high, while positive sentiment often signals stronger long-term conversion and retention potential.
For example, a subscription app noticed high engagement on an ad, but comments revealed confusion about pricing. After clarifying the offer in the creative, conversion rates improved without increasing spend.
To move beyond surface-level signals, creative performance analysis requires a more structured, data-driven approach.
The Data-Driven Approach to Creative Performance Analysis
A data-driven approach to creative performance analysis helps you replace guesswork with clarity. Instead of relying on intuition or waiting weeks for results, you use data to understand what actually drives installs, purchases, or sign-ups and act on it faster.
Here is the framework for analyzing ad creative performance in a structured way that supports user acquisition decisions:
Step 1: Define Your Creative KPIs
Every creative earns its budget based on the results it drives. That’s why each ad should be evaluated using clear KPIs that measure the performance of the creative itself, not just the overall campaign.
Key creative KPIs to track include:
CPM (Cost Per Mille) to show how efficiently your creative is getting exposure. Lower CPMs often signal early platform approval and relevance.
CTR (Click-Through Rate) indicates whether your visuals and messaging are strong enough to stop the scroll.
CPI (Cost Per Install) is critical for mobile games and apps. A lower CPI means your creative is effective at driving installs.
CVR (Conversion Rate) shows whether users who click actually complete the desired action.
VTR (View-Through Rate) is for video ads and reveals how engaging your content is and where users drop off.
CPR (Cost Per Result) measures how efficiently your creative delivers the outcome you care about, such as installs or purchases.
These KPIs help you decide which creatives deserve more budget and which ones need changes.
Step 2: Collect and Centralize Your Data
Analyzing creative performance becomes slow and messy when your data is spread across ad platforms, spreadsheets, and dashboards. Jumping between Meta, Google, and other networks makes it easy to miss patterns and delay decisions.
To analyze creatives effectively, you need all creative-level data in one place. Centralizing your data allows you to:
Compare creatives across platforms.
Spot trends faster.
Reduce manual reporting.
Make quicker scale and pause decisions.
This step is especially important if you manage multiple campaigns, apps, or client accounts.
But how will you collect creative-level data from different ad networks without spending hours on manual work?
This is where AI-powered platforms like Segwise come in. With Segwise creative analytics, you don't need to jump between Facebook Ads Manager, Google Ads, TikTok, and your MMP dashboard. You can see creative-level ROAS, CPA, LTV, and conversion rates across all sources in a single unified view.
Step 3: Analyze the Data to Identify Patterns
This is where creative performance analysis becomes valuable. Instead of asking which ad performed best, you focus on why it performed best.
Break each creative into its core elements:
Visual style, layout, or color.
Headline or opening message.
Supporting copy.
Call to action.
Then compare how these elements perform across multiple creatives. Over time, patterns begin to emerge.
For example, you might find:
Static ads with people outperform product-only visuals.
Ads that open with a question drive higher conversion rates.
Certain colors or layouts consistently improve CTR.
These patterns give you direction for your next set of creatives.
Step 4: Turn Insights Into Clear Creative Decisions
Insights only matter if they lead to action. Once you identify winning patterns, you need to translate them into clear decisions.
At this stage, you should:
Scale creatives that consistently hit your KPI targets.
Pause or refresh creatives showing declining performance.
Replicate winning elements in new variations instead of starting from scratch.
This step connects creative analysis directly to budget allocation and campaign performance.
Step 5: Iterate and Monitor Continuously
Creative performance isn’t static. Even winning ads eventually fatigue. That’s why analysis needs to be ongoing.
To stay ahead:
Track new creatives against the same KPIs,
Monitor performance trends over time,
Refresh creatives using proven patterns before results drop,
By continuously iterating, you maintain performance stability and avoid sudden declines in user acquisition.
While a data-driven framework helps you analyze creative performance more clearly, the way you interpret and act on that data matters just as much. Even with the right metrics, small mistakes can lead to wrong conclusions and costly decisions.
Common Mistakes to Avoid During Ad Creative Performance Analysis

When analyzing ad creative performance, small mistakes can lead to wrong conclusions, wasted budget, and poor scaling decisions. Many UA teams don’t fail because of a lack of data, but because they interpret or use it the wrong way.
Here are the most common mistakes to avoid when analyzing ad creative performance:
Relying on vanity metrics: Metrics like impressions, likes, or views may look good in reports, but they don’t guarantee real user acquisition results. If you focus only on these numbers, you may scale creatives that attract attention but don’t drive installs, purchases, or subscriptions.
Ignoring creative-level performance data: Looking only at campaign or ad set results hides what’s actually working. Without creative-level data, you can’t tell which visuals, hooks, or messages are driving performance or wasting budget.
Testing creatives in isolation: Creative performance doesn’t exist in a vacuum. An ad can perform very differently based on platform, placement, device, or audience segment. Testing without considering context can lead to false conclusions and poor optimization decisions.
Waiting too long to act on insights: Delayed decisions can be just as costly as wrong ones. If you wait weeks to analyze results, underperforming creatives continue to burn budget while winning ads don’t get scaled fast enough.
Looking only at short-term performance: Early performance spikes don’t always mean long-term success. Some creatives perform well initially but fatigue quickly. Ignoring trends over time can cause sudden drops in ROAS and unstable campaigns.
Avoiding these mistakes helps you turn creative performance analysis into faster decision-making, better budget control, and more growth.
As creative volume grows and decisions need to happen faster, relying on a more scalable and systematic approach becomes necessary.
Also Read: How to Find Winning Creatives and Use AI to Maximize ROAS
How AI Simplifies Ad Creative Performance Analysis
When you rely only on common analysis methods, gaps start to appear. A/B testing slows down when you need to test many creative elements simultaneously. Multivariate testing shows which combination worked, but not which specific element drove the result. High CTR can signal attention, but it doesn’t guarantee installs or purchases. And engagement analysis alone doesn’t always translate into real user acquisition results.
This is where AI-powered platforms like Segwise make creative performance analysis simpler and more actionable by connecting creative elements directly to outcomes that matter.
Here’s how Segwise simplifies creative performance analysis for UA teams:
Automatic AI-powered creative tagging: Segwise uses multi-modal AI to automatically identify and tag creative elements such as hook, characters, colors, and audio components across images, videos, text, and playable ads. These tags are directly mapped to performance metrics like IPM, CTR, and ROAS, so you can see exactly which elements drive results.
Tag-Level Creative Element Mapping: This lets you see which specific creative elements drive performance. Discover patterns like "this hook appears in 80% of top-performing creatives" with complete MMP attribution integration.
Get a unified view across ad networks: Instead of switching between Meta, Google, TikTok, and MMP dashboards, Segwise brings all creative-level data into one place for faster comparisons and clearer insights.
Catch creative fatigue before results drop: With fatigue tracking, you can catch fatigue before it impacts your budget allocation and campaign results. You can also set custom fatigue criteria and monitor creative performance across Facebook, Google, TikTok, and all major ad networks.
Manage multiple apps, brands, or client accounts easily: Studio View lets you monitor creative performance across apps, games, and brands from a single, unified interface.
In short, Segwise helps you move from scattered signals to clear, confident user-acquisition decisions without slowing down your creative or performance teams.
Conclusion
Analyzing ad creative performance is no longer about tracking surface-level metrics or relying on gut feel. It’s about understanding why certain creatives drive installs, purchases, or subscriptions and turning those insights into faster, smarter decisions. By focusing on the right pillars, using the right analysis methods, and following a structured, data-driven framework, you can reduce wasted spend, scale winning creatives confidently, and build a repeatable user acquisition strategy.
As creative volume grows and platforms become more competitive, doing this manually becomes harder. So how do you know exactly which creative elements are driving installs, purchases, or subscriptions? That’s where an AI-powered platform like Segwise fits naturally into the process.
Segwise is an AI-powered creative analytics platform that helps UA and performance marketing teams understand which creative elements drive performance, track when creatives start to fatigue, and where budgets should shift before results drop.
It connects creative elements (hooks, dialogs, visuals, formats, etc.) directly to business outcomes (ROAS, CPA/CPI, LTV, IPM, conversion rates), so teams stop guessing what works and start scaling creatives with data-backed confidence.
If you want to analyze ad creative performance faster and with more clarity, start your free trial today and see how data-backed creative decisions can drive better user acquisition results!
