Best AI Ad Reporting Tools to Maximize ROI in 2025
You’re losing money when ad results are scattered, slow, or hard to trust. Reports that live in different places, signals hidden by privacy updates, and creative tests that take weeks all make it hard for you to know which ads actually work. AI ad reporting tools solve those problems by pulling data together, tagging what’s happening inside each creative, and giving clear, testable signals you can act on fast.
With privacy changes, some measurements now appear as aggregated platform signals rather than user-level events; modern tools blend those signals with modeled data so you can still measure and optimize. AI-driven creative testing and reporting are already showing double-digit lifts in efficiency and returns in many tests.
If you want to protect, spend, and make faster decisions, look for AI ad reporting tools that unify all your accounts and measurements, interpret creative elements to show how they affect outcomes, and provide clear, actionable recommendations you can test right away.
In this blog, we'll explain what modern AI ad reporting tools do, show how to pick and test the right one for your needs, and give short, practical checks and tool picks to start a fast pilot this quarter.
What Is an AI Ad Reporting Tool?
An AI ad reporting tool gathers ad data from platforms like Google, Meta, TikTok, and ad networks, then uses automation and machine learning to turn that raw data into clear reports and actionable insights. It does tasks you used to do by hand: pulls metrics, joins them, spots trends, flags problems, and suggests tests or budget shifts. The tool can also run simple natural-language queries, so you can ask questions in plain English and get charts or summaries back fast.
On mobile platforms where privacy rules changed tracking, these tools increasingly blend platform-level signals (like SKAdNetwork on iOS) with modeled data so you can still measure outcomes and optimize. That mix of aggregated platform signals plus predictive models is now a core capability for modern tools.
Basic vs Advanced AI Ad Reporting: What’s the Difference?
Once you know the fundamentals, the next step is recognizing the difference between basic automation and advanced AI-driven reporting. The gap between them often decides how quickly you can turn data into action:
Capability | Basic Ad Reporting | Advanced AI Ad Reporting |
|---|---|---|
Data sources | Pulls major ad platforms and simple CSV uploads. | Pulls all ad platforms, server events, MMP/SKAN inputs, analytics, and custom sources. |
Attribution & privacy | Uses last-touch or platform reports; limited SKAdNetwork handling. | Supports SKAdNetwork workflows, probabilistic modeling, and hybrid attribution for privacy-first environments. |
Report freshness | Scheduled daily/weekly exports. | Near real-time dashboards, streaming updates, and automated alerts for anomalies. |
Insights | Prebuilt KPIs and static charts. | AI-generated causal insights, predictive LTV and churn forecasts, and automated hypothesis suggestions. |
Creative analysis | Basic creative-level metrics (CTR, CVR). | Creative signal identification, AI-backed creative scoring, and variant testing guidance using large creative datasets. |
Natural language queries | Rare or limited. | Strong: ask questions in plain English and get charts, explanations, and exportable slides. |
Auto actions | Manual adjustments after human review. | Auto recommendations, automated rules, and API hooks for programmatic budget shifts. |
Integrations & scale | Fits small cross-channel teams. | Built for enterprise-scale, with many connectors and data governance options. |
Cost | Lower subscription fees; pay-per-connector. | Higher-tier pricing; value demonstrated through automation that saves spend and time. |
The table gives a quick overview of what each tier offers. Let’s look at specific tools that fit into these categories, starting with lighter, more manual options.
Also Read: Meta AEM vs SKAN in 2025: Choosing the Right iOS Attribution Stack
Top Basic Ad Reporting Tools for Manual or Dashboard-Only Workflows
Before adopting automation-heavy systems, review foundational tools for reporting, either via manual setup or lightweight dashboards. These focus on visibility and control rather than built-in AI insight:
1. Looker Studio (Google)
A free Google tool for building shareable dashboards and custom reports.
Best for:
Fast, free cross-source dashboards and ad visualizations when you already have clean, queryable data (works especially well when paired with BigQuery or a warehouse).
Features:
Drag-and-drop reports
Multiple connectors
Custom visualizations
Limitations:
Data blending and large queries can slow or even time out; large reports may hit practical performance limits.
There are limits on the number of blended sources/fields, making very complex multi-touch analyses cumbersome.
No built-in enterprise-grade attribution or AI insights: you’ll need SQL, BigQuery, or third-party connectors to build true ad-attribution models.
Pricing:
Free to use (no cost for core Looker Studio).
2. Google Sheets
A cloud spreadsheet for ad-level calculations, custom reports, and quick ad-data experiments.
Best for:
Ad-hoc analysis, quick pivot/KPI checks, lightweight experiments, and low-cost automation proofs using native add-ons or connectors.
Features:
Real-time collaboration
Formula library
Add-on connectors
Limitations:
Manual maintenance becomes brittle at scale, formula errors, refresh issues, and versioning risk increase.
Row/refresh limits and performance degrade for high-volume ad data sets.
Lacks native full-funnel attribution or automation requires connectors or a custom script/workflow to integrate into a serious measurement stack.
Pricing:
Free for personal use. Business plans (Google Workspace) start from around $7/user/month for small teams.
3. Meta Ads Manager (native platform reporting)
The platform-native reporting and campaign manager for Meta ads (create, view, export reports).
Best for:
Direct delivery metrics, creative breakdowns, and first-hand exports for Facebook and Instagram campaigns. Use it when you need platform-accurate impressions, placements, and native diagnostics.
Features:
Custom breakdowns
Scheduled exports
Campaign diagnostics
Limitations:
Limited to Meta’s ecosystem won’t provide a full cross-platform, multi-touch view.
Not privacy-aware on its own for full attribution needs, needs complementing with MMP or server-side tracking.
Data export and transformation for use in broader measurement stacks requires manual or third-party steps.
Pricing:
Free to use (included with Meta ad accounts).
After covering the simpler dashboards and spreadsheets, it’s time to explore tools that use AI to manage more tasks, from analysis to creative insights.
Best AI Ad Reporting Tools for Automated Insights and Creative Analysis
Once you’ve outgrown manual dashboards, these tools help lift the workload off your hands by analyzing data, spotting what’s driving results, and giving you clear, actionable insights instead of raw numbers:
1. Segwise
Segwise is an AI creative analytics platform that auto-tags creative elements across images, video, and playable ads, then links those tags to performance metrics so you can see which visual, copy, or audio elements actually move installs and value.
Best for:
Granular, element-level creative analysis auto-tagging visuals, copy, and audio across images, videos, and playables to reveal which creative elements actually drive installs and value. Ideal for teams optimizing creative performance and reducing fatigue through faster, evidence-based testing cycles.
Features:
Automated reports
Limitations:
Not an ad manager or attribution engine campaign, and MMP data must be imported for context.
Insights are modeled and require validation within your measurement stack before reallocating spend.
Pricing:
Free trial; custom pricing via sales/contact required.
2. Superads
Superads is an AI-driven creative analytics and reporting tool that builds multi-platform dashboards, scores creative variants, and offers an AI copilot that lets you ask plain-language questions about creative performance and get visual answers.
Best for:
Teams that want fast, shareable cross-network creative dashboards plus a conversational AI layer (an AI copilot) to ask plain-language questions about creative performance and get visuals back. Good for collaboration and quick diagnostics.
Features:
AI Copilot
Creative scores
Shareable dashboards
Limitations:
Lighter on deep attribution modelling and enterprise connectors may fall short for full-funnel decisioning.
Creative score-centric: might not surface hidden measurement biases or link directly to long-term value.
Should be used alongside your measurement/orchestration stack, not as the only tool.
Pricing:
Free plan (forever). Professional plans start at $49/month and scale with last-30-days ad spend.
3. Madgicx
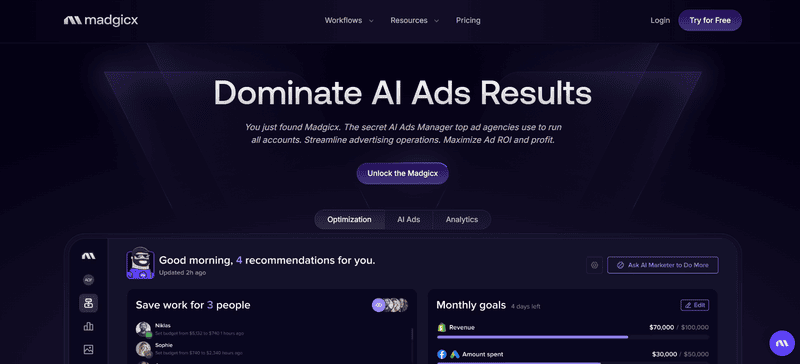
Madgicx is an AI-first ad management and analytics platform that combines campaign automation, creative generation, daily audits, and AI recommendations to optimize bidding and creative performance at scale.
Best for:
Hands-off campaign optimization, automated bidding, budget rules, and on-platform actions that can deliver operational ROI quickly if you allow the automations to run. It combines ad management with rules and AI recommendations.
Features:
AI automations
Creative generator
Real-time alerts
Limitations:
Focuses on operational automation rather than deep, tag-level creative insight. You’ll need a separate creative insight layer if you care about element-level hypotheses.
Works best inside certain platform ecosystems, with setup/tuning time required to align with KPIs.
Total cost of ownership can rise with tracking and pro feature-add-ons; automation needs oversight to avoid “set-and-forget” risks.
Pricing:
7-day free trial; spend-based plans (e.g., Pro tiers are often quoted at roughly $58/month when paid annually, with per-account add-ons). Confirm exact pricing inside the app.
These examples show how the right tool can simplify reporting and accelerate testing. But the reason this shift matters goes beyond convenience; it’s tied directly to how marketers protect and grow ROI in 2025.
Why AI Ad Reporting Tools Drive Higher ROI in 2025
Ad budgets are climbing again, and AI-led automation is reshaping how spend is distributed across platforms. Without clear reporting, those shifts can drain ROI before you even spot the cause.
Here’s what defines the 2025 landscape and why smarter ad reporting is now a must:
Mobile leads global growth: Mobile ad spend is projected to reach around $447 billion in 2025, capturing the majority of digital budgets worldwide.
Automation dominates: Nearly 90% of display ad spend now flows through programmatic systems, demanding transparency into what’s driving conversions.
Privacy limits visibility: With iOS attribution moving toward SKAdNetwork and AdAttributionKit, roughly 40% of performance data now arrives in aggregated form, requiring modeled insights for accuracy.
AI reshapes creative testing: Advertisers using AI-assisted creative analysis report up to 50% gains in ROAS, proving that data-linked creative reporting directly impacts returns.
In short, 2025 rewards marketers who can see through automation, decode fragmented data, and connect creative signals to real business value. Strong AI ad reporting tools make that possible, helping teams react faster, test smarter, and protect margins in a privacy-first environment.
Knowing why strong reporting is critical sets the stage for what the tools themselves need to deliver. The following list outlines the capabilities that separate surface-level dashboards from truly effective systems.
What Does a Modern AI Ad Reporting Tool Must Do?
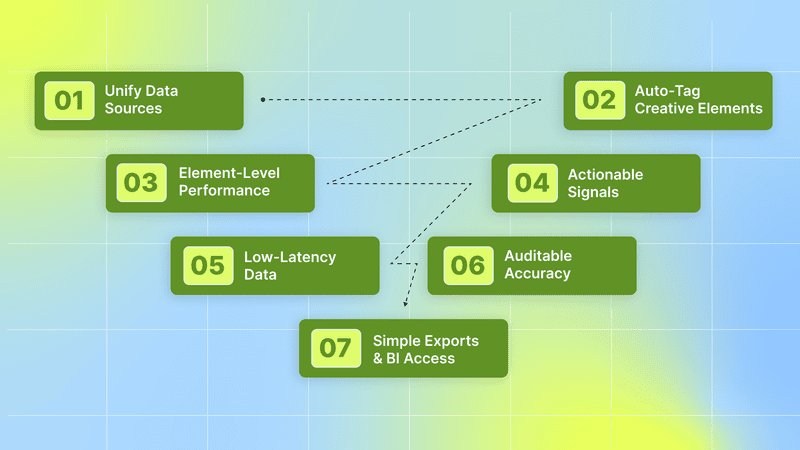
Below are the practical capabilities a tool must have to help you spend smarter and move faster.
1. Unify Data Sources (One Place for Everything): The tool must pull ad account data, attribution data, and analytics into a single dashboard. That means linking the major ad platforms and mobile measurement partners so numbers line up and you stop joining spreadsheets by hand.
2. Auto-Tag Creative Elements: It should automatically read your ads and label the parts that matter: hooks, calls to action, scenes, on-screen text, speaker audio, product shots, and more. Good auto-tagging uses vision and language models so tags match what people actually see and hear.
3. Element-Level Performance: You should see performance tied to tags, not just campaign or ad names. That means ROAS, CPA, CTR, IPM, or other KPIs shown for each tag (for example: “humor hook” vs “demo scene” vs “end-frame CTA”). This is how repeatable creative wins are found.
4. Actionable Signals: The product must surface clear signals: it should flag creative fatigue, suggest A/B ideas, and rank concept-level winners so you can plan next tests with confidence. Signals must be precise and tied to measurable steps.
5. Low-Latency Data: You need daily or intra-day updates so you can stop guessing and start changing bids, pausing ads, or launching refreshes within hours. Fresh data helps you stop spending leaks fast.
6. Auditable Accuracy: The system must show match rates and let you compare its joins to your MMP or sample raw logs. That audit trail builds trust and stops surprises when finance or compliance asks for proof.
7. Simple Exports & BI Access: Exports in CSV format, plus direct sync to a data warehouse or a reverse-ETL option, are essential so your finance and modeling teams can run forecasts and reconciliations outside the tool. Pick a product that supports common warehouses like Snowflake or BigQuery, as well as streaming/ETL partners.
These features turn creative work into repeatable inputs for growth, not just gut calls.
Even with the right features on paper, not every tool performs equally well in practice. A structured evaluation helps you confirm which ones actually meet your needs and scale with your data.
Also Read: How to Combat Creative Fatigue with AI Solutions
How to Evaluate AI Ad Reporting Tools
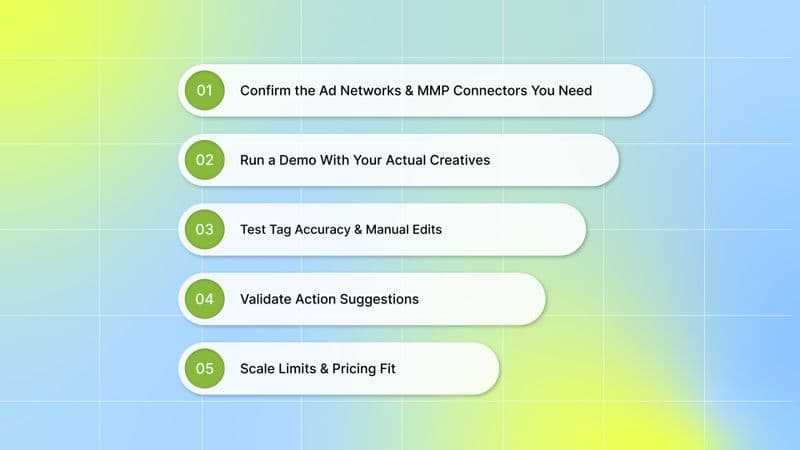
Use this five-step checklist when you vet vendors. Run real tests, not demos full of marketing slides:
Step 1: Confirm the Ad Networks and MMP Connectors You Need
Make a short list of the ad platforms and measurement partners you run today and plan to use. Typical ad sources include Google Ads (UAC), Meta (Facebook & Instagram), TikTok for Business, Apple Search Ads, Snapchat, Unity, AppLovin, AdMob, and others. Common MMPs include AppsFlyer, Adjust, Singular, Branch, Kochava, and Tenjin. Missing a connector creates blind spots in reporting.
Step 2: Run a Demo With Your Actual Creatives and Sample Performance
Ask the vendor to ingest a small set of your creatives and a week or two of real performance data. This shows how the tool tags your assets and whether the output maps to your KPIs. Generic demo data can hide fundamental gaps.
Step 3: Test Tag Accuracy and Manual Edits
Check a random sample of tagged ads. You should be able to easily correct tags, and the tool should learn from fixes or accept custom tags. If tag errors are common or hard to fix, the insights will be noisy.
Step 4: Validate Action Suggestions
Ask for specific examples where the tool suggested a change and what happened after (or run your own test). Signals must be concrete and reproducible (for example: “pause creative A after CTR drops 20% and reallocate to creative B; test a new CTA”). Vague recommendations are not helpful.
Step 5: Check Latency, Scale Limits, and Pricing Fit
Confirm how often data updates and whether the platform can handle your account count and creative volume. Review pricing against your monthly ad spend and expected growth. Also, check export and warehouse options so finance and analysts can use the same dataset outside the UI.
Run these five checks as a short proof of value. If a tool passes them on your own data, it can save time and cut waste quickly.
With a solid testing process behind you, the standouts become obvious. Segwise is one of the few that consistently delivers measurable gains in both clarity and speed.
Why Segwise Is the Best AI Ad Reporting Tool in 2025
Segwise brings creatives and performance into one place. It reads images, video frames, on-screen text, audio, and playable creatives, and creates tags for elements such as hooks, product shots, CTA overlays, characters, and music cues. Those tags are mapped to network and attribution KPIs (installs, IPM, CTR, CPA, and ROAS) so you can rank and filter creative elements by their effect on installs and revenue. Segwise offers no-code connectors to major ad platforms and MMPs, as well as export options for spreadsheets or BI tools.
What Makes Segwise Different?
Beyond its core setup, what separates Segwise from other AI-driven platforms is how it connects creative elements to actual performance. Its approach goes deeper than standard automation.
1. Multimodal Creative Tagging
Segwise reads visuals, frames, on-screen text, and audio, then creates descriptive tags such as “hook line,” “product shot,” “CTA overlay,” “character,” and “music cue.” Those tags sit next to performance numbers so you can see which elements drive installs or revenue.
How that helps: You stop guessing. If you want to know whether the dialogue or the music drove a lift in IPM, the tags give you a ranked list of elements that correlate with the KPI you care about.
How to test it in a trial:
Upload 10–20 recent creatives (images + videos).
Wait for auto-tagging to finish and open the tag table.
Pick one creative that has both dialogue and music. Filter by tag (dialogue vs music) and compare IPM and CTR for each.
What to expect: Clear tags for scenes, on-screen text, and audio cues, plus per-tag KPIs you can filter and export.
Also Read: Why Creative Tagging Matters for Mobile Game Marketers in 2025
2. Cross-Network Creative Maps (Creative Signals Across Placements)
Segwise joins ad network metrics with MMP attribution, so one creative concept is shown side-by-side across placements, for example, short-form feed vs long-form video or in-stream placements. That view ties the same creative tags to each placement’s KPIs.
How that helps: You stop treating each network as a separate experiment. If a hook wins repeatedly across placements, you can scale it faster. If it only wins on one placement, you can adapt the creative for other placements.
How to test it in a trial:
Connect two ad networks you run (for example, TikTok and YouTube) and your MMP (AppsFlyer, Adjust, or Singular).
Open the creative map and search for the same tag or creative concept across both networks.
What to expect: A side-by-side view that lists per-placement KPIs (IPM, CPA, ROAS, or LTV) tied to the same creative tags.
3. Action-First Alerts and Test Ideas
Segwise runs continuous checks and flags early drops, creative fatigue, or rising CPA. It surfaces short, actionable recommendations like “pause variant A,” “increase exposure to variant B,” or “test CTA X vs CTA Y.”
How that helps: You get clear next steps that you can act on the same day, rather than a long list of charts to interpret. This shortens the loop between insight and action.
How to test it in a trial:
Connect accounts and let the system run for 7 days.
Ask for “Top 3 recommended actions” for the past week and check each suggestion against tag-level metrics.
What to expect: Targeted suggestions tied to specific creatives, plus supporting numbers that explain why each action is recommended.
4. Low-Friction Setup
Segwise offers no-code connectors to major ad platforms and MMPs, as well as export options (CSV, Slack/Email, cloud storage) so you can bring tag and KPI data into spreadsheets, BI tools, or data lakes. Setup takes just a few minutes, and you can start with a free trial, no credit card needed.
How that helps: You avoid long engineering projects. Run a pilot, export raw tag metrics into your reporting model, and validate the lineage from creative → tag → KPI.
How to test it in a trial:
Begin your free trial (no credit card).
Connect one ad network and your MMP.
Request a CSV export of tagged assets and tag-level KPIs; import that file into a spreadsheet or BI tool.
What to expect: Downloadable tag tables and KPI exports you can reconcile with MMP reports.
These features work together to shorten decision cycles and reveal what drives performance. The next question is who benefits most from this kind of visibility.
Who Should Use Segwise?
Use it if you:
Run lots of creative variants across several ad networks.
Need faster signals for which creative ideas drive installs and revenue.
Test many campaign concepts and want clear next steps.
Manage repeat-revenue products and care about downstream value.
Coordinate many brands or projects and want consistent creative learning across accounts.
Segwise turns creative performance from a guessing game into clear, measurable insight. It helps you see which parts of every asset truly drive results, so each test leads to smarter decisions and stronger returns across networks.
Conclusion
When ad spend is tight and every click matters, clear insight becomes key. The right tool doesn’t just track numbers; it shows what truly works so you can focus on ideas that drive results. The faster you spot what fuels growth, the quicker you can scale wins and stop what doesn’t. Real ROI comes from smarter, faster decisions, not more reports.
In 2025, results move fast, and so should your insights. With Segwise, every creative tells its story through data you can act on right away. Try the free trial, see which ideas truly drive installs and revenue, and turn your reporting time into growth time.
FAQ's
1. What are “AI ad reporting tools” and how do they help improve ROI?
They collect ad and measurement data, auto-tag creative elements, and use models to show which creatives and budget moves actually drive installs and revenue, so you can act faster.
2. Will these tools still work after privacy changes like SKAdNetwork?
Yes, modern vendors accept platform-level signals such as SKAdNetwork and combine them with modeled data so you can keep measuring performance in privacy-first environments.
3. Can I trust AI suggestions to automatically change budgets or pause ads?
Treat AI suggestions as testable recommendations: validate them with short experiments, check audit trails, and ask vendors about how models were built and validated before you let automations run.
4. Which data connectors and exports should I confirm before buying?
Make sure the tool connects to every ad network and MMP you use (Google, Meta, TikTok, AppsFlyer/Adjust/Singular, etc.) and that it offers CSV/warehouse exports for reconciliation.
5. How fast will I see useful recommendations, and what should a pilot look like?
Expect near-real-time dashboards and action items within days; run a 7–14-day pilot that ingests a sample of your creatives and performance data to test tag accuracy and generate suggested actions.

Comments
Your comment has been submitted