
The best Facebook ads analytics tools in 2026 are Segwise for creative-element intelligence across 15+ ad networks and MMPs ($499 a month, 50% off under $50K spend, 7-day free trial), Motion for creative reporting a strategist or client will actually read ($750 a month), and Superads for the cheapest genuine creative reporting at $125 a month. We judged every tool on four things: how deeply it reads the creative itself, how much of your channel and attribution data it can join to Meta, whether it publishes its pricing, and how long it takes to reach a first report you would act on. Fifteen tools are compared below, eight of them reviewed in depth.
This page is about measurement. It covers the tools that tell you what your Facebook and Instagram ads did and why, at the creative level rather than the campaign level. If what you actually want is to change bids, shift budgets, build audiences or automate campaign operations, that is a different job and a different shortlist, and it lives in our guide to tools for testing and scaling Meta ads.
Disclosure: this guide is published by Segwise, one of the 15 tools reviewed here. Every price was checked at the vendor's own pricing page in September 2026, Segwise gets the same limitations treatment as everything else on this page, and any Segwise performance figures are self-reported by our customers and labeled as such.
Facebook Ads Analytics Splits Into Four Layers, and Most Teams Only Need One
"Facebook ads analytics" is a single search term covering four products that do genuinely different work. Most disappointing purchases in this category are not bad tools. They are the right tool for a layer the team already had covered.
Reporting shows you what happened: clicks, impressions, spend, ROAS inside Meta's attribution window. Analytics tells you why it happened and what to change. Those are the two halves of the category, and each splits again.
A quick way to find your own gap. Open your last Facebook performance review and look at the argument that took longest to settle. If it was "we cannot agree on which ad won", you need the reporting layer. If it was "we know which ad won but not why", you need creative intelligence. If it was "Meta says 4.1 ROAS and Shopify says 2.3", you need attribution. If it was "nobody could pull the numbers in time", you need a pipeline.
What Meta Ads Manager Still Will Not Tell You in 2026
Ads Manager is fine for the job it was built for. It is where you pause a losing ad set, check yesterday's spend and set up a campaign. It is not built for creative analysis, and the gap has widened as Meta's delivery has become more automated and the reporting has become more aggregated.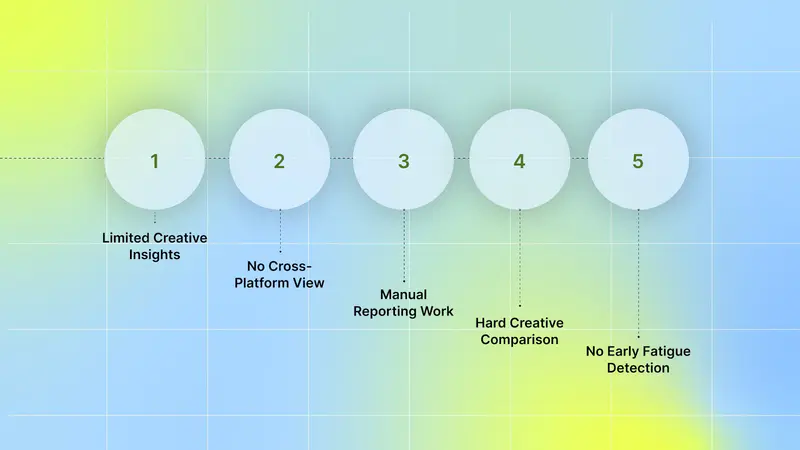
It reports at ad level, never at element level. Ads Manager can tell you that ad 4471 beat ad 4472. It cannot tell you that the difference was a two-second question hook instead of a product shot, because it has no idea what is inside the file you uploaded. Every creative conclusion you draw from Ads Manager is one you inferred yourself.
There is no cross-network view. The same video running on Meta, TikTok and an app network produces three unconnected rows in three interfaces. You cannot ask whether that creative works, only whether it worked on Facebook.
It cannot join to your MMP or your store. Meta reports the conversions Meta saw. Your AppsFlyer or Adjust numbers, and your Shopify numbers, sit somewhere else. Reconciling them is manual, and the attribution window you have selected quietly changes the answer.
Comparing many creatives is genuinely hard. Once you are running 50 or more live variants, the interface is a table of IDs. Grouping by concept, angle or format means exporting to a spreadsheet and typing tags by hand.
There is no fatigue warning. You find out a creative is dying by noticing that ROAS fell, which is usually a week or more after it started falling. Nothing tells you in advance.
None of that is a reason to abandon Ads Manager. It is a reason to accept that it answers "what happened" and to buy the layer that answers "why". For a longer treatment of the specific gaps, see what Meta misses and how to fill the gaps.
How We Judged These Facebook Ads Analytics Tools
Every tool here was assessed against the same five criteria, in this order.
Creative depth. Does it read the asset itself, tag what is inside it, and map those tags to the metric you optimise for? Or does it stop at the ad ID?
Data it can join to Meta. Other ad networks, MMPs, a store, a warehouse. Depth on Facebook alone is worth less if Facebook is not the only place you spend.
Published pricing. A tool that publishes numbers can be shortlisted without a sales call. Where a vendor publishes nothing, this page says "not published" rather than repeating a figure from a third-party listicle.
Time to a first useful report. Not time to connect the account. Time until the output changes a decision.
Honest limits. Every entry below carries the thing the tool genuinely cannot do, including ours.
All 15 Facebook Ads Analytics Tools Compared
Which Facebook Ads Analytics Tool Fits Your Situation
Find the row that describes you. If more than one does, buy against the one costing you money this quarter, not the one that sounds most sophisticated.
Two situations worth naming because they are common and the answer is "not yet". If your reporting problem is really that nobody has time to act on a report, more reporting will not fix it. And if your ROAS is falling while your attribution is fine, the problem is the creative, so buying a better measurement of the same decline is an expensive way to watch it happen.
The 8 Best Facebook Ads Analytics Tools, Reviewed in Depth
1. Segwise - Best for creative-element intelligence across Facebook and every other network you buy

Most Facebook ads analytics tools tell you that ad A beat ad B. Segwise tells you what inside ad A was responsible. Its Creative Tagging Agent runs multimodal AI over each asset, tagging video frames and pacing, spoken dialogue, audio tone and music, on-screen text, characters, product shots and CTAs, then maps every one of those tags to the metric you actually optimise for. The output is a sentence you can act on, of the form "question hooks are carrying 2.3 times the CTR of product-shot hooks across your live Meta campaigns", rather than a table of ad IDs.
The reason it belongs at the top of a Facebook-specific list is not that it is Facebook-specific. It is the opposite. The same creative usually runs on Meta, TikTok, Google and, for app teams, on Axon, Unity Ads and Mintegral, and Segwise is the layer that lets you ask whether the creative works rather than whether it worked on Facebook. Connecting Meta is a no-code flow in the dashboard under Settings, Ad Networks, then Connect under Meta, and it backfills history on signup so the first report is not two weeks away.
Key features
Creative Tagging Agent. Multimodal tagging across video, audio, image and text. It is one of very few platforms that tag playable and interactive ads, which matters if you run playable formats on Facebook alongside video.
Tags mapped to any metric you track. Not a fixed set. Element performance can be read against ROAS, CPI, CTR, CVR, IPM, LTV, spend or a custom event you defined yourself, which is what makes the insight usable for a games team and an ecommerce team at the same time.
Creative fatigue tracking. Continuous monitoring against thresholds you set, for example a 20% ROAS decline over seven days or a 30% CTR drop, with alerts before the budget is gone. You can also set success criteria for brand-new creatives so you learn quickly whether a test is working.
Creative Strategy Agent, the AI chat. Full context over your creative data, so you can ask why last week's winner won in plain language. It also analyses performance and drafts creative briefs and concepts, which is the part that turns a report into the next round of ads.
Cross-network and MMP coverage. Meta, Google, TikTok, Snapchat, Axon (AppLovin), Unity Ads, Mintegral, Moloco and Liftoff, plus AppsFlyer, Adjust, Branch, Singular and Kochava. Setup is roughly five minutes per source and 10 to 15 minutes to connect everything.
Asset clustering. Groups ads built from the same underlying footage or audio, so when two near-identical creatives perform differently you can see which treatment caused it instead of guessing.
MCP access. Query your Segwise creative data from your own AI tools, so the analysis is not trapped behind one dashboard.
Competitor Tracking Agent. Tags competitor ads on Meta with the same AI and runs gap analysis on angles nobody in your category is using.
Custom dashboards and reporting. Built around your KPIs, with automated reports showing how creative decisions moved ROAS across apps and campaigns.
When you should try it
Try Segwise if you run more than about 50 live creatives, if your creative team keeps asking what to make next and the honest answer is a guess, or if the same asset runs on Facebook and on networks Facebook-only tools cannot see. It fits UA managers, creative strategists and performance marketing teams at mobile game studios, DTC brands, subscription apps and growth agencies.
Limitations
It is a measurement and generation layer, not a buying layer, so it will not move budgets or adjust bids inside Ads Manager for you. It reports on what the networks and your MMP report, which means it is not an incrementality tool and will not tell you whether a Facebook-claimed conversion would have happened anyway. Competitor tracking currently covers Meta only. And below roughly 50 creatives the element-level analysis has thin data to work with.
Pricing
Segwise starts at $499/month for advertisers spending up to $250K/month, with a special 50% discount for startups spending under $50K/month. A 7-day free trial imports up to two weeks of history, and paid plans backfill up to three months. Book a demo to see the tagging run against your own Facebook account.
2. Motion - Best for Facebook creative reporting a client will actually read

Motion builds its reports around the creative rather than the campaign. Each row is a thumbnail sitting next to its spend, ROAS, hook rate and hold rate, grouped by concept, so a Friday creative review scrolls through ads instead of reading a spreadsheet. Its AI tagging labels Meta ads by asset type, visual format, hook tactic, messaging theme, offer, seasonality and audience, which means the review can start from attributes rather than ad IDs.
What earns Motion its place on a Facebook list is trust in the output. The reports are clean enough to put in front of a client without reformatting, which is why agencies keep it even after buying something deeper. Every paid Motion plan includes Runneth, an AI agent that answers in Slack, writes briefs, makes static ads and runs scheduled reports and alerts.
Key features
Creative-first reporting. Thumbnail-led pages grouped by concept, with hook rate and hold rate alongside spend and ROAS.
AI tagging on Meta ads by asset type, visual format, hook tactic, messaging theme, offer, seasonality and audience, for grouping and comparison. AI tagging works on Meta ads only.
Slack delivery and routines. Scheduled daily and weekly reports, iteration finders and alerts pushed to Slack rather than waiting in a dashboard.
Benchmarks, MCP and attribution joins. Category benchmarks, full data and MCP access, and integrations with Northbeam and Google Analytics.
Unlimited seats and ad accounts on every plan, which is the reason agencies pick it over per-seat tools.
When you should try it
Try Motion if you are a DTC brand or agency whose spend sits on Meta and TikTok and whose real bottleneck is producing a creative report people read and act on, with the tagging handled for you.
Limitations
Coverage is Meta, TikTok, YouTube and LinkedIn, and AI tagging is Meta only, so heavy Google Ads or app-network spend runs past its edges. There is no MMP connection, so an app team cannot tie a Facebook creative to installs or downstream revenue inside Motion. Apart from static ads made by Runneth, it does not generate creatives, and it does not read playable formats. It is also the most expensive self-serve entry point in this category.
Pricing
Starter at $750 a month for up to $50k in monthly ad spend, Pro at $1,200 a month above that, and a custom Growth tier above $125k monthly spend. Seats and ad accounts are unlimited on every plan. Third-party pages still listing Motion at $99 to $499 are quoting a price that no longer exists.
3. Superads - Best value creative reporting across Meta, TikTok and LinkedIn

Superads works the same creative-reporting layer as Motion at roughly a sixth of the entry price. AI auto-tagging sorts creatives by hook type, visual element, tone and messaging pattern with no manual labelling, and it groups individual ads into concepts so you can see which narrative angle is working rather than only which single ad won last month.
Worth correcting a stale figure that is still circulating, including in earlier versions of this page: Superads no longer has a free plan and is no longer $49 a month. It is a single Professional tier at $125 a month with a 14-day trial. That still makes it the cheapest genuine creative-element reporting on this page, but it is a purchase now, not a signup.
Key features
AI auto-tagging by hook type, visual element, tone and messaging pattern.
Concept-level grouping that rolls individual ads up into strategic themes.
Creative-element breakdowns across Meta, TikTok, LinkedIn and YouTube in one view.
Spend-based rather than seat-based pricing, so the whole team can be in it.
Automated, shareable dashboards for team and client updates.
When you should try it
Try Superads if your spend is on Meta and TikTok, your creative volume is moderate, and Motion is more than the reporting problem is worth to you. The $125 tier covers up to $100k in monthly ad spend, which fits most single-brand teams and small agencies.
Limitations
It is a creative reporting tool and nothing else. There is no attribution engine, no incrementality measurement and no budget optimisation. It has no MMP integrations, so AppsFlyer or Adjust attribution cannot be joined to the creative data, which rules it out for most app teams. Tagging accuracy varies on nuanced messaging and on brand-specific creative conventions, and it does not read playable ads.
Pricing
One Professional tier at $125 a month billed annually, which works out at $1,500 a year, covering up to $100k in monthly ad spend and adding $100 a month per further $100k. A monthly-billing rate is not displayed. Enterprise is custom. There is a 14-day free trial and no free plan.
4. Singular Creative IQ - Best for app teams whose Facebook attribution already lives in Singular

Singular Creative IQ is the creative reporting layer bolted onto an MMP, and that is its whole argument. Because Singular already holds your attribution data, Creative IQ can put a Facebook video next to installs and downstream revenue that Meta itself never reported, without you reconciling two systems. It shows assets side by side with performance metrics, applies AI tagging to categorise them, and its Creative Explore view supports deeper reporting across campaigns and channels.
This is a shorter entry than the tools above for a reason. Creative IQ is a feature of a measurement platform rather than a product you buy for creative analysis alone, and it is only worth evaluating in that context.
Key features
Creative assets displayed alongside attributed performance, not just platform-reported numbers.
AI-powered tagging to categorise and group creative assets automatically.
Creative Explore for cross-channel creative reporting inside the same tool as your attribution.
When you should try it
Try it if Singular is already your MMP and you want creative reporting joined to attribution without adding a vendor. If your MMP is AppsFlyer, Adjust or Branch, this argument does not apply to you.
Limitations
It does not offer automated tagging built for playable ads, so interactive creative cannot be analysed at the component level. Tagging is broader and shallower than a dedicated creative intelligence platform, it has no named fatigue feature, though its custom alerts let you set thresholds on creative metrics, and its creative ROI works best when Singular is also your MMP.
Pricing
Creative IQ pricing is not published. Singular prices its platform per conversion instead, with a free tier up to 15,000 paid conversions, $0.05 per conversion on Growth and custom enterprise terms, so what Creative IQ costs you depends on your install volume rather than your creative volume. Creative IQ itself is free for 14 days.
5. VidMob - Best for brand advertisers who need creative scored against best practice

VidMob approaches Facebook creative measurement from the brand side. Rather than starting from your own account history, it scores creative against platform best practice and category norms, then connects those scores to campaign outcomes such as engagement, conversions and ROI. For large advertisers running the same campaign across many markets, that comparative framing is the point.
Key features
Creative scoring. Ads assessed against best-practice signals, producing a score and specific areas to fix.
Creative measurement tied to outcomes. Links creative decisions to engagement, conversion and ROI across audiences, regions and platforms.
Creative data API and exports. Feeds creative insight into an existing marketing measurement stack rather than keeping it in one dashboard.
When you should try it
Try VidMob if you are a brand or agency running Facebook campaigns across multiple markets and need creative measurement that stands up in a marketing science review.
Limitations
It is built for considered, periodic creative measurement rather than rapid iteration, so a performance team shipping new creative weekly will find the cycle slow. Tagging is less granular at the element level than dedicated creative intelligence tools, there is no MMP join for app teams, and pricing is not published, which means an enterprise sales cycle.
Pricing
Not published. Enterprise quote through a demo.
6. Northbeam - Best for attributing Facebook revenue down to the individual asset

Northbeam is built for the media buyer who reallocates budget daily and wants to know which specific ad drove the revenue, not which campaign. It runs a blended attribution model across Meta, TikTok, Pinterest, Snap, Google and Microsoft, and it lets you set different attribution windows per channel, which is unusual and genuinely useful when Snap and Meta behave nothing alike.
It sits in the attribution layer, not the creative layer. Northbeam will tell you that a particular Facebook asset produced revenue. It will not tell you that the reason was the first three seconds.
Key features
Blended attribution across the six major paid channels.
Asset-level revenue attribution rather than campaign-level only.
Attribution windows configurable per channel.
A media-buyer interface and straightforward Shopify onboarding.
Incrementality testing, launched in early 2026 and still young.
When you should try it
Try Northbeam if you are a Shopify brand spending roughly $50k to $500k a month with hands-on buyers who want asset-level revenue and honest channel comparison. Below that the licence is a large share of the spend it is measuring.
Limitations
The architecture is Shopify-centric, so WooCommerce, Magento and custom storefronts are poorly served. The attribution weighting is not disclosed, so when the numbers disagree with Meta you have no audit trail to reason about. It makes no budget changes itself, and its incrementality testing does not yet have a long production record. It is also the most expensive self-serve option here.
Pricing
Starter at $1,500 a month, billed month to month, for Shopify brands. Professional at $3,500 a month on an annual term. Growth and Enterprise are quoted. The final number is scaled to your pageview volume, so treat $1,500 as a floor rather than a price. There is no free plan and no published trial.
7. Triple Whale - Best for tying Facebook spend to Shopify profit

Triple Whale answers a different question from most of this list: not which ad won, but whether the whole Facebook line item is making money once margin, CAC and lifetime value are in the frame. For a Shopify founder that is often the first question, and Triple Whale gets to an answer faster than anything else here, usually inside an hour of connecting the store.
Key features
Total Impact attribution. A blended model combining pixel data, platform API data and modelled estimates.
Profitability dashboards. CAC, LTV, margin by channel and unit economics next to ad spend.
Triple Pixel. First-party server-side tracking to counter browser and iOS limits.
Post-purchase surveys for self-reported attribution alongside the model.
Moby, its AI assistant, for plain-language questions and anomaly alerts.
When you should try it
Try Triple Whale if you run a Shopify brand spending roughly $10k to $200k a month and the decision you keep deferring is whether Facebook is profitable at all.
Limitations
Shopify only, with no support for WooCommerce, Magento or custom storefronts. The Total Impact weighting is proprietary and undisclosed, so there is no audit trail when its number and Meta's number disagree. It does no creative-element analysis, so it cannot tell you which ads to make more of, and it makes no budget changes for you. Pricing scales with revenue, so the bill grows as the store does.
Pricing
A genuine free plan is available with the Triple Pixel and a 12-month lookback. Foundation is $219 a month, or $2,190 a year, and Automate is $749 a month, with custom enterprise terms above that. Third-party pages quoting $179 are out of date.
8. Supermetrics - Best for getting Facebook data into a spreadsheet, dashboard or warehouse

Supermetrics solves exactly one problem and solves it well: moving Meta Ads data on a schedule into Google Sheets, Looker Studio, Excel or a warehouse. It is not an analytics platform. It is the backbone of the build-your-own-dashboard approach, and at $39 a month it is the cheapest honest answer for a team whose real complaint is that pulling numbers eats Monday morning.
It is also the tool most often bought by mistake. Teams who want to know why creatives win buy a pipeline, get their numbers faster, and are no closer to an answer.
Key features
175+ connectors, so Meta data lands alongside Google Ads, TikTok and GA4.
Destination agnostic. It exports into the tool you already use rather than its own interface.
Scheduled refreshes that end the CSV-and-pivot-table ritual.
The most granular Meta API breakdowns available, for analysts building custom metrics.
When you should try it
Try Supermetrics if your team is analytical, already reports in Sheets or Looker Studio, and wants maximum control over the presentation for a small monthly fee.
Limitations
No creative tagging, no fatigue detection, no analysis layer of any kind. It passes through whatever Meta reports, so a duplicated conversion in Ads Manager becomes a duplicated conversion in your spreadsheet. Broken connectors do not always raise an alert, so stale data can sit unnoticed for days, and it does not scale gracefully across large multi-account setups with messy naming conventions.
Pricing
Starter at $39 a month billed annually, or $49 billed monthly. Growth at $159 annually and Pro at $399 annually, rising with connectors, destinations and data volume. Enterprise is quoted. There is a 14-day free trial with no card required.
7 More Facebook Ads Reporting and Analytics Tools Worth Evaluating
These solve narrower problems. They are shorter entries because there is less to say, not because we ran out of room.
Whatagraph. Built for the agency that manages 20 accounts and needs branded Facebook reports out the door on schedule. Drag-and-drop builder, 50+ source credits, white labelling with client logos and custom domains, automated delivery and AI summaries that turn tables into sentences. The catch is that it adds no analytical depth: there are no custom metric calculations beyond what the platforms report, so blended ROAS or margin-adjusted KPIs cannot be built inside it. It has also repriced sharply upward and now runs two tiers only, Max from EUR 699 a month billed annually with 50 source credits, and a custom Prime tier, with no free trial. At that price it costs more than Motion, which does read the creative, so it now only makes sense when report delivery at scale is genuinely the whole job.
Coupler.io. A no-code pipeline that pulls campaign, ad set and ad-level Facebook data on a schedule and lands it in Sheets, Looker Studio, Power BI or BigQuery, alongside 400+ other sources. Its own AI agent and native connections to Claude, ChatGPT and Gemini let you query the joined data in plain language, which is the cheapest route to "why did Tuesday look strange" without building a dashboard first. No creative decomposition and no fatigue detection. There is a permanent free plan, a 7-day full-access trial, and Starter at $24 a month billed annually or $32 billed monthly.
Funnel.io. A heavier data hub for teams whose bottleneck is transformation rather than collection: custom mapping, currency conversion and calculated metrics so Facebook data lines up with everything else. Strong ecommerce connectors make it popular with retail brands merging cost and revenue. It is strictly a pipeline and needs a BI layer on top, and Starter at $300 a month billed annually makes it roughly eight times the cost of Supermetrics for the same raw job, so buy it for the transformation engine or not at all. Business is $600 a month, Enterprise is quoted, and there is no free trial.
Adverity. The enterprise end of the same layer, with data governance as the selling point: cleaning, transforming and normalising Meta data alongside CRM and ERP sources before it reaches Tableau, Looker Studio or Power BI. Worth evaluating only if data quality and lineage are the actual problem and you have a data team to use it. Significant cost and implementation time. Pricing is not published, and Adverity says so directly: it quotes every client individually rather than running plans.
DashThis. The low-effort version of Whatagraph. It connects to the Meta API and produces a clean, white-labelled dashboard in under an hour with almost no learning curve. It has no AI tagging, no data transformation and no way to blend custom MMP metrics, so it is a presentation tool and nothing more. Individual at $44 a month, Professional at $139, with AI Insights as a separate $19 add-on and a 14-day trial. Since Whatagraph repriced, this is the sensible default for an agency that just needs reports out the door.
SegmentStream. The only tool here that tries to prove Facebook caused the revenue rather than measure the revenue Facebook claimed. It scores site visits behaviourally to assign credit, runs geo holdout tests for causal evidence, and sends modelled conversion signals back to Meta through the Conversions API to recover signal lost to consent gaps and iOS. It is a partnership rather than a signup, and the economics do not work below roughly $50k a month in spend. Online starts at $800 a month and Full Funnel at $1,200, both on quarterly or annual billing, with a human-led enterprise tier from $5,000 a month on annual billing only and a paid three-month proof of concept.
Foreplay. Primarily an ad library and swipe-file workflow, but its Ad Reports feature does real work on your own Meta account: customisable white-labelled creative reports, shareable external links and enriched context around each asset. Useful when the same team doing creative research also owes a client a report. It has no MMP integration, so attribution depth is limited, and no custom fatigue criteria. Watch the tier: the reporting product is called Lens and it is not on the $49 Basic plan, it starts on Workflow at $149 a month billed annually, with additional brands at $50 each. Foreplay lists Lens on the Basic plan card while its own comparison table marks Basic as excluded, so confirm this on the trial rather than the pricing page. Its competitor research side is compared properly in our guide to ad spy and competitor research tools.
What a Facebook Conversion Means for App Teams and for Store Teams
This is the split that decides most of these purchases, and almost no roundup mentions it. "Which Facebook creative performed best" is a different technical question depending on where your conversion happens, because the number Meta shows you is produced differently in each case.
Two practical consequences. First, an app team that buys a Facebook-only creative tool will get element-level tags mapped to platform-reported installs, which is the number they trust least. Second, an ecommerce team that buys only an attribution tool learns that Facebook is or is not profitable, and learns nothing about what to make next. Both mistakes are common and both are avoidable by asking where the conversion lands before asking which tool is best.
How to Analyze Facebook Ad Performance, Step by Step
A tool shortens this process. It does not replace it. This is the loop, and it works the same whether you bought something or not.
Fix the naming convention first. Every tool on this page is downstream of your ad names. If concept, format, hook and iteration are not encoded somewhere consistent, even AI tagging will hand you clean data about a messy account. Do this before you buy anything.
Pick one decision metric and one guardrail. Usually ROAS or CPA as the decision metric, with CTR or hook rate as the guardrail that tells you where in the funnel a problem sits. Judging creative on four metrics at once produces a debate, not a decision. Our list of Facebook ads KPIs worth tracking covers the trade-offs.
Group before you rank. Rank concepts, angles and formats, not individual ads. A single ad's numbers are mostly noise. A group of eight ads sharing a hook style is a signal.
Wait for enough data, not enough time. The threshold is spend and conversions, not days. Borrow Meta's own bar: an ad set needs about 50 optimisation events a week to leave the learning phase, and a creative you cannot read at ad-set level is one you certainly cannot read at element level. So treat a creative as unread until it has cleared roughly 50 conversions, or three to five times your target CPA in spend if conversions are sparse. Below that you are reading variance. On a $200-a-day ad set at a $40 CPA, that is five to seven days, not the 48 hours most creative reviews actually run on.
Separate the fatigue question from the quality question. A creative that started at 3.0 ROAS and fell to 1.4 is a different problem from one that never worked. The first needs rotation or a refresh of the same concept. The second needs a new concept. Confusing the two is how teams kill winning angles. See why Meta ads die after three days for the learning-phase version of this trap.
Write down the pattern, not the winner. The output of a good review is a sentence like "question hooks under two seconds beat product openers on cold traffic", which briefs the next round. "Ad 4471 won" briefs nothing.
Check the pattern against your other channels. If a hook wins on Facebook and loses on TikTok, that is information about placement, not about the hook. This is the step that needs cross-network data, and the step most teams skip because they do not have it.
Costs These Tools Do Not Show on the Pricing Page
Published prices in this category are close to fiction once the account is live. Four costs recur.
Three vendors on this page publish nothing usable: VidMob and Adverity publish no price at all, and Singular does not attribute a price to Creative IQ. Assume an enterprise sales cycle and an annual commitment, and ask for the number in the first call rather than the third. One more trap sits the other way round: a published entry price that does not include the feature you came for, which is the Foreplay Lens case above.
Tools That Run Your Facebook Campaigns Rather Than Measure Them
Several products appear on Facebook analytics lists, including earlier versions of this one, that are really doing a different job. They are good tools. They belong in a different comparison, judged against their actual peers rather than against a reporting stack.
Campaign automation and account operations. Madgicx, Smartly.io, Revealbot and AdEspresso automate bids, budgets, audiences and bulk edits on Meta. Madgicx in particular is frequently listed as an analytics tool, and its account audits are genuinely useful, but every recommendation it makes rests on Meta's own platform-reported data, so it is an operations layer rather than an independent measurement layer. All four are compared in our guide to tools for testing and scaling Meta ads.
Creative production and generation. Bestever, now part of Samba, produces catalog and video ad creative at volume. It measures nothing. See AI ad generation tools.
Pre-launch prediction and structured testing. Extuitive scores creatives before they run, which is forecasting rather than analysis. It cannot tell you what happened, because nothing has happened yet. Compared with its peers in creative testing tools.
Organic social management. Sprout Social and similar platforms report on Pages, posts and engagement. That is a different dataset from paid creative performance and a different team's job.
MagicBrief is gone. It shut down on 31 July 2026 and the team joined Canva, where the equivalent functionality is now Canva Grow. It should not appear on any current shortlist, and it still does on several. If you were using it for creative reports, Motion or Superads is the closest replacement; if you were using it for competitor research and briefs, Foreplay is.
For the same comparison run across every network rather than Facebook alone, see ad reporting tools and ad creative analysis tools.
What to Ask on a Facebook Ads Analytics Demo
Six questions that separate the tools quickly, in the order worth asking them.
"Show me an element-level report on my own account, not the demo account." Tagging quality collapses on real creative in a way it never does on a vendor's showcase data.
"Which of my other data sources can you join to Meta, and at what level of granularity?" Campaign-level joins are easy and nearly useless. Creative-level joins are the whole point.
"What happens on the day a connector breaks?" Ask specifically whether it alerts you or silently serves stale numbers.
"How far back does history go on signup, and does that change on a paid plan?" A tool that starts collecting from day one cannot tell you anything for a month.
"What is the price at twice my current spend and twice my current creative volume?" Both are the usual banding triggers, and both are things you are actively trying to grow.
"What does this tool not do?" A vendor who cannot answer that has not thought about where they sit in a stack, which means you will find out yourself in month three.
Which Facebook Ads Analytics Tool Should You Start With?
Start from the sentence you cannot currently finish. If it is "our best Facebook ads all have this in common", you need creative intelligence and you should start there, because it is the only layer that changes what you make next rather than how you look at what you already made. If it is "Facebook is profitable at this spend level", you need attribution. If it is "here is last week's performance", you need reporting or a pipeline, and both are cheap.
For teams whose creative volume has outgrown manual review, and whose Facebook spend sits alongside Google, TikTok or the app networks, Segwise is where we would start. It tags every element of every creative, maps those tags to whichever metric your business runs on, warns you when a winner starts fading, and then generates the next round of creative from the patterns it found. The 7-day free trial backfills your history on signup, so the first useful report arrives the same day rather than next month.
Frequently Asked Questions about Facebook Ads Analytics Tools
What are the best Facebook ads analytics tools in 2026?
It depends on the layer you are missing. For creative-element intelligence, understanding which hooks, CTAs, visuals and audio drive performance, Segwise is the strongest option, covering 15+ ad networks and all five supported MMPs with multimodal AI tagging and playable ad support. For creative reporting on Meta and TikTok that a client will read, Motion leads at $750 a month. For the cheapest paid entry point, Superads is $125 a month with a 14-day trial, though it reports on creative rather than breaking it down by element. For attribution, Northbeam suits hands-on ecommerce buyers and Triple Whale suits Shopify founders who want profit next to spend. For the pipeline and reporting layers, Supermetrics from $37 a month and Whatagraph, now from EUR 699 a month billed annually, are the standards. Any page still quoting Whatagraph at around $229 is working from a retired tier.
How do I analyze Facebook ad performance?
Start by fixing your naming convention so concept, format and hook are encoded consistently, then pick one decision metric and one guardrail metric rather than judging creatives on four numbers at once. Group ads into concepts and rank the groups, not the individual ads, because a single ad's numbers are mostly variance. Wait until a creative has cleared roughly 50 conversions or three to five times your target CPA in spend before you read it as a result. Separate fatigue, a creative that used to work, from quality, a creative that never did, because the fixes are different. Then write down the pattern rather than the winner, and check it against your other channels. A tool such as Segwise automates the tagging and grouping in that loop, and its fatigue tracking handles step five for you.
Which analytics tools integrate with Facebook Ads?
Almost all of them, but at different depths. Pipeline tools integrate widest: Supermetrics connects Meta alongside 175+ sources, Coupler.io alongside 400+, and both land the data in Sheets, Looker Studio, Power BI or a warehouse. Creative tools integrate deepest, because they pull the assets as well as the numbers: Segwise connects Meta, Google, TikTok, Snapchat, Axon (AppLovin), Unity Ads, Mintegral, Moloco and Liftoff plus AppsFlyer, Adjust, Branch, Singular and Kochava, so a single creative can be read across every network it ran on. Motion and Superads both connect Meta, TikTok, YouTube and LinkedIn. The question worth asking a vendor is not whether they integrate with Facebook Ads, but at what granularity, since campaign-level joins are easy and creative-level joins are what actually change decisions.
What is the difference between Facebook ads reporting and Facebook ads analytics?
Reporting shows what happened: clicks, impressions, spend and ROAS inside Meta's attribution window. Analytics explains why it happened and what to change. Supermetrics, Whatagraph and DashThis are reporting: they move and present platform data efficiently and add no interpretation. Segwise, Motion and Superads are analytics: they identify which creative elements are responsible for performance and, in Segwise's case, flag which creatives are approaching fatigue. Both have value, but buying reporting when your problem is analytics gets you faster access to the same unanswered question.
Can I get Facebook Ads and Google Analytics data into one report?
Yes, and this is the cheapest problem on this page to solve. Supermetrics from $37 a month and Coupler.io from $24 a month both pull Meta Ads and GA4 on a schedule into Google Sheets, Looker Studio, Power BI or BigQuery, where you can blend them. Whatagraph and DashThis do the same with less flexibility and a nicer output for clients. What none of them do is reconcile the two: Meta and GA4 count conversions differently, and a blended dashboard makes the disagreement more visible rather than resolving it. If the disagreement itself is your problem, that is an attribution question, and Northbeam, Triple Whale or SegmentStream are the relevant tools.
How do I detect creative fatigue on Facebook ads automatically?
Manual detection means noticing a ROAS drop in Ads Manager, by which point the budget is spent. Segwise monitors every creative continuously for decline patterns across networks and alerts you before performance falls off, with thresholds you define yourself, for example a 20% ROAS decline over seven days or a 30% drop in CTR. You can also set success criteria for brand-new creatives, so you find out quickly whether a test cleared the bar. Most of the other tools on this page will show you fatigue after the fact if you look for it, which is a different product from being told.
What is the best Facebook ads analytics tool for mobile gaming?
Segwise. It AI-tags what happens inside playable and interactive ads, which matters because playables are often a meaningful share of a games team's Facebook and app-network spend and the other tools on this page do not document reading inside them. It also connects the networks games teams actually buy on, Axon (AppLovin), Unity Ads and Mintegral alongside Meta, Google and TikTok, plus all five supported MMPs, so creative performance can be read against installs, D7 ROAS or retention rather than platform-reported clicks. Singular Creative IQ is the alternative worth evaluating if Singular is already your MMP and you would rather not add a vendor.
What is the best Facebook ads analytics tool for a Shopify DTC brand?
It depends which question is blocking you. If it is whether Facebook is profitable, Triple Whale connects the store in under an hour and puts CAC, margin and LTV next to spend. If a media buyer needs to know which specific asset produced the revenue, Northbeam attributes at asset level with per-channel attribution windows. If you already know Facebook works and need to know what to make more of, neither answers that, and Segwise or Motion is the layer you are missing. Many DTC teams end up running one creative tool and one attribution tool, because the two answer different questions on the same spend.
How do I find which products are dragging down a Meta catalog campaign?
Meta's own reporting will break a catalog campaign down by product set but not usefully by individual SKU against margin, which is where the answer usually sits. The practical route is a pipeline: pull Meta Ads data at ad and product level through Supermetrics, Coupler.io or Funnel.io, join it to your store's cost and margin data, and rank SKUs by contribution rather than by ROAS. Triple Whale gets partway there natively on Shopify by holding margin alongside spend. Where the problem turns out to be the creative treatment of a product rather than the product's economics, a creative layer such as Segwise will tell you which product shots and framings are underperforming across the catalog.
Which tool should I use to analyze Facebook video ad performance?
For video specifically, you want a tool that reads inside the file rather than reporting on it. Segwise tags video frames and pacing, spoken dialogue, audio tone and music, on-screen text and characters, then maps each of those to your performance metrics, so you can compare hook styles and scene structures rather than video IDs. Motion adds hook rate and hold rate next to each thumbnail, which is the fastest way to see where in a video viewers leave. VidMob is the option for brand advertisers who want video scored against category best practice. Superads covers the basics from $125 a month, with a 14-day trial, if your video volume is modest.
Do I need a separate attribution tool alongside a creative analytics tool?
Often yes, because they answer different questions on the same spend. Creative analytics tells you which elements inside your ads drive performance within the data the networks and your MMP report. Attribution tells you whether those conversions were incremental and how Facebook compares with your other channels. If Facebook is your only meaningful channel, creative analytics alone is usually enough to start with, and it is the layer that changes what you produce. Once you are spending across three or more channels, or once Meta's number and your store's number diverge enough to change budget decisions, add the attribution layer.