Facebook Ads KPIs Every Creative Strategist Should Track
Key Takeaways:
KPIs show if your ad truly works from attention to revenue. They help you measure whether people notice, click, convert, and generate real business results.
Creative quality directly affects cost and scaling. Strong creatives reduce CPA or CPI and win more placements; weak creatives quickly increase costs.
Always evaluate the full performance journey. A high CTR means little if conversion rate or retention drops, connect attention, action, and long-term value.
Creative-level KPIs reveal the real problem faster. Metrics like 2-second views, watch time, CTR, and conversion rate show exactly where performance breaks down.
Structured testing leads to predictable growth. Test one change at a time, confirm downstream metrics like ROAS and retention stay healthy, then scale gradually.
Are you tracking the right Facebook Ads KPIs, or just the easy ones?
You check CTR, see installs coming in, and assume the creative is doing its job. Then costs rise, growth slows, or user quality drops. At this point, the issue is rarely traffic alone. It’s usually that the wrong performance signals are driving your decisions.
Meta’s ranking system now leans heavily on predicted engagement and conversion behavior. After late-2025 AI updates, the platform reported a 7% lift in feed and video views, with video time spent in the U.S. up by double digits. Small creative differences now influence delivery and cost faster than before.
If you aren’t measuring attention, engagement, conversion, and downstream value together, you can end up scaling weak ads or cutting strong ones too early.
In this blog, we'll break down the Facebook Ads KPIs that actually reveal creative performance, explain how to read them in context, and outline a simple way to test and scale with confidence.
What are Facebook Ads KPIs?
Facebook Ads KPIs are the measurable numbers that show how your ads perform inside Ads Manager. They tell you whether your creative is getting attention, driving action, and doing so at a reasonable cost.
You will see four main groups:
Delivery metrics: Reach and impressions show how many people saw the ad and how often it appeared.
Efficiency metrics: Cost per click, cost per result, and cost per install show how expensive each action is.
Performance metrics: Click-through rate and conversion rate show if people move from seeing to acting.
Creative signals: Video views, average watch time, engagement, and Meta’s ad relevance diagnostics (quality, engagement rate, conversion rate rankings) provide comparative signals versus competing ads shown to the same audience.
Meta compares your ad with other ads shown to the same audience using three rankings: quality, engagement rate, and conversion rate. If those rankings drop, the platform predicts lower value, and delivery costs usually increase.
In simple terms, KPIs answer three practical questions
Are people noticing the ad?
Are they interested enough to click or watch?
Are they completing the action after they land?
Think of KPIs as your creative feedback system. They turn opinions about an ad into evidence you can act on.
Why They Matter?
KPIs matter because creative directly affects cost and scale. Meta’s auction weighs bid, estimated action rate, and ad quality. Creatives predicted to drive stronger engagement and conversions typically receive more efficient delivery. Strong creative does not just improve engagement. It improves delivery efficiency.
Here is what they help you control:
Spend efficiency: If the cost per result rises, the issue is usually weak messaging, an incorrect hook, or a poor audience match. Improving the creative often lowers acquisition cost faster than changing targeting.
Early warning signals: Click-through rate and video watch time show problems before conversions drop. When people scroll past quickly, the algorithm also reduces delivery.
Scaling decisions: When a creative keeps stable CTR, conversion rate, and cost per result as spend increases, it is safe to scale. When those numbers fall, you have hit creative fatigue.
Tracking reliability: Privacy changes reduced the visibility of data. Using pixel- and server-side conversion tracking improves signal quality, so your KPIs reflect real performance rather than partial data.
Real impact measurement: Likes and comments alone do not equal business results. KPIs such as conversion rate, installs, purchases, and qualified leads indicate whether the ad actually drives incremental outcomes.
In short, KPIs connect creative choices to business results. Instead of guessing which ad is good, you can identify which idea deserves more budget and which one needs a new concept.
Also Read: Winning on Meta: The Best Tools for Testing and Scaling Ads
Why You Need Your Own Facebook Ads KPIs
When you rely on overall campaign metrics alone, lights can flicker on and off without showing why. Creative-specific KPIs let you separate creative performance from audience, bid, or attribution noise. That helps you answer questions like: Did the video actually stop people? Did the message match the landing experience? Is it time to refresh the creative before performance drops?
Platform-level diagnostics are useful, but they’re designed for broad diagnostics; you still need creative-level signals to make better art and faster decisions. Tracking creative-focused KPIs helps you prevent wasted spend and speeds up the path from an idea to a measurable lift.
With that foundation in place, let’s look at the specific metrics that reveal whether a creative is truly doing its job.
Also Read: How to Use Facebook Ad Library for Smarter Ad Strategies
The Facebook Ads KPIs That Actually Tell You If a Creative Works
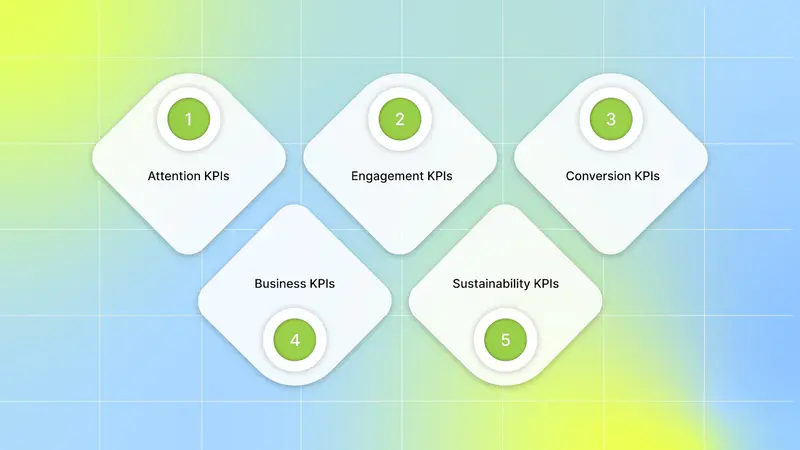
To evaluate whether a creative truly works, you need to follow the journey from first impression to long-term value. Each KPI category answers a different stage of that journey. It starts with the simplest question: Did the creative earn even a moment of attention?
1. Attention KPIs (Did the creative stop the scroll?)
Thumb stop rate / 2-second video views:
How many people saw and stayed for at least ~2 seconds of your video (a quick “did you stop?” signal).
Good signal for creative: A 2-second view rate above baseline. This shows your first frame or motion pulled people in. For very short reels/placements, anything noticeably above your past ads is a win.
Benchmarks & caveats: Meta defines 2-second plays as a billing/performance option, but there’s no universal “good” number compared to your own past ads and similar placements (Reels vs Feed behave differently).
If 2-second views rise but conversions don’t, the creative is good at stopping the scroll but not at setting expectations; try tightening the opening promise or aligning the CTA and landing page. If both 2-second views and CPI improve, scale that creative.
Video watch % (short videos <2 min, avg view):
How far people watch your video (25%, 50%, 75%, 100% or average watch time).
Good signal for creative: Strong early retention (25–50%) shows a tight hook; good mid/late retention (50–100%) shows storytelling that keeps attention. Aim to see where the biggest drop happens and fix that second.
Benchmarks & caveats: For short-form creatives (6–15s), strong ads often retain a majority of viewers through the first half. Always benchmark against your own historical performance and placement norms. Aim ~50–70% average view for short-form creatives.
If early retention and conversion rate are high, you have a fast, funnel-friendly creative, scale it. If early retention is high but conversions lag, test CTA clarity or landing alignment. Use retention curves to decide where to tighten your edit.
Click-Through Rate (CTR):
% of impressions that turn into clicks (how often people act after seeing the creative).
Good signal for creative: CTR above your historical creative average and above industry norms shows the ad got interest. For traffic campaigns, recent benchmarks show average CTRs around the 1%–1.7% range across industries, but this varies widely by vertical and objective.
Benchmarks & caveats: CTR varies by objective, placement, and ad format; always compare by campaign objective (traffic vs. conversions) and by placement (Reels CTR often differs from Feed CTR).
Higher CTR with a stable conversion rate lowers CPI; if CTR is high but conversion rate is low, the creative may be misleading, or the landing page may not align with the expectation set. If CTR is low but the conversion rate is high, the creative may be niche and needs broader testing to scale.
Capturing attention is the first hurdle. The next question is whether that attention turns into meaningful interaction.
2. Engagement KPIs (Did the message connect?)
Link clicks and unique link clicks:
How many people clicked the link (total) and how many unique users clicked (unique).
Good signal for creative: A healthy share of unique clicks versus duplicate clicks means your creative reached many people, not a few repeat clickers. That’s a positive sign for reach and message clarity.
The more unique link clicks at a similar CPI signal, the more you can scale and reach more new users efficiently. If unique clicks fall while total clicks rise, watch for low-quality repeat engagement.
Engagement rate (comments, shares, saves):
How people react with social actions like comments, shares, saves, and reactions.
Good signal for creative: meaningful comments or shares imply the creative struck a chord and can drive organic reach. High save rates indicate users want to revisit the experience.
High engagement can reduce CPMs and help with delivery; use engaged audiences in lookalike or retargeting pools. But don’t chase vanity; only scale engagement that correlates with conversion lift.
Quality ranking & relevance diagnostics (quality, engagement, conversion):
Meta’s internal signals compare your ad to others competing for the same audience. It flags perceived quality, expected engagement, and expected conversion performance.
Good signal for creative: “Above average” rankings mean your creative is resonating compared to peers. “Below average” points to creative or message problems.
Benchmarks & caveats: These are comparative diagnostics, not absolute truths. They’re best used as early warnings, not final judgment calls.
A low-quality or engagement ranking often predicts rising CPMs and lower ROAS; refresh the creative, change the messaging, or adjust the audience. Use the diagnostics to prioritize which ads to stop or refresh.
Interaction shows interest. What matters next is whether that interest translates into action.
3. Conversion KPIs (Did the creative set correct expectations?)
Conversion rate:
% of clicks that complete the desired action (install, sign-up, purchase).
Good signal for creative: a conversion rate that’s stable or improving against your baseline shows the creative set clear expectations for what happens after the click.
Benchmarks & caveats: Conversion rate varies widely by vertical and funnel stage; compare against your own historical baselines rather than industry medians.
Improving conversion rate reduces CPI and increases ROAS. If the conversion rate falls while the CTR rises, the creative is probably overpromising; change the landing message or the creative’s promise.
Cost per install (CPI) / Cost per acquisition (CPA):
How much do you pay for a new user or desired action?
Good signal for creative: lower CPI/CPA than your historical numbers and target LTV indicate creatives are efficient at both attracting and converting.
Benchmarks & caveats: CPI varies significantly by region, platform (iOS vs Android), and vertical. Always evaluate CPI relative to your LTV and historical targets.
Use CPI changes to decide whether to scale or pause a creative. If a creative reduces CPI while maintaining quality (retention/ROAS), it’s a scale candidate.
Cost per lead (CPL)
How much do you pay for a qualified lead (form fill, sign-up)?
Good signal for creative: CPL at or below your target while maintaining high lead quality.
Benchmarks & caveats: Median ~$27.66 (Facebook leads campaigns, 2025).
Lower CPL with high lead quality suggests creative + funnel alignment; if CPL is low but lead quality is poor, focus creative on qualifying signals (clearer CTAs, qualifying language).
Conversions indicate immediate results. To judge long-term value, you need to connect those results to revenue and user quality.
4. Business KPIs (Was the user valuable?)
ROAS (Return on Ad Spend):
Revenue (or value) generated per dollar spent on ads.
Good signal for creative: ROAS that meets or exceeds your target LTV-based goal, meaning the creative not only attracted users but the right users.
Scale creative with strong ROAS. If an ad has a high CPI but a low ROAS, the creative might attract low-value users; test creative targeting or messaging to attract higher-intent users.
Value per install (or average order value from ad cohorts):
The average revenue or value associated with users from a specific creative.
Good signal for creative: higher value per install indicates the creative is attracting better users.
Benchmarks & caveats: 14-day ARPU varies significantly by vertical (e.g., casual gaming vs subscription apps). Use your cohort benchmarks rather than cross-industry medians.
Prioritize creatives with higher value per install; even if their CPI is slightly higher, they can deliver better LTV and long-term ROAS.
Early retention (Day 1, Day 7 retention):
Percentage of new users that remain active 1 and 7 days after install.
Good signal for creative: strong Day 1 and Day 7 retention; this implies the creative promised something that the app actually delivered.
Creatives that deliver higher early retention are worth higher CPI bids and scaling. If retention falls, adjust the creative to better align with the product experience.
Even strong performance can fade. Monitoring durability helps you know when momentum is holding and when it’s slipping.
5. Sustainability KPIs (When to refresh creatives)
Frequency:
Average times an ad is shown to each person.
Good signal for creative: low to moderate frequency with stable CTR and CPM. If frequency rises while CTR drops and CPM rises, the creative is tiring.
Set refresh frequency thresholds (Monitor for rising frequency paired with falling engagement. Acceptable thresholds vary by funnel stage (prospecting vs retargeting)). If signs of fatigue appear, rotate new creative. Industry practitioners recommend watching for frequency increases paired with falling engagement as a red flag.
Declining CTR over time:
Drop in ad click rate compared to the initial period.
Good signal for creative: CTR should hold for a reasonable time; consistent decline indicates the creative is stale. If CTR drops by ~20% (or more) from its recent baseline, consider fatigue and refresh.
When CTR steadily declines, test new thumbnails, hooks, or formats. Pair replacements with small-scale A/B tests to confirm improvements before large-scale swaps.
Rising CPM (cost to show the ad):
How much do you pay to show the ad to people (impressions cost)?
Good signal for creative: stable or falling CPM; rising CPM while conversions don't improve is a signal to refresh creative or audience.
Rising CPM + flat conversions = rising cost per result. Either refresh the creative, tighten the audience, or pause and re-evaluate the creative fit. Use ad relevance diagnostics to help diagnose the issue.
Once you know what to track, the next challenge is reading those numbers correctly.
Also Read: The 7 Best Facebook Ads Analytics Tools for Performance Marketers in 2025
How to Read the Results Without Misinterpreting Data
Numbers guide your decisions. But if you read them out of context, they can push you in the wrong direction. Before you change creative or increase the budget, slow down and check these five things.
1. Keep Attribution Settings Consistent
If you compare campaigns using different attribution windows, your results won’t line up. A 7-day click window will report differently from a 1-day click window. For app campaigns, ensure you distinguish between SKAN-reported results and modeled/aggregated event measurement results, as these may follow different timing and reporting logic.
Use the same:
Attribution window
Conversion date setting
Reporting time frame
Only then compare performance.
2. Give Conversions Time to Show Up
Clicks happen fast. Purchases and installs may not. Meta reports conversions within a defined window, so results can appear hours or days later. If you judge performance too early, you risk pausing a creative that would have worked. Wait until enough time has passed for your typical conversion cycle before making a call.
3. Compare Similar Placements and Objectives
A Reels ad will behave differently from a Feed ad. A traffic campaign will show higher CTR than a conversion campaign.
When you review results:
Compare traffic ads with traffic ads
Compare conversion ads with conversion ads
Separate placements when needed
This keeps you from drawing false conclusions.
4. Don’t Trust Tiny Sample Sizes
If one ad has 800 impressions and another has 40,000, the smaller one can swing wildly.
Before you declare a winner:
Make sure you have enough impressions or clicks
Look for stable trends over several days
Avoid judging based on one spike
Small data exaggerates performance.
5. Pair Costs With Behavior Metrics
Cost per result alone doesn’t tell you much.
Always look at:
CTR
Conversion rate
ROAS
Retention
Example:
If CPA drops but retention falls, you may be attracting low-value users. If CTR rises but conversion rate drops, the creative may be overpromising.
Layered metrics help you avoid reacting too quickly.
6. Use Incrementality When You Need Real Proof
Attribution models estimate credit. They don’t prove causation. When performance decisions are large, use Meta Conversion Lift tests, geo holdouts, or controlled audience experiments when evaluating major creative shifts. That tells you whether your creative actually drove new results or just captured existing demand.
When you read KPIs with aligned settings, enough data, and layered context, you stop reacting emotionally and start acting strategically. That’s when creative decisions become smarter and more confident.
Looking for a way to unify creative-level data from Meta, TikTok, Google, and beyond into consistent reporting?
Segwise automatically pulls ad performance and MMP data from 15+ platforms into a single dashboard, tags every creative element (hooks, visuals, CTAs, audio, dialogue), and maps those tags to KPIs like CTR, installs, CPA, and ROAS. It also builds custom dashboards and automated reports so you can compare performance across networks and detect creative fatigue early without manual aggregation.
Turning KPI Insights Into Better Creatives
Now let’s turn insight into action. The goal isn’t to collect metrics. The goal is to use them to improve creative in a repeatable way. Here’s a tighter process you can rely on:
Step 1: Diagnose One Problem at a Time
Choose the weakest signal:
Low 2-second views → attention problem
Good watch time but low CTR → unclear benefit
High CTR but low conversion rate → misalignment
Good CPI but weak retention → wrong audience promise
Focus on one issue per test.
Step 2: Write a Clear Hypothesis
Keep it simple:
“If we change ___, then ___ will improve.”
Example:
If we show the product in the first second, the 2-second view rate will increase, and CTR will improve.
One hypothesis. One change.
Step 3: Test One Variable
Change only:
Hook
Opening frame
Headline
CTA
Length
Visual style
Avoid changing everything at once. Clean tests give clean answers.
Step 4: Define a Real Winner
A winning creative should:
Improve the primary KPI
Not hurt downstream performance
Example:
If CTR rises by 20% but the conversion rate drops by 25%, that’s not a real win.
Protect business metrics while improving creative metrics.
Step 5: Scale Gradually
When you find a winner:
Increase the budget in controlled steps
Monitor CPA and ROAS
Watch frequency and CTR
If performance holds steady, continue scaling. If it drops, revisit alignment or refresh visuals.
Step 6: Build a Creative Pattern Library
Track:
Hook style
Angle
Length
Format
Result
Over time, patterns appear. You’ll see what consistently drives attention, clicks, and value. That shortens future testing cycles and improves hit rate.
Step 7: Refresh Before Fatigue Hits
If frequency climbs and CTR steadily declines, introduce variations:
New visual, same message
Same angle, new hook
Same script, different format
Refresh the execution before reinventing the idea.
When you follow this system, Facebook Ads KPIs stop feeling like random numbers. They become clear instructions for what to fix, what to test, and what to scale next.
Want a quick way to link specific creative elements to real performance?
Segwise tags hooks, scenes, audio, and CTAs and maps those tags to performance across 15+ ad networks, helping spot early fatigue and identify which creative elements move ROAS.
Also Read: How to Combat Creative Fatigue with AI Solutions
Final Thoughts
Facebook Ads KPIs give creative strategists a clear decision framework from first impression to long-term value. When you connect attention, engagement, conversion, and revenue metrics in sequence, you can diagnose the real constraint, test one focused hypothesis, and scale only what protects downstream performance. With consistent attribution, sufficient data, and fatigue monitoring, these signals become a disciplined system for improving creative output and spend efficiency over time.
But how do you turn scattered KPI data into a structured creative strategy and faster iteration? Segwise is an AI-powered creative intelligence platform that applies multimodal creative tagging across video, image, audio, and playable ads, connects those tags directly to performance data, and visualizes insights inside a unified analytics dashboard. With automated fatigue detection, creative-level performance breakdowns, and AI-generated briefs and variations informed by historical performance patterns, strategists can move from insight to execution with clarity.
Start a Free Trial to see how KPI-driven creative analytics can translate directly into smarter briefs and stronger creative performance.
