Top Creative Analytics Tools for Successful Ad Campaigns 2026
TL;DR
Select a vendor that aligns with your team's workflow, not the one with the most impressive dashboard.
Plan a short internal rollout to ensure creatives and analysts speak the same tagging language and utilize the outputs effectively.
Use the tool to generate hypotheses, then validate those with real tests tied to your business metrics.
Expect some engineering or ops work if you want raw exports or to join tool data with lifetime value.
Negotiate trials and clear SLAs (data access, uptime, support) before committing to an extended contract.
You run ads but find it hard to identify which element of the ad works best. This makes it challenging to identify top performers and can result in wasting your budget on underperforming assets.
You might end up pausing the wrong ads, keeping low-performing ones, or spending hours testing ideas that don’t drive results. Manual checks are ineffective when you have a large number of creatives or tight deadlines.
Top creative analytics tools link each ad creative to real campaign data, so you can see what drives clicks, installs, or purchases. Many of these tools automatically tag images, video scenes, and text, pulling data from ad platforms to provide a single, clear view.
In this blog, you’ll find a simple list of the top creative analytics tools for 2025, a brief explanation of what each tool excels at, and a checklist to help you choose the best one for your ads.
What are Creative Analytics Tools?
Creative analytics tools link ad creatives (images, video, copy) to performance data, revealing what drives results. These tools shift analysis from guesses to measurable insights about visuals, messaging, and formats. They help identify which elements drive clicks, installs, purchases, or other key goals, enabling fast changes, testing, and spending on effective ads.
Platforms now connect directly to ad networks and measurement partners, ensuring alignment between creative and campaign metrics.
Key Benefits
Make data-driven creative decisions by identifying which visuals or lines perform best, allowing you to swap or rework weaker assets.
Faster iterations and near-real-time signals enable you to test and replace assets during a live campaign, allowing for seamless updates.
Cross-channel visibility, one platform displays creative performance across networks, enabling fair channel comparisons.
Also Read: How to Create Ads That Stop the Scroll: Top Tips for Success in 2025
Key Features of Top Creative Analytics Tools
Each feature listed below is common on leading platforms as of 2025. A short note on why it matters is included.
Unified dashboard for multi-network data: Your ad accounts and measurement partners feed into one view so that you can compare apples to apples. This reduces manual joins and reporting errors.
AI-powered tagging and breakdowns: Automated image/text tagging, scene detection, and element-level scoring enable the system to group creatives by features (e.g., product close-up, smiling person, CTA text). That speeds up analysis at scale. Vendors introduced dedicated AI agents to auto-tag and score assets in 2025.
Customizable visual reports and dashboards: build simple scorecards and visual charts that map creative features to KPIs so stakeholders can act without digging into raw tables.
Automated insights and recommendations: systems flag top and low-performing elements and suggest tests or reallocation steps so you don’t miss quick wins.
Scalability and integration: Look for a tool that connects to major ad platforms, MMPs, and asset libraries, allowing it to handle hundreds or thousands of creatives without requiring manual tagging.
How Creative Analytics Works: Step by Step
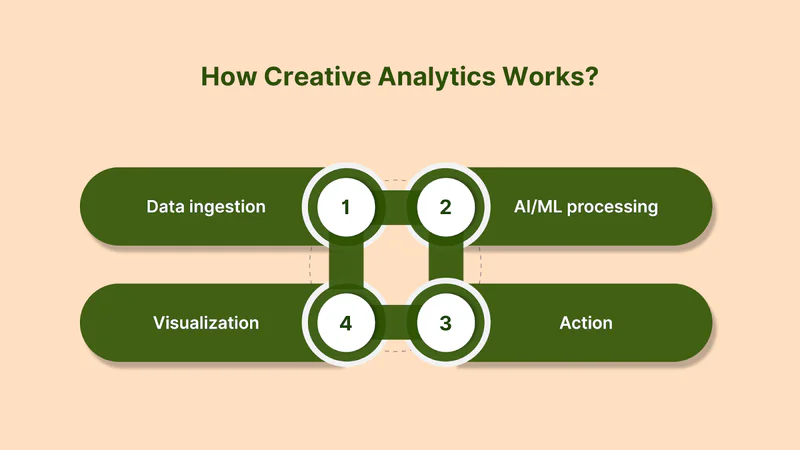
Data ingestion: the tool pulls creative assets, campaign metadata, spend, impressions, clicks, and conversions from ad platforms and measurement partners. That gives a single data record for each creative.
AI/ML processing: models tag images and video frames, extract text and voice lines, and cluster similar assets. They then run performance models to estimate which elements correlate with the KPI you care about. This is where automated tagging and clustering happen.
Visualization: dashboards and tables show element-level performance, trend lines, and top/bottom creatives. Filters let you slice by country, placement, audience, or creative trait.
Action: you use those signals to edit creatives, launch A/B tests, or move budget toward winning formats and audiences. The best tools provide clear suggestions and allow you to track the results of the changes.
Also Read: AI in Mobile Game Marketing and Advertisement: Key Stats & Insights
Quick checklist when you evaluate tools in 2025
Can it connect directly to your ad accounts and your MMP?
Does it auto-tag elements and let you override tags?
Are reports easy to share with non-technical people?
Can it handle the number of creatives you run weekly?
Use the capability list and checklist above to compare options. Select a tool that provides clear, element-level signals and enables fast actions, allowing you to test smarter and scale what works.
With the criteria in mind, here’s a closer look at the leading platforms that meet these standards.
Top 5 Creative Analytics Tools in 2025
Top creative analytics tools in 2025 help mobile marketers move beyond surface-level reporting and understand exactly which creative elements drive installs, revenue, and ROAS. These platforms combine AI-powered tagging, visual reporting, and cross-network data to enable faster, smarter optimization decisions.
Here are the top tools in 2025 that can help you scale winning creatives with confidence:
1. Segwise

Segwise is an AI-powered creative intelligence platform that helps mobile game studios, DTC brands, subscription apps, and performance marketing agencies optimize the performance of their advertising creatives.
Unlike traditional analytics tools that focus on campaign metrics, Segwise provides creative-level intelligence, helping teams understand exactly which creative elements (hooks, CTAs, characters, visual styles, emotions, audio components) drive performance and which don't. This enables data-driven creative decisions that save time, reduce wasted ad spend, and accelerate creative iteration cycles.
Key features
One Place for All Your Creative Data: Stop jumping between Facebook Ads Manager, Google Ads, TikTok, and your MMP dashboard. See creative-level ROAS, CPA, LTV, and conversion rates from all sources in one unified view.
Tag-Level Creative Element Mapping: You can see which specific creative elements drive performance. Discover patterns like "this hook dialog appears in 80% of top-performing creatives" with complete MMP attribution integration.
Custom Dashboards and Reporting: You can build dashboards around your specific KPIs and stakeholder needs. Create automated reports that show how creative decisions impact ROAS across all your apps and campaigns.
Multi-Project Management: Studio View enables creative analytics across multiple apps, games, or brands from one unified interface.
Creative Tagging: Its multi-modal AI automatically identifies and tags creative elements like hook dialogues, characters, colors, and audio components across images, videos, text, and playable ads to reveal their impact on performance metrics like IPM, CTR, and ROAS.
How you’d use it
If you run ad creative or oversee ad buys, you can use Segwise to stop guessing which creative pieces work. Upload your creative library or connect your ad accounts, let the AI tag every asset, and then open a dashboard to see which hooks, characters, or formats correlate with better cost-per-install or conversion rates. That helps you brief creative teams with concrete tags instead of vague opinions.
Set up, integrations, and data safety
Segwise promotes no-code integrations across standard ad and analytics sources, which means you can usually connect without engineering work. The company also advertises SOC-level certification for data protection and offers a 14-day free trial with no credit card required.
Strengths that push it into the top 5
Fast tagging that cuts manual work and speeds iteration.
Multimodal tagging (visual, audio, text) makes it useful for video-first ads.
Dashboards are designed to map creative elements directly to ROAS signals, so you can prioritize tests that matter.
Known caveats
Competitor creative tracking is marked as 'coming soon' on the site. If this feature is a dealbreaker for you, please confirm its live status before making a decision.
As with any AI tagging system, validate a sample of tags against your own taxonomy before fully automating decisions.
Segwise is a strong pick if you want faster, AI-driven tagging and clearer links from creative elements to performance.
2. MagicBrief
MagicBrief is a creative analytics and research platform that helps teams understand which ads are working and why. It connects ad performance data to visual reporting and competitive insights, making it easier for media and creative teams to align on winning formats.
Key features
Prebuilt creative reports: Save time with reports that instantly turn your data into actionable insights.
All your data in one place: Sync Meta, TikTok, Youtube and LinkedIn to see what works.
Identify winning ad traits: Compare the performance of different formats, creators, angles, and more.
AI competitor summaries: Get summaries of competitor activity so you can stay one step ahead.
How you’d use it
Connect your ad accounts and review dashboards to see which creatives perform best. Use competitive insights and reporting to generate new briefs and test updated concepts.
Set up, integrations, and data notes
MagicBrief connects to major paid social platforms to sync creative and performance data into visual reports. Setup is typically self-serve for standard ad accounts, though deeper integrations or higher usage limits depend on plan tier. Teams should confirm supported ad networks and data retention limits during evaluation.
Strengths that push it into the top 5
Strong bridge between creative and media teams.
Excellent competitive inspiration database.
Fast visual reporting.
Known caveats
More focused on reporting and inspiration than deep element-level AI scoring.
Advanced analytics depth depends on the plan tier.
MagicBrief is ideal when you want structured creative reporting and competitor inspiration without building a custom analytics stack.
3. Madgicx

Madgicx is an AI-powered ad optimization and automation platform built primarily for Meta advertisers. It combines creative insights, budget automation, and performance tracking to help teams scale campaigns more efficiently.
Key features
Meta Audit: Madgicx provides a comprehensive audit of your Meta ad account, uncovering hidden inefficiencies and blind spots you can’t easily find inside Ads Manager.
Cross-Channel Reporting: Get reporting from Meta, Google Ads, Google Analytics, TikTok, and Shopify in a single centralized dashboard for clearer performance comparisons.
Creative performance insights: Analyzes which creatives drive engagement and conversions inside Meta campaigns.
Automated budget optimization: AI adjusts budget allocation across campaigns to improve ROAS.
How you’d use it
Connect your Meta ad account, let Madgicx analyze performance data, and use its recommendations to scale top-performing ads and pause weaker ones.
Set up, integrations, and notes on access
Madgicx primarily integrates with Meta Ads Manager and related tracking environments. Setup is generally no-code for Meta advertisers, but deeper tracking or attribution configurations may require additional setup. Since the platform is Meta-centric, teams running multi-network campaigns should confirm cross-platform data coverage before adopting.
Strengths that put it in the Top 5
Strong Meta-focused automation.
Helpful for budget allocation decisions.
Combines creative + audience optimization.
Known caveats
Primarily focused on Meta advertising rather than full cross-network creative intelligence.
Does not provide deep multimodal tagging across playable formats.
Madgicx is a fit when you want Meta-centric automation combined with creative performance insights.
4. Singular (Creative IQ)

Singular creative IQ links every creative element to real ROI across channels using AI tagging and automatic clustering, so you can see what works at a glance and act on it.
Key features
AI-powered tagging: Out-of-the-box tags automatically label visuals, text, characters, audio cues, and more. Singular ships 17 standard tags to speed setup.
Creative Gallery: A side-by-side visual library that shows each creative next to performance metrics like ROI, installs, and impressions.
Automatic clustering: The product groups similar creatives (by image, text, or tags) so you can find winning patterns without manual sorting.
Slice-and-dice reporting: Filter by audience, theme, format, or campaign to compare the exact creative elements you care about.
Accurate ROI view: Creative metrics are tied back to revenue and installs, so your decisions align with business outcomes, not just surface-level statistics.
How you’d use it
Connect your ad accounts and let Creative IQ import your ads and performance data. Then, open the gallery, select a creative cluster, and you’ll see which elements (headline, visual, emotion, or format) impact your KPIs. Use that view to create short tests or to brief designers with the exact changes that data shows work best.
Set up, integrations, and data notes
Singular builds Creative IQ on top of its attribution and measurement stack, so it works across platforms you already use. The setup is designed to be low-code, allowing users to connect accounts, map KPIs, and have the system automatically begin tagging and clustering. If you require strict privacy or compliance details, please review their documentation or request a security brief during the evaluation process.
Strengths that push it into the top 5
Fast, reliable tagging and ready-made tags cut manual work.
Visual gallery makes cross-channel comparisons simple.
A direct tie between creative assets and ROI reduces wasted spend by showing what truly scales.
Known caveats
Any automated tag system requires a short validation period to ensure that tags and your internal naming align.
If you rely on highly customized creative formats, check whether the default tags meet your needs or if custom tags are required.
If you want quick, visual answers about which creative elements drive real business results, Creative IQ is built to give you that view and help you act fast.
5. AppsFlyer (Creative Optimization)

AppsFlyer’s Creative Optimization is an AI-driven solution that analyzes creative-level attribution data, breaks creatives into scenes and elements, and highlights which combinations lift performance and ROI. It combines dashboards, element analysis, and exportable ETL reports, allowing you to act from both product and data teams.
Key features
Detailed creative-level reporting: Full asset-level metrics from upper to lower funnel so you see how each creative performs across touchpoints.
Creative Packs: Testable bundles for end-card and creative combos that help you experiment with how assets work together.
Scene- and element-level analysis: The platform parses videos and images into scenes and tags elements (text, objects, emotion) for element-level performance scoring.
Automatic or custom tagging rules: Use built-in tagging and add rules to match your taxonomy.
Creative level ETL for BI: Export raw creative performance and attribution data to cloud storage or warehouses (AWS, GCS, BigQuery, Snowflake) for deeper analysis.
How you’d use it
You connect your ad partners and let AppsFlyer import creatives and performance data. Open the Creative Optimization dashboard to spot top-performing scenes, or pull ETL exports into your BI tool to join creative signals with lifetime value and cohort data. Use Creative Packs to run structured tests on combinations, such as end-card + hook, to see what scales.
Set up, integrations, and data handling
AppsFlyer supports partner integrations that automatically import creatives from supported partners, reducing the need for manual uploads. If you want the raw data, use the Creative Optimization ETL (Data Locker) to send reports to AppsFlyer-owned or your own cloud storage and then load them into your warehouse. The docs describe destinations including AWS, GCS, BigQuery, and Snowflake.
Strengths that put it in the top 5
Strong linkage between creative elements and attribution data so that you can move from creative signal to business metric.
Built for scale: large advertisers can feed many creatives and export complete ETL reports for custom BI.
Backed by a 2025 creative report that analyzed 1.1M creative variations and $2.4B in ad spend, giving you data-driven benchmarks to compare against.
Known caveats
You’ll get the most value if you can combine the platform signals with your own LTV or retention data in a warehouse. The ETL flow is designed for that, but it requires BI or analytics work.
Some partner integrations are marked premium; confirm which ad partners are continuously synced for your account during evaluation.
AppsFlyer is a fit when you want creative-level measurement that links directly to attribution, and when your team can act on exported data or use the built-in dashboards to identify winning creative combinations.
Each of these tools brings a unique AI-powered angle to dissecting and optimizing your creatives. Select the one whose integration, depth of insight, and user fit align best with your team’s workflow.
How to Select the Right Creative Analytics Tool

Select a tool that meets your current needs and can also support your campaign's growth. Here are straightforward steps you can follow:
Set clear goals & metrics: One or two targets (e.g., lift installs, improve video CTR) and the KPIs that prove progress (impressions, VTR, installs, retention).
Check integrations: Look for native connectors or APIs for Google Ads, Meta, TikTok, MMPs, and your BI. Verify how creative assets and asset IDs are imported.
Compare attribution & accuracy: Know the vendor’s attribution model, lookback windows, and cross-device handling. Ask if raw events or exports are available to reconcile with GA4 or your in-house models.
Review AI & flexibility: Does the AI explain how it scores elements? Can you add custom tags, rules, or export model outputs for further analysis?
Test reporting & exports: Open sample dashboards, check breakdowns by creative element/audience/time, and confirm export formats (CSV/JSON/BigQuery/S3) and API limits.
Gauge onboarding effort: Estimate setup time, required engineering work, and support level (self-serve vs. assigned specialist).
Run a short pilot: Demo or trial with 2–6 weeks of live data. Validate asset-level imports and ensure attribution alignment, and verify that AI tags align with your brand's needs.
By applying these selection steps, you’ll move from a broad list of options to the one platform that delivers the best mix of accuracy, speed, and actionable insights for your campaigns.
Also Read: Creative Optimization in 2025: Actionable Insights Report
Conclusion
The primary objective of this blog is to select the right creative analytics tool that can transform ad performance from guesswork into a data-driven process. The top creative analytics tools in 2025 go beyond basic reporting; they analyze every creative element, link it to actual results, and provide clear guidance on what to keep, change, or test next.
Success comes from choosing a tool that aligns with your goals, integrates well with your ad and analytics stack, and supports quick experiments that can scale once proven. By defining KPIs, validating AI tags, testing on live data, and acting on verified insights, marketing teams can reduce waste and focus on creative ideas that truly impact their metrics.
Segwise supports this approach by using multimodal AI to auto-tag images, video, audio, and playables and links those tags to campaign metrics. It offers no-code integrations, free tools (including Meta ad tracker and video-to-playable converter), and a 14-day free trial (with no credit card required) to run quick, data-backed pilots.
