Top 8 Essential Tools for Creative Performance Reporting & Visualization: Tested and Reviewed
Not sure which creatives are actually driving installs? With campaigns running across Facebook, Google, and TikTok, plus dozens of ad variants, it’s tough to know what’s working and what’s wasting budget. You need quick answers to questions like, Which hook converts best? Which creative drives IPM?
Without the right reporting tools, you're left guessing, and guesswork won’t scale your results. So, if you are also tired of juggling spreadsheets, tabs, and unclear reports that don’t link creative to user growth?
This blog explores 8 powerful ad reporting and visualization tools for creative performance, tested and analyzed for UA teams, Creative Heads, Growth and Performance Marketing Leads at agencies.
Key Takeaways
Creative performance reporting tools help link ad creatives to actual installs, IPM, and ROAS by connecting campaign data across platforms like Meta, TikTok, and Google.
These tools reduce time spent on spreadsheets and dashboards by automating reporting, surfacing insights faster, and enabling quicker decisions on winning and underperforming creatives.
Tools in this space fall into categories like data connectors, BI platforms, visualization dashboards, and creative-specific performance trackers, each offering trade-offs in speed, flexibility, and complexity.
Platforms like Supermetrics, Porter, and Adverity offer robust integrations but often lack features such as fatigue alerts, custom creative KPIs, and creative-level tracking.
Segwise is purpose-built for creative reporting and stands out with custom dashboards, surfacing underperforming ads, and linking creative insights directly to actions.
What are Creative Performance Reporting & Visualization Tools?
Creative performance reporting and visualization tools let you track how your ad creatives (images, videos, hooks, CTAs) are actually performing in ad campaigns. They bring together data from your ad platforms and measurement partners and turn it into clear visuals and dashboards so you can see which creatives drive the best results.
Instead of working from spreadsheets and guesswork, you get actionable insights that help you scale winners and pause losers. Here are common integrations these tools provide for your user‑acquisition efforts:
Integration with major ad networks (e.g., Meta Platforms/Facebook, Google LLC/Google Ads, TikTok Inc., etc.) so you can pull creative and campaign data in one place.
Connection to your Mobile Measurement Partner (MMP), Customer Data Platforms (CDP), and attribution tools so you can link creatives to installs and conversion events.
Export to or integrate BI‑tools so you can build custom reports tailored to your growth or UA team.
Now, let’s break down the different types of reporting and visualization tools that teams commonly use.
Also Read: Creative Optimization in 2025: Actionable Insights Report
What are the Different Types Of Reporting & Visualization Tools
Different categories of creative‑performance platforms address your reporting needs in unique ways, each with trade‑offs in features, complexity, and cost. Here are the main types you’ll encounter:
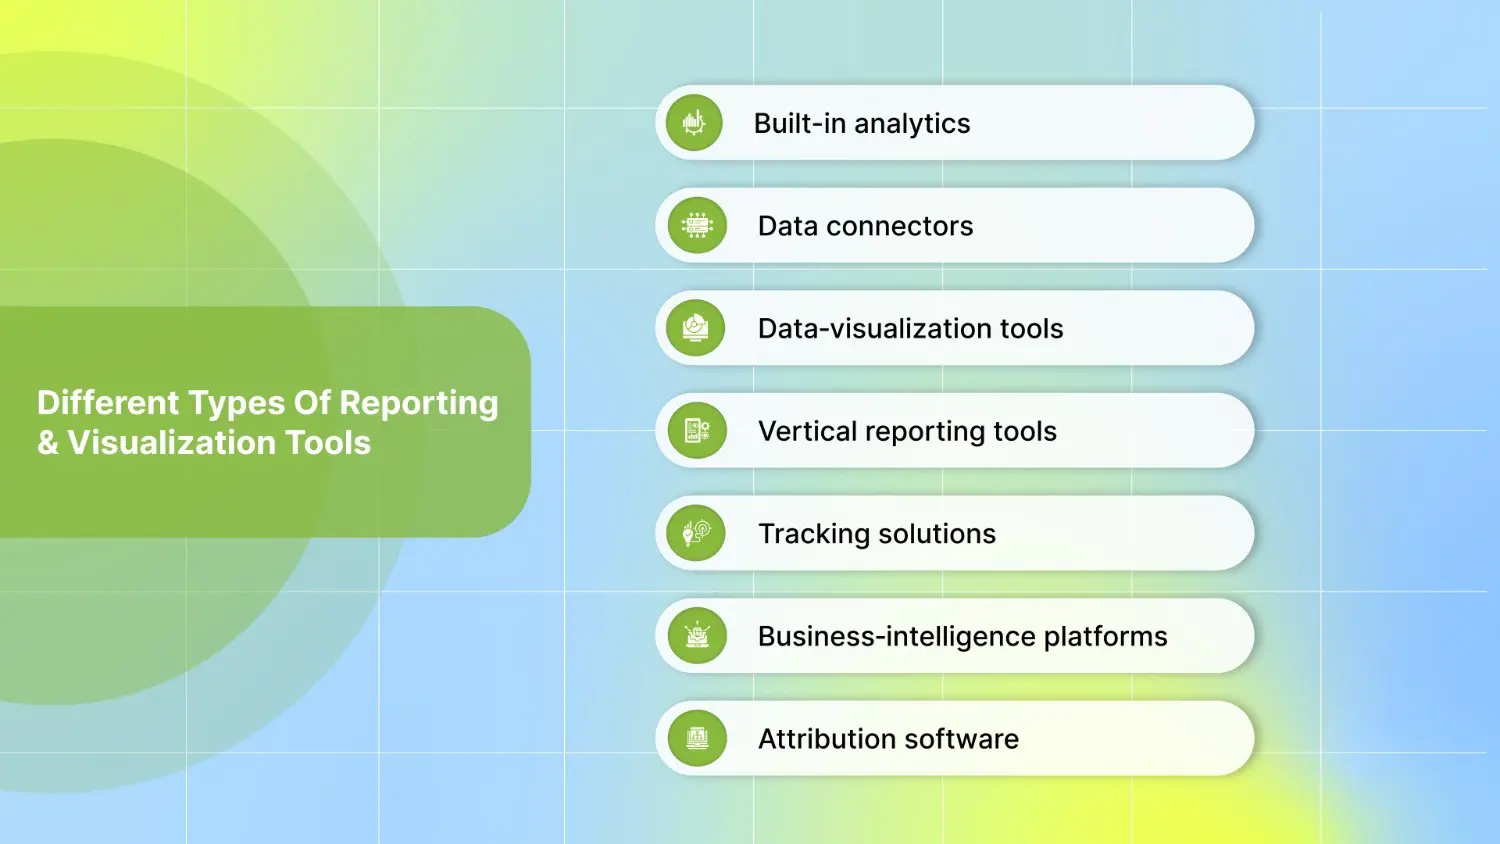
Built-in analytics: The default dashboards and reports provided by individual ad networks, MMPs, or creative platforms are quick to use but limited in scope.
Data connectors: Tools that import your marketing data into spreadsheets or reporting platforms so you can build custom visualizations.
Data‑visualization tools: Solutions focused on creating visual, easy-to-build dashboards, but lack integrations and data transformation.
Vertical reporting tools: simple integrations and reporting specific use cases, but may lack data transformation and flexibility.
Tracking solutions: Tools using JavaScript or SDKs to track installs, events, attribution, and user behavior give you clean user‑level data to plug into dashboards.
Business‑intelligence (BI) platforms: Full‑stack solutions that handle everything from integrations and data storage to transformations and visualization, ideal when you manage many brands/apps.
Attribution software: Platforms that use event‑level tracking, attribution models, or machine learning to map your creatives (and media) to installs and growth outcomes stronger depth but often higher cost and complexity.
Next, let’s look at some of the most effective tools for tracking and visualizing performance data.
Top 8 Creative Performance Reporting & Visualization Tools
Looking to speed up creative testing and get sharper insights from your performance data? Here are 8 top creative performance reporting and visualization tools that help you do just that:
1. Segwise

Segwise is an AI‑powered platform that automates creative tagging, surfaces underperforming ads, and connects creative insights directly to ROAS. With seamless integration across ad platforms and data sources, it delivers custom dashboards, reporting, enabling marketers to optimize spend proactively.
Top Features That Make Segwise Effective
Automated Reporting & Custom Dashboards: Build dashboards tailored to your KPIs and automate reports that get delivered to your inbox or Slack. You can also set custom metrics that reflect your goals.
This means less time wasted pulling data and more time optimizing performance. This empowers your team to make user‑acquisition decisions backed by data, not hunches.
Unified Creative Performance Dashboard: Segwise brings together creative, campaign, and attribution data from Facebook, Google, TikTok, and major ad networks into one dashboard, alongside your MMP and CDP data.
For you, that means no more jumping between tabs, just one interface to see which ad creatives are bringing in installs across platforms.
Custom Success Criteria Tracking: Set specific performance targets for new creatives you want to monitor, such as ROAS thresholds, spend-share goals, or any custom KPIs relevant to your acquisition strategy.
This means you can instantly spot which new creatives are meeting expectations and which ones need to be paused or optimized, without waiting for delayed analysis.
Pricing
Segwise offers a free trial so you can test its capabilities before committing. For your team, that means you can try before you buy and then select a plan that fits your UA scale and creative reporting needs.
Integration Capabilities
Segwise offers strong integration capabilities to bring your creative and performance data together cleanly:
Easy connection to major ad networks: e.g., Meta (Facebook) Ads.
Support for mobile measurement partners (MMPs) such as AppsFlyer and Adjust, so you map creatives to installs and conversions.
Integration with other networks like AppLovin and Moloco for cross‑network creative performance.
No‑code setup means you don’t need heavy engineering to pull your creative data together.
In short, Segwise is the best tool for the speed, clarity, and control needed to scale installs. With Segwise, you don’t just monitor creatives, you act on them, backed by deep insights and tailored reporting built for performance.
2. Porter Metrics

Porter Metrics is a no‑code business intelligence tool that blends marketing and sales data across channels, enabling you to build cross‑channel dashboards in tools like Google Sheets and Looker Studio.
Top Features That Make Porter Metrics Effective
Automated Report Delivery: Reports can be scheduled to be automatically shared via email, PDF, or a link.
Truly White-Label Dashboards: Porter lets you fully customize reports with your own logo and brand colors, making it easy to deliver client-ready dashboards.
Data ownership & scale: Full control of historical data, export to Sheets or BigQuery, supports switching between API & stored data at scale.
Pricing
$12.5/month per account (billed annually), with each account supporting up to 10 locations and full access to all data sources, templates, historical data, and user/report management.
Free Forever Plan includes 3 accounts, all data sources, data blending, basic storage, and 30-day data history with no credit card required.
Integration Capabilities
Destinations: Google Sheets & Looker Studio.
Data sources/connectors: Includes paid media (Meta Ads, Google Ads, TikTok Ads, etc.), Google (GA4, Google Business Profile), social media (Facebook Insights, Instagram Insights), e‑commerce & CRM (Shopify, HubSpot, Mailchimp), and more.
While Porter Metrics offers no‑code dashboards and automated reporting, its integrations and customization options may lack the granularity and deep creative insights. It lacks tools for fatigue tracking, dynamic ROAS mapping, or performance-based creative alerts.
3. Supermetrics

Supermetrics is a marketing‑intelligence platform that helps you connect data from multiple ad, analytics, and sales sources, then manage, analyze, and activate it.It enables you to move data to reporting destinations such as Google Sheets, Looker Studio, or data warehouses.
Top Features That Make Supermetrics Effective
Explore Data with Control: Supermetrics allows users to explore and validate marketing data before generating reports. You can quickly check data in a tabular format, validate queries, and perform transformations with precision.
Visualize in Dashboards Instantly: It provides built-in dashboards for visualizing marketing data directly on the Supermetrics platform. Users can set up dashboards in seconds, streamlining campaign performance tracking and creative insights.
Integrate with Multiple BI Tools: Supermetrics supports integration with Looker Studio, Google Sheets, Excel, and Power BI. This flexibility helps you analyze data where they are most comfortable, whether in spreadsheets or BI platforms, without heavy IT involvement.
Pricing
Starter ($29/month (billed yearly): For individuals and small teams. Includes 1 user, 3 data sources of your choice, weekly data refreshes, and dashboards.
Growth ($159/month (billed yearly): For growing teams needing automation. Includes 2 users, 3 data sources, 7 accounts per source, and daily data refreshes.
Pro ($399/month (billed yearly): For large teams with advanced needs. Comes with 3 users, 10 accounts per source, hourly data refreshes, and more.
Enterprise (Custom pricing (on request): For organizations needing enterprise-grade data, collaboration, and support across more destinations and data sources.
Integration Capabilities
Data Sources: integrations including Facebook Ads, TikTok Ads, LinkedIn, Instagram, Google Analytics 4, Adobe Analytics, Shopify, HubSpot, Salesforce, Mailchimp, Ahrefs, and more.
Destinations: Google Sheets, Excel, Power BI, Monday.com, and major data warehouses like BigQuery, Snowflake, Amazon S3, Azure, and Redshift.
While Supermetrics is feature-rich and integration-heavy, many of its capabilities are geared toward broader marketing operations and enterprise-scale data engineering, rather than specifically for creative performance reporting. The steep pricing tiers can also be limiting for fast-growing or budget-conscious teams focused on agility and creative optimization.
4.Windsor.ai

Windsor.ai is a no‑code ELT/ETL platform that enables you to connect marketing, sales, and analytics data from multiple sources and load it into your preferred reporting and visualization destination. It’s designed to streamline data integration and automate pipelines so you can focus more on data-driven insights than manual data preparation.
Top Features That Make Windsor Effective
Easy to Use: When you start using Windsor.ai, you’ll find it incredibly simple to build reports within just a few minutes and a few clicks. Even more impressively, you can create cross-channel reports without worrying about manual data blending; the platform handles it seamlessly.
Automatic Data Blending and Metrics Unification: Unlike many other connectors, Windsor.ai automatically blends and unifies metrics across different channels as soon as you connect your data sources. This means you won’t have to set up multiple configurations or manually merge data to achieve a comprehensive cross-channel view.
Exceptional Customer Support: Users consistently praise Windsor.ai for its outstanding customer support. You can expect quick responses and personalized assistance whenever you need help.
Pricing
Free Plan ($0/month): 1 user, 10 data sources, 15 accounts, 5 destination tasks, daily sync, 30-day history limit, and 30-day free trial.
Basic ($19/month): Unlimited users, 3 data sources, 75 accounts, 5 destination tasks, and daily sync.
Standard ($99/month): Unlimited users, 7 data sources, 75 accounts, unlimited destination tasks, and daily/hourly sync.
Plus ($249/month): Includes everything in Standard, with 10 data sources and up to 200 accounts.
Professional ($499/month): Includes all features from Plus, 14 data sources, 500 accounts, auto-add all accounts, SSO, and sync every 15 mins/hourly/daily.
Enterprise (Custom Pricing): Up to 300 data sources, 50,000 accounts, custom connectors, enterprise SLA, and invoice payments.
Integration Capabilities
Sources: Connect with many platforms, including Google Ads, Facebook Ads, LinkedIn Ads, Instagram, TikTok, Google Analytics, Salesforce, HubSpot, Shopify, and more.
Destinations: Send data to Google Sheets, Excel, Looker Studio, Power BI, Tableau, major data warehouses (BigQuery, Snowflake, Azure, Amazon S3), and custom tools like Python.
The platform is designed more as a broad marketing‑data integration/attribution engine, so if teams focus solely on creative insights, they may need to build an extra layer. Its user interface also has a steeper learning curve, especially for those unfamiliar with data tools and connectors.
5. Power My Analytics

Power My Analytics is a marketing data‑hub and reporting automation platform that lets you collect data from many ad sources and push it into reporting destinations like spreadsheets, dashboards, or warehouses.
Top Features That Make Power My Analytics Effective
Quick Setup: Power My Analytics offers an easy setup in minutes, enabling users to connect their data sources and generate comprehensive marketing reports without technical hassle.
GA4 Traffic Acquisition Reporting: With detailed Google Analytics 4 templates, you can visualize and compare traffic sources such as organic, paid, email, and social over time. Key metrics like sessions, engagement rate, events per session, conversions, and revenue are displayed clearly to help analyze performance trends.
Facebook Page Insights Dashboard: This report template focuses on essential Facebook metrics, including page actions, views, likes, post engagement, and video performance.
Pricing
Single ($14.95/month): 1 source and 1 account per source, includes 1 admin, data warehousing, email support, and guided onboarding.
Business ($39.95/month): 5 sources and 1 account per source, includes 2 admins, data warehousing, email support, and guided onboarding.
Pro ($99.95/month): Unlimited sources and 20 accounts per source, includes spreadsheets, priority support, data warehousing, and guided onboarding.
Enterprise ($295/month): Unlimited sources and 20 accounts per source, includes spreadsheets, exports, hourly refreshes, sovereign data warehousing, a dedicated representative, and end-to-end onboarding.
Integration Capabilities
Sources: Connects with platforms across PPC, e-commerce, SEO, social media, and CRM. This includes major ad platforms like Pinterest Ads, Snapchat Ads, and Taboola; e-commerce platforms like Amazon Seller Central, Shopify, and Walmart; and analytics tools like GA4 and Google Search Console.
Destinations: Sends data to Google Sheets, Excel, Looker Studio, BigQuery, MySQL, and custom destinations via FTP or API.
While Power My Analytics offers a wide range of marketing integrations, its templates and dashboards lean more toward general marketing KPIs than creative performance metrics. The platform is great for traffic and web analytics, but it lacks nuanced creative-level insights needed for optimizing visual or messaging effectiveness. For brands focused on creative impact, this might not align with your core needs.
6. AgencyAnalytics

AgencyAnalytics is an all‑in‑one reporting and dashboard platform to unify client data, automate reporting, and visualize performance across channels. It consolidates data from various sources into reports and live dashboards to streamline tracking of campaigns and creative assets.
Top Features That Make AgencyAnalytics Effective
Custom Dashboards for Tailored Reporting: The tool lets you create dashboards that match client expectations, offering complete and accurate views of campaign performance with flexible widget options.
Quick Report Generation: You can build reports in under 30 minutes or use templates to speed things up, saving time and focusing more on creative strategy discussions.
Insightful AI-Powered Analysis: AgencyAnalytics uses AI to summarize data and suggest new opportunities, helping teams turn complex insights into actionable recommendations instantly.
Pricing
Freelancer ($59/month): Ideal for individuals, it includes 5 clients and basic reporting tools.
Agency ($179/month): Suited for small teams, it supports 10 clients with expanded reporting features.
Agency Pro ($349/month): Designed for strategic agencies, it includes 15 clients and advanced reporting capabilities.
Enterprise (Custom Pricing): Tailored for large agencies needing custom reports, dedicated support, and scalability.
Integration Capabilities
AgencyAnalytics connects with various data sources, including:
Ad Platforms like Meta Ads, Bing Ads, LinkedIn Ads, AdRoll, and Taboola.
Social Media platforms such as Facebook Insights, Instagram, LinkedIn Pages, and YouTube.
Web & SEO Analytics, including Google Analytics, Google Search Console, Moz, and Ahrefs.
CRM & Email Marketing tools like Salesforce, HubSpot, and Mailchimp.
E-commerce platforms such as Shopify, WooCommerce, and Amazon Seller Central.
Call Tracking solutions like CallRail and CallSource.
This tool is designed mainly for client reporting workflows. It lacks strong features for ad-asset testing, creative hook analysis, and rapid install growth, which limits its use for creative performance tracking.
7. Adverity

Adverity is a powerful marketing‑data platform that unifies, transforms, and visualizes data from across your marketing ecosystem in one place. It enables teams to connect hundreds of sources, automate data workflows, and deliver dashboards and reporting that help understand campaign performance.
Top Features That Make Adverity Effective
Massive Connector Library & Flexibility: Adverity offers a large set of API connectors and custom‑connector options so you can capture data from very niche or custom marketing sources and blend them to build a comprehensive creative performance view.
AI-powered Insights You Can Trust: The platform allows you to instantly unlock reliable insights and share them effortlessly across teams.
Flexible, agnostic, and scalable: Adverity can seamlessly integrate with your current data stack. Intuitive features allow you to edit, clone, and apply changes at scale as your client base grows.
Pricing
Adverity does not publish fixed pricing tiers; instead, it provides custom quotes tailored to each client's needs.
Integration Capabilities
Data Sources: Multiple connectors covering ad networks, analytics, sales, e-commerce, custom APIs, and more.
Adverity excels at large-scale data transformation and reporting infrastructure. However, it lacks features tailored to creative asset-level optimization and fast-turnaround testing workflows. Additionally, the platform’s pricing is opaque and typically positioned for large budgets.
8. DashThis

DashThis is a digital reporting tool built to help gather data from multiple sources, such as Google Analytics, social media platforms, and ad networks, and present it in visually appealing, automated dashboards.Its mission is to eliminate manual reporting effort, so you can focus on interpreting data and taking action rather than copying and pasting.
Top Features That Make DashThis Effective
AI Insights for Actionable Takeaways: DashThis recently introduced AI Insights (in beta) that automatically scans your dashboards to highlight wins, red flags, and improvement opportunities. This eliminates guesswork and adds smart analysis to your visual data.
Effortless Data Connections: Connecting data sources like Google Analytics, Facebook, LinkedIn, and Google Ads takes just a few clicks. It helps you integrate your most important KPIs quickly and display them in one clean report layout.
Automated & Intuitive Reporting: The tool allows users to automate reports using pre-built templates and widgets. You can reuse dashboards or clone them across clients, making reporting faster without needing to learn complex tools.
Pricing
Individual ($42/month): Includes 3 dashboards with unlimited users and integrations.
Professional ($135/month): Offers 10 dashboards with full access to AI Insights and multi-integration reporting.
Business ($264/month): Comes with 25 dashboards, suited for mid-sized teams or growing agencies.
Standard ($409/month): Provides 50 dashboards for larger agencies needing scalability and extensive client reporting.
Integration Capabilities
Data Sources: Supports all major marketing platforms (Google Analytics 4, Google Ads, Facebook/Meta Ads, LinkedIn, YouTube, etc.) and allows custom data import via CSV files so you can add proprietary metrics.
While DashThis is excellent for straightforward KPI tracking and client reporting, it lacks the deeper creative analytics capabilities central to advanced campaign performance analysis.
Let’s look at how Segwise changes the way teams analyze and visualize creative performance reporting and visualization.
Also Read: Understanding the Difference between ROAS and ROI in Marketing
How Segwise Transforms Creative Performance Reporting and Visualization
If you're running performance campaigns across multiple platforms, from TikTok to Meta, managing creative reports can get messy fast. You might find yourself juggling scattered dashboards, inconsistent metrics, and a time-consuming reporting routine that eats into your optimization window.
Segwise solves this problem with intuitive boards, folders, and custom visualizations.
And you know the best part?
You can implement these features in under 5 minutes with no technical expertise. The interface is intuitive enough for growth leads and creatives alike to organize, monitor, and pivot without external help.
See the full workflow in action here:
Add this video here: “https://youtu.be/-UrwA3ZRo9M?si=CuwR50f3DQfODcGw”
What Makes the Segwise Workflow Stand Out?
1. Custom Visualizations
Switch between line charts, bar charts, and pie charts, with granular time controls (daily, weekly, monthly). This helps you instantly spot performance patterns across creatives, no digging or downloading required.
2. Interactive Boards
Forget jumping between disconnected dashboards. Segwise lets you centralize your creative performance reports across platforms into interactive boards. You can apply universal filters, which update across all reports, giving you a single, clean view to make smarter creative decisions, faster.
3. Smart Folders
Segwise’s folder system helps you organize dashboards hierarchically for team-wide access and streamlined workflows. This keeps your reporting system intuitive even as you scale, making it easier for everyone to find, compare, and act on creative performance data.
Results that Drive Faster Growth Decisions
Reduces report access time by up to 75%, so your team spends less time searching and more time optimizing.
Enables faster creative optimization decisions by delivering insights in one centralized view.
Teams instantly switch between campaign views while maintaining consistent analysis frameworks across all creative performance data.
Conclusion
Creative performance reporting and visualization tools are now essential for unifying scattered campaign data, automating reports, and uncovering insights faster. Each tool from data connectors like Supermetrics and Porter Metrics to reporting suites like AgencyAnalytics and DashThis brings unique strengths in integration, automation, and visualization.
Among all the tools, Segwise stands out as the most advanced platform purpose-built for creative performance reporting. It simplifies monitoring, comparing, and acting on data by connecting ad platforms, MMPs, and CDPs data with creative performance metrics in one place.
With custom dashboards and deep insights, it replaces slow, manual reporting with automated, actionable intelligence, helping teams move from analysis to action in minutes, not hours.
So, why wait? Try Segwise for free and see how faster reporting and smarter dashboards can change your creative optimization process.
FAQs
1. Can creative‑performance reporting tools replace a full business‑intelligence (BI) setup?
It depends on scale and complexity. For many UA teams and creative leads, a focused reporting tool provides enough insight and speed without the overhead of a full BI platform. But if you have many brands, a large data warehouse, and complex analytics needs, a BI tool might still be necessary.
2. How long does it usually take to get a creative‑reporting tool up and running?
The onboarding time varies by tool, but many modern platforms offer no‑code or low‑code setups that can integrate your ad networks, MMPs, and analytics systems within days to a week. The goal is to reduce manual data collection so you begin making optimization decisions faster.
3. How do I ensure reporting tools scale as my creative portfolio and campaign volume grow?
Choose tools with no‑code setup, centralized dashboards, multi‑platform integrations, alert systems, and custom success‑criteria tracking so you can add creatives, campaigns, and data sources without rebuilding your workflow each time.