What is CPR in Facebook Ads and How to Improve It
In Facebook Ads, every dollar matters. But are you truly maximizing your ad spend? With rising costs and growing competition, and Facebook’s potential ad reach increasing by 62.3 million (+2.8%) between October 2024 and January 2025, understanding your CPR (Cost Per Result) has never been more crucial.
If you aren’t tracking how much you pay for each valuable action, whether it’s a click, lead, or purchase, your campaigns could be wasting money without you even realizing it. Knowing your CPR helps ensure every dollar contributes to meaningful results and maximizes your return on ad spend.
In this guide, you will explore CPR (Cost Per Result), its importance for ad creatives, and how to strategically lower it to maximize ROI.
What CPR Tells You About Ad Performance?
CPR (Cost Per Result) is Meta’s metric for the average amount an ad campaign spends to achieve its targeted action: a purchase, an app install, a lead, or a click. In Ads Manager, this appears alongside the ‘Results’ column and is calculated by dividing total spend by the number of results for the chosen objective.
If a campaign is set to drive purchases and the CPR reads $5, that means the campaign spent $5 for each recorded purchase. CPR provides a single, outcome-focused metric that helps you compare creatives and placements based on the cost of the outcomes they drive.
CPR is most useful when read together with other reports (conversion rate, ROAS, and result volume). A low CPR with almost no results is not the same as a slightly higher CPR with steady volume.
How CPR Differs From CPC, CPM, And CPA
When evaluating ad creatives, CPR (Cost Per Result) differs from metrics like CPC (Cost Per Click), CPM (Cost Per Mile), and CPA (Cost Per Acquisition). While those track clicks, impressions, or acquisitions, CPR specifically measures how effectively your creatives drive the results defined by your campaign goals. Below are the key differences between these metrics:
Features | CPR (Cost Per Result) | CPC (Cost Per Click) | CPM (Cost Per Mile) | CPA (Cost Per Acquisition) |
What It Measures | Cost per campaign result (e.g., install, purchase, lead). | Cost per click on your ad. | Cost per 1,000 ad impressions. | Cost to acquire a customer or a specific conversion. |
Creative focus | How well a creative produces the campaign’s chosen outcome. | How well a creative drives clicks. | How well a creative reaches people. | How well the setup turns users into customers. |
Action vs. Exposure | Action-focused (results). | Action (clicks), not necessarily conversions. | Focused on exposure (impressions). | Focused on actions (acquisitions or purchases). |
Goal Alignment | Directly tied to the campaign objective. | Best for traffic-focused tests. | Best for awareness and reach. | Best for measuring acquisition cost. |
Optimization Focus | Use to compare creatives by result cost. | Use to improve CTR or landing experience. | Use to measure reach and frequency. | Use for acquisition-level bidding and LTV analysis. |
Best Use Case | Judge which creative drives the business result most cheaply. | Test headlines and hooks for engagement. | Brand-awareness campaigns. | Long-term acquisition and LTV planning. |
Understanding these differences makes it clear why CPR is a crucial metric for evaluating the effectiveness of your Facebook ads.
Why CPR Matters for Your Facebook Campaigns
In Facebook Ads, where costs are rising and competition is tough, CPR (Cost Per Result) is a key metric for judging ad creative performance. Here’s why it matters:
Shows creative ROI: CPR links spend to results, allowing creative owners to compare which video, thumbnail, or copy produces the most installs or purchases at the lowest cost.
Guides budget shifts: Use CPR to allocate spend to ads and formats that deliver results more cost-effectively, and pause those that don’t scale.
Reflects optimization choices: The CPR you see depends on the campaign’s optimization event and attribution settings; the same creative can show different CPRs under different settings.
Flags testing needs: Track CPR across creative variants; a rising CPR after launch often means creative fatigue, audience overlap, or weaker relevance.
Connects to long-term metrics: CPR is an acquisition cost input for ROAS and LTV models; keeping CPR aligned with the target LTV ensures sustainable acquisition.
Knowing why CPR matters sets the foundation for learning exactly how to calculate it for your campaigns.
How to Calculate CPR in Facebook Ads?
Calculating CPR (Cost Per Result) for your ad creatives is simple, but the insights it provides are powerful. It helps you see how efficiently each creative is driving the actions you care about and shows where optimization may be needed. Here’s how to calculate CPR in Facebook ads:
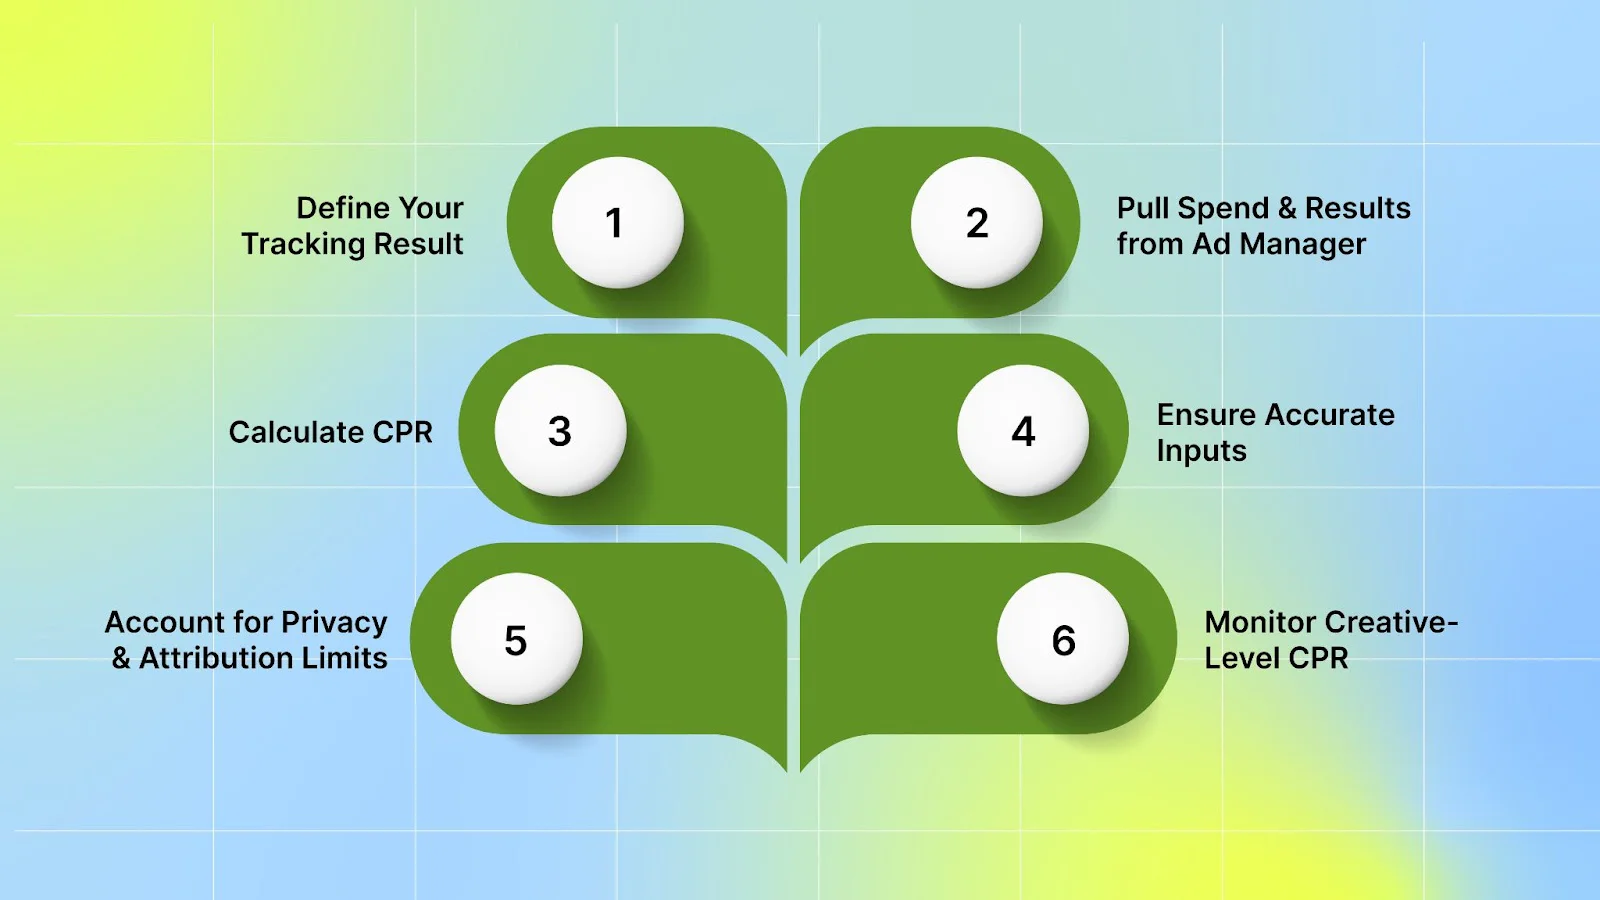
1. Pick the Result You Want to Track
Define the single action the creative is intended to drive, which is often an install or an in-app purchase. For lead campaigns, it might be a sign-up, and for other funnels, it could be a completed checkout. Use the same event definition when comparing creatives to ensure the CPR numbers align.
2. Pull Ad Spend and Result Numbers From Ads Manager
Pull total spend and the number of results for that exact event and ad creative from Meta Ads Manager. Run reports or use the creative-level breakdown to get ad-by-ad numbers (filter by ad ID if needed). When reporting across platforms or for SKAdNetwork campaigns, combine Ads Manager data with your MMP reports to prevent double-counting.
3. Use the CPR Formula
The formula for CPR is simple:

For example, if your ad creative spent $500 and generated 100 purchases, then:
CPR= 500/100 = 5
This means you’re spending $5 for each purchase generated by that creative. Use the same currency, same time range, and same attribution window for both spend and results when running this calculation.
4. Consider Accurate Inputs
Spend should only include the budget attributed to the creative being analyzed (ad-level spend or a filtered report). Results should be final, completed actions exclude refunded purchases or failed installs when calculating meaningful CPR.
Pay attention to attribution settings: Meta’s attribution window and reporting settings change which conversions are counted against each ad. For app measurement, match Meta’s data with MMP reports or server-side events to reduce signal loss.
5. Account for Privacy and Attribution Limits
If you’re running iOS app campaigns, SKAdNetwork and aggregated reporting limit how installs and post-install events are tracked. In that case, you’ll likely lean on an MMP (Adjust, AppsFlyer, etc.) to combine SKAN data with server-side or Conversions API signals for a clearer CPR view. On Android, attribution is generally more direct, but you’ll still need to handle cross-platform deduplication to keep reporting accurate.
If you’re a DTC brand without an app, the approach changes. Instead of an MMP, you’ll connect your backend sales or customer-level data system to Meta through the Conversions API.
6. Monitor Creative-Specific CPR
CPR will usually differ across creatives, placements, and audiences. Track CPR at the ad (creative) level to spot top performers and losers. Use these insights to pause low performers, iterate on creative elements, or reassign budgets to creatives that drive lower CPR for the same conversion event. If Meta’s dynamic or advantage creative formats are used, note that Meta may mix and match assets and pull ad-ID level reports to identify exactly which asset drove each result.
Once you can calculate CPR, the next step is to understand what constitutes a good benchmark in 2025.
What is a Good CPR for Facebook Ads in 2025?
A good cost per result (CPR) in 2025 is the number that keeps campaigns profitable for the app while still allowing sensible and scalable spending. CPR depends on an app’s LTV, the action being measured (install, signup, purchase), audience, and industry.
Calculate the break-even CPR based on LTV and the target payback window, then aim lower while maintaining high creative and post-click quality. (Meta’s auction and value-based delivery remain the main drivers of cost.)
How Cost Per Click (CPC) Affects Your Results
CPC is what is paid for a click; CPR is what it costs to drive the end action that matters. High CPCs raise CPR unless the post-click funnel converts well. Improve conversion rate on the landing flow or in-app onboarding, and the same CPC will buy many more results.
Use CPC as one signal, and judge it against conversion rate, average order value, and LTV.
Short example:
If CPC = $0.70 and landing conversion = 2%, CPR ≈ $35. If conversion lifts to 5% with a better funnel, CPR falls to ≈ $14 with the same CPC.
That gap explains why creative and post-click work matter as much as targeting and bidding.
Industry Benchmarks for CPC
To give you more context, here’s the latest industry-wise breakdown of average cost per click (CPC):
Broad Facebook/Meta CPC (US): roughly $0.58–$1.12 for traffic/conversion campaigns, depending on objective and dataset. Use this range to sanity-check bids and forecasts.
Finance & Insurance (CPC): often among the highest ~$0.70–$1.20+ per click on average vs. lower-volume, high-value leads.
Business Services / B2B (CPC): Approximately $0.60–$0.95, depending on niche and funnel stage.
Arts & Entertainment / Consumer categories (CPC): Typically lower, ranging from $0.25 to $0.60 for traffic campaigns, as reported in many instances.
Personal Services / Local (CPC): ~$0.60–$1.00, depending on intent and geographic location.
Sports & Recreation (CPC): ~$0.44–$0.60 in traffic campaigns.
Mobile game CPI (cost per install): iOS ~ $2–$5 (often $2.5–$4.7 reported); Android ~ $1–$3 (often $1.5–$3.4 reported). Genre matters: casual/hyper-casual titles tend to rank lower, while mid-core and casino titles can be far higher on iOS.
Different trackers use different sample sets and objectives (e.g., traffic vs. leads vs. installs), so expect variation. Having a benchmark in mind helps highlight the actionable steps you need to take to optimize your campaigns and reduce costs.
Also Read: CPI, IPM, and ROAS Benchmarks for Optimizing Ad Spend
How to Improve CPR in Facebook Ads?
Improving CPR (Cost Per Result) is one of the most effective ways to maximize your return on Facebook ad spend. Since CPR directly reflects how well your ads drive meaningful actions, optimizing your creatives plays a major role in lowering costs and boosting performance.
Here are practical ways to lower CPR through stronger creatives and setup:
1. Improve Ad Creative Quality
Better creative typically costs less to serve and converts more. Try these moves:
Visually clear assets: Use sharp images or videos that show the product or key benefit within the first few seconds.
Tight, direct messaging: Keep the headline and body focused on a single benefit or action. Short copy that aligns with the creative’s visual intent converts more effectively.
Test variations fast: Run multiple creative variants (visuals, headlines, CTAs) to see which version gets the action you want.
Note: Facebook’s Dynamic Creative workflow has changed since mid-2024, so check Ads Manager options for the chosen campaign objective before relying on that feature.
To take your creative optimization a step further, use Segwise’s Creative Analytics Audit Tool. This tool allows you to upload and analyze up to 100 creatives. It provides instant insights into which elements are performing well and which need refinement.
Also Read: Creating a Converting Facebook Ad: Practices and Examples
2. Reach the Right Audience
Even the best creative underperforms if shown to the wrong crowd. Use these audience approaches:
Lookalike audiences from high-value users: Build lookalikes from your best customers or most engaged users to find people likely to convert.
Interest and behavior layers: Add relevant signals when lookalikes alone are too broad.
Exclude converted or irrelevant groups: Stop showing conversion-focused ads to users who have already completed the action.
3. Run A/B Tests on Creatives and CTAs Regularly
Regular testing helps you identify what drives results at the lowest cost. Small adjustments can make a big difference, such as:
Formats: Compare single-image, carousel, and short video ads.
Copy and CTAs: Swap headline length and CTA verbs to see which prompt earns the highest conversion rate.
Timing and placements: Test different days, times, and placements (Feed, Stories, In-Stream) to find where the creative resonates best.
For example, ClimatePro, a window tinting company, ran tests on different creative and copy combinations in their Facebook Ads. By experimenting with visuals, such as before-and-after images, and adjusting copy length, they achieved outstanding results: a 686% increase in conversions and an 82% drop in cost per acquisition (CPA).
4. Limit Ad Frequency and Refresh Content
Showing the same creative too often can cause ad fatigue, which increases CPR as engagement drops. For that reason:
Set Frequency Caps: Limit how often your ads appear to the same person to avoid oversaturation.
Refresh Creatives: Keep things fresh by regularly updating visuals and messaging. New content helps sustain interest and prevents rising costs.
Also Watch: Catch Creative Fatigue Before It Drains Budget
5. Match Ads with Landing Pages
Conversion drops happen when the landing experience doesn’t match the ad. Make the promised action obvious on the landing page: matching headline, imagery, and a clear path to complete the conversion.
For example, Shulman Law boosted conversions by 95% simply by updating their headline to “Toronto’s Best Family Lawyers.” This small change aligned the ad’s message with the landing page, making the experience more consistent and persuasive.
Since most Facebook interactions occur on mobile devices, landing pages should load quickly and function smoothly on phones.
6. Use Short Videos to Increase Engagement
Video often outperforms static images when it comes to quickly communicating benefits. Best practices for video ads: keep them short (usually 15+ seconds), front-load the main message, and keep each frame relevant to the CTA. Test silent autoplay performance by adding strong visual cues and captions.
7. Take Advantage of Meta’s Measurement and Targeting Tools
Facebook frequently introduces new tools to improve ad performance. Using them can give you an edge. Take help of:
Implement the Conversions API alongside the Meta Pixel to send server-side events and improve measurement and optimization. Advertisers that combine server-side data with Pixel signals can reduce lost signal and improve cost per result.
Use Custom Audiences and conversion events to retarget users who have engaged but haven’t converted.
8. Make CTAs Direct and Relevant
CTAs drive the final step. Use action-first CTAs (for example, “Download,” “Start Free Trial,” or “Sign Up”) and test language that aligns with the funnel stage. Add a short value line when helpful (e.g., “Free 7-day trial”) rather than long urgency phrases.
If a performance uplift is the goal, these steps help lower CPR by improving how ads are shown, who sees them, and how those actions are measured.
While these strategies can improve CPR, being aware of common mistakes ensures your efforts are effective and efficient.
Avoid These Common Pitfalls to Lower CPR

While optimizing your Cost Per Result, it’s essential to avoid certain pitfalls that can hinder your efforts. Here are common mistakes to watch out for.
Common Mistakes | How to Avoid |
Over-Saturation of Ad Creatives | Rotate assets, use dynamic creative, and set frequency caps. |
Ignoring Customer Lifetime Value (LTV) | Evaluate CPR with LTV; send post-install events (Conversions API) for value-aware bidding. |
Chasing CPR alone | Compare CPR with ROAS and retention; run small cohort or holdout tests. |
Only short-term conversions | Keep prospecting and remarketing separate; track outcomes within 7–30 days. |
Weak retargeting / no CRM sync | Build layered retargeting, sync first-party data, and exclude converters from prospecting. |
Measure CPR in context, refresh creative proactively, link CPR to real LTV, run the right mix of prospecting and retargeting, and make data decisions with cohort tests or holdouts. These steps reduce wasted spend and move CPR toward profitable growth.
Also Read: Top Facebook Ad Tools for Effective Campaign Management
Conclusion
CPR is best used as a focused metric that shows whether your ad spend is driving meaningful outcomes. To make it actionable, connect CPR with lifetime value, funnel conversion rates, and creative testing. Maintain a steady loop of experimentation, refresh assets before fatigue sets in, and align reporting with consistent attribution to ensure accurate comparisons. Building this process into your creative workflow ensures every campaign improves on the last.
Segwise uses AI agents to automatically tag creative elements across images, videos, and playables, and then links those tags to performance, allowing you to see which elements drive creative-level ROAS, CPA, and LTV in a single, unified view.
Run their free Creative Audit to upload creatives and metrics with no engineering work, and start a 14-day free trial to test AI tagging and the creative analytics reports on your own ads.
FAQs
1. When is CPR a misleading metric to rely on alone?
If lifetime value (LTV), retention, or post-click quality matter more than immediate conversions, CPR can appear favorable while the funnel loses money. Compare CPR with LTV and ROAS before taking action.
2. How does the attribution window change the CPR number I see?
Shorter windows (e.g., 1-day click) will typically show a lower, more immediate conversion rate, while longer windows capture delayed conversions and often increase reported conversion rates; choose the window that matches the buyer's journey.
3. Why can iOS SKAdNetwork reporting show a different CPR than Ads Manager?
SKAN aggregates and delays postbacks, so install and post-install costs may differ from server-side or pixel-based reports. Combine SKAN with MMP/server signals for a clearer view.
4. What early signs mean CPR is rising because of creative fatigue or audience overlap?
Watch for falling CTR, rising CPM, and steady impression share with worsening CPR. Those patterns often signal creative wear-out or overlapping audiences stealing performance.
5. How should teams compare CPR across channels or campaigns?
Normalize by the same conversion event, currency, and attribution window, then benchmark against channel-specific averages so comparisons reflect real efficiency rather than reporting differences.
