Ecommerce Analytics: How Mobile App Marketers Measure, Analyze & Grow Revenue
You launch 10 new creatives across three ad networks. Which hook, CTA, or character actually drove the revenue lift?
That’s where ecommerce analytics comes in. It shows you which ads turn into real revenue, not just clicks or installs. You need clean revenue tied back to each creative and dollar spent, tracking that holds up under platform privacy changes, and fast signals so you can shift budget before costs climb.
The AppsFlyer report shows $78 billion was spent on user acquisition for apps in 2025, so paid channels are crowded, and measurement mistakes cost real dollars.
The real goal is simple: know which ads drive purchases, close the gap between cost and revenue data, and use clear metrics to scale what actually pays back.
In this blog, we’ll cover the core ecommerce analytics metrics you should track, explain how to connect revenue to creatives and campaigns, and walk through a practical 3-step framework to measure, test, and grow revenue with confidence.
What is Ecommerce Analytics?
Ecommerce analytics is the practice of collecting and using data to understand how people find, install, and buy from your app. At its simplest, it connects the clicks and impressions that led someone to install your app with the events that show value, purchases, subscriptions, or in-app upgrades, so you can measure what’s actually making money.
For mobile apps, ecommerce analytics has a few important differences from web analytics. Mobile measurement partners (MMPs), changes in platform vendor privacy, and server-side revenue tracking all shape what you can measure and how you measure it.
You’ll often combine ad platform data (cost, impressions) with app events (installs, purchases) and server receipts (validated purchases) so that revenue can be tied back to the right creative or campaign. Tools and methods built for apps emphasize secure server flows and privacy-preserving attribution to keep that chain intact.
Now that you know what ecommerce analytics is, the next question is why it matters for what you do every day, and how it helps you make smarter, faster decisions.
Why Ecommerce Analytics Matters
You want to know which ads and creative ideas actually bring paying customers, not just installs. Ecommerce analytics gives you that answer. With clear, repeatable measurement, you can:
Spend smarter: Move budget to ads and networks that bring higher revenue per dollar.
Improve creatives: Learn which visuals, hooks, or CTAs drive purchases and repeat purchases.
Scale confidently: Set bid or budget targets based on real LTV and payback numbers instead of guesswork.
Catch issues early: Spot creative fatigue, tracking gaps, or rising acquisition costs before they become expensive problems.
Analytics is the backbone of optimizing ad spend and creative testing. When you make data central to creative decisions, you turn guesswork into repeatable wins. A clear analytics setup also helps you adapt to privacy changes and continue scaling without blind spots.
With that goal in mind, making better spend and better creatives, let’s look at the exact metrics you should track and why each one matters.
Also Read: AI Ad Analysis Tools in 2025: Find What Drives Creative Success
Key Metrics Every Creative & UA Team Must Track
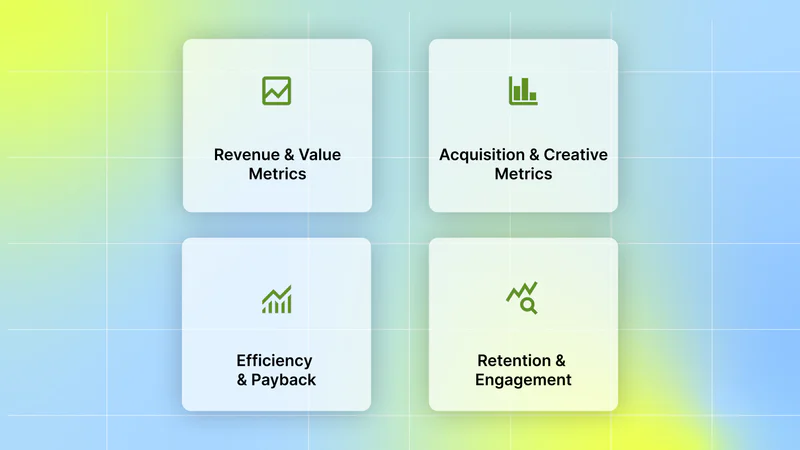
Below are the core metrics you should track, how to think about them, and a quick note on what you can do with each one.
1. Revenue & Value Metrics:
What they are:
ARPU: average revenue per active user over a period.
ARPPU: average revenue per paying user.
LTV: cumulative or modeled revenue per user over a defined time window (e.g., 7-, 30-, 90-day), often projected to estimate full lifetime value.
Why they matter: LTV tells you how much you can sensibly pay to acquire a user. Short windows (7 or 30 days) are useful for fast experiments; longer windows (90 days) show longer-term value for subscription or repeat-purchase apps.
Actionable step: Calculate 7-, 30-, and 90-day LTV, then use the results to set scale thresholds (for example, max CPA = LTV × target payback ratio).
2. Acquisition & Creative Metrics
What they are: CTR (Click-Through Rate) and CVR (Conversion Rate) show early funnel performance; CPM (Cost Per Mille) and CPI (Cost Per Install) measure cost efficiency; creative-level ROAS ties revenue back to the asset that ran the ad.
Why they matter: CTR/CVR tell you if an ad is interesting enough to click and convert; CPI/CPM tell you if it’s affordable; creative ROAS tells you if that creative makes money after cost.
Actionable step: Tag each creative with a stable creative_id and compute ROAS by joining cost data to revenue by that ID. That gives you a direct read on which creative attributes actually generate revenue.
3. Efficiency & Payback
What they are: CAC (cost per acquired user), payback period (days to break even), blended ROAS (total revenue / total ad spend across channels).
Why they matter: Payback period and CAC tell you whether you can safely scale now or need to tighten bids. Blended ROAS helps you see the full picture when users come from many channels.
Actionable step: Use CAC and payback targets to decide when to increase the budget: if CAC < target and the payback period is acceptable, scale; if not, pause or optimize. Industry advisors recommend these as core finance checks before scaling.
4. Retention & Engagement
What they are: DAU/MAU shows habitual usage; cohort retention (Day 1/7/30) shows how well users stick; churn is the inverse of retention.
Why they matter: High initial installs mean little if people don’t return. Retention is the clearest signal that a creative brought a quality user who will return and spend.
Actionable step: Run retention cohorts by creative_id to identify which creatives generate returning, paying users. That helps you prioritize creatives that drive long-term value, not just installs.
Tracking metrics is the foundation. Turning them into consistent decisions requires a structured approach that ties setup, analysis, and scale together.
Suggested watch: Segwise Creative Analytics: Build Custom Metrics in 60 Seconds - Quick walkthrough of creating custom metrics on the Segwise dashboard (perfect for setting up creative-level ROAS or a creative_performance table).
A 3-Step Ecommerce Analytics Framework for Mobile UA & Creative Teams

This is a short playbook you can follow from setup to scale. Think of it as three clean stages: get tracking right, turn data into clear creative decisions, then automate and monitor so you can scale without breaking things. Each stage has focused actions you can apply this week.
Step 1: Set Up Ecommerce Analytics Tracking the Right Way
If your data isn’t reliable, every decision will be shaky. Start by ensuring purchases and creative IDs are captured cleanly, and that cost and revenue can be joined.
Track revenue events accurately (server-side vs client-side tracking)
What to do: Send purchases from your server to your analytics platform instead of relying only on events fired inside the app. Server-side receipts and validated purchase events are less likely to be lost or blocked, and they make revenue numbers auditable. Use server receipts to confirm purchases and attach revenue to the right user or install identifier.
Why it matters: Client events can be blocked by network or device settings. Server flows reduce gaps and help you keep revenue measurement stable under privacy changes.
Implement server-to-server purchase reporting for your app store receipts, map receipt IDs to installs, and log an event in your BI table with a timestamp and revenue amount. Where deterministic install-level mapping isn’t available (e.g., SKAN flows), reconcile revenue at the campaign or conversion value level. With reliable revenue events, you can trust the numbers you use to judge creatives and channels.
Standardize creative identifiers (naming conventions, creative_id & asset fingerprinting)
What to do: Create one canonical ID for each creative asset (creative_id) and enforce a consistent naming convention that includes campaign, placement, creative type, and variant. For messy cases, use asset fingerprinting (hashes of filenames or metadata) so that identical assets map to a single ID.
Why it matters: If an ad running on different networks or with different tags looks like several different creatives in the data, you’ll split its results and miss the true winner. A single creative_id makes joins simple and analysis reliable.
Publish a naming spec (example: brand_campaign_placement_format_variant) and put a small automated script in your build/release flow that writes the creative_id into ad assets or ad tags. Once creative assets are consistently identified, you can cleanly join performance and revenue on creative_id.
Connect your data stack (ad networks, DSPs, MMPs & BI tools)
What to do: Build a daily process that ingests cost and impression data from ad networks, install and attribution data from your MMP, and revenue events from your backend. Normalize timestamps and IDs so you can join cost, installs, and purchases into a single fact table. If possible, centralize raw events in a warehouse (E.g., BigQuery or Snowflake) so that analysis is repeatable.
Why it matters: Ad spend only matters when you can connect it to revenue. A single source-of-truth table keeps everyone viewing the same numbers and enables automated reports.
Create a daily “creative_performance” table with these columns: date, creative_id, network, cost, impressions, clicks, installs, purchases, revenue, attribution_source. With tracking, stable IDs, and a joined table, you’re ready to run the analysis that finds real winners.
Also Read: Best Ad Tech Platforms for Creative Optimization in 2026
Step 2: Analyze Performance and Turn Data Into Insights
Now that the data is trustworthy, use clear recipes to compute creative ROAS, spot fatigue, and decide which tests to run.
Calculate Creative-Level ROAS (Focus on What Actually Drives Revenue)
Compute ROAS by dividing the total revenue generated by users attributed to a specific creative_id by the total ad spend for that same creative_id over the same measurement window (7, 30, or 90 days). Use shorter windows for fast testing decisions and longer windows (30–90 days) to validate long-term value and LTV stability.
Formula:
[ROAS = Revenue from creative ÷ Cost of that creative]
If a creative spent $1,500 and generated $4,500 in tracked revenue, its ROAS is 3.0 (or 300%).
Why it matters: Creative-level ROAS tells you whether an individual ad actually generates profit, not just installs or clicks. Many teams optimize for CTR or CPI, but those metrics don’t guarantee revenue. ROAS connects ad spend directly to revenue, which is the core goal of ecommerce analytics.
How to apply it correctly:
Measure ROAS at 7 days to quickly evaluate new tests.
Validate winners again at 30 or 90 days before major budget increases.
Compare each creative’s ROAS against your predefined scale threshold.
Always review the sample size before making decisions to avoid acting on small datasets.
Run a weekly creative performance review. Rank creatives by ROAS, mark those above your target for scale, and flag those below your profitability cutoff for pause or refresh. Confirm that short-term ROAS aligns with longer-term revenue before increasing spend.
This gives you a clear, ranked list of creatives to scale confidently, optimize strategically, or retire before they waste budget.
Detect Creative Fatigue (Trend + Cohort Method)
Watch short-term performance trends (CTR, CVR, CPM, CPI) and compare user cohorts brought in by the creative across recent weeks. Use two signals together: a trend rule that looks for rapid declines, plus a cohort check that verifies whether users acquired more recently behave worse than earlier cohorts.
Why it matters: Creative fatigue shows up before revenue collapses. You’ll often see falling CTR or CVR, rising CPM/CPI, and weaker retention for users from the newest buys. Catching fatigue early prevents you from spending heavily on losing creatives.
How to apply it correctly:
Trend rule: flag any creative with a CTR drop of ~20% or more over a 7–14 day window, or a steady rise in CPI/CPM over the same period. (These thresholds are common early-warning signals used by top teams.)
Cohort check: compare Day-1, Day-7, and Day-30 retention and early revenue for users attributed to that creative this week vs. last week. If both trend and cohort signals look worse, mark the creative as fatigued.
Combine with frequency and audience overlap checks: high frequency or rising overlap often causes fatigue; if either is present, act faster.
Create two dashboard widgets: (1) a 7–14 day trend chart for CTR/CPI/CPM by creative_id, and (2) a cohort retention comparison by creative_id. If a creative trips both checks, pause or refresh it and reroute the budget to proven winners.
Using trend + cohort together gives you a clear, low-noise trigger to refresh creatives before costs spike and ROAS falls.
Test & Scale: When to A/B vs. Multi-Armed Bandit
Pick the testing method that matches your goals and traffic. Use A/B tests when you need clean, statistically solid answers for one or two clear hypotheses. Use multi-armed bandits when you have many variants and want to allocate budget dynamically while you learn.
Why it matters: A/B testing gives reliable confidence for one-off questions. Bandits reduce wasted spend by shifting traffic away from losers faster, which is useful for many concurrent creative variants or always-on campaigns. Choosing the wrong method can either slow learning or waste budget.
How to apply it correctly:
Use A/B when: you have a single hypothesis, need clear statistical proof, and can run the test with a fixed split and pre-defined sample sizes. Confirm winners on a longer revenue window before full scale.
Use bandits when: you’re testing many creatives at once, traffic can be reallocated continuously, and you want to maximize conversions during the experiment. Keep exploitation conservative and reconfirm top arms on 30-day revenue.
Hybrid approach: run bandits to surface strong candidates, then validate top performers with short A/B tests tied to revenue windows. This balances speed and statistical confidence.
For a new creative batch, start a bandit to quickly highlight high-performers, then move the top 2–3 into controlled A/B tests with a 30-day revenue check before scaling budgets further.
Match the test to the problem, use A/B for clear proof, bandits for fast allocation across many variants, and a hybrid to get the best of both worlds.
Also Read: AI-Powered Creative Testing: The Modern Performance Marketing Framework for 2026
Step 3: Build the Right Ecommerce Analytics Architecture
To scale reliably, you need automation and monitoring. This reduces manual work and prevents scaling on broken data.
Identify and consolidate core data sources (MMPs, ad platforms, backend revenue events)
What to do: Make the MMP the source of truth for attribution windows you use, but also bring raw backend revenue into your warehouse so you can reconcile and build models. Keep a clear mapping table that links network creative IDs to your creative_id. Many teams pair MMP telemetry with server receipts and ad network cost feeds for best results.
Why it matters: Consolidation avoids mismatches between tools and gives a single workflow for reporting and alerts.
Build a reconciliation job that runs daily and reports any large gaps between MMP-attributed revenue and server receipts. Consolidated sources let you trust automated dashboards and alerts.
Automate creative tagging and data enrichment for scalable analysis
What to do: Move manual tagging to automated processes. Use parsing rules for naming conventions, simple regex, or NLP taggers to extract attributes (hook, format, product shown) from creative names or asset metadata.
Why it matters: Automation makes attribute analysis faster and more consistent, helping you identify recurring patterns (for example, “product shots outperform lifestyle hooks”).
Start with a rule set for naming parsing and add an automated classifier for common attributes. Backfill tags for top creatives first. With automated tags, you can analyze which elements of creatives actually drive revenue.
Note: To automate this step, consider a creative intelligence platform like Segwise, which automates creative tagging with multimodal AI that tags elements such as hook scenes, first dialogues, headlines, characters, influencer traits, CTA text, CTA dialogue, and audio cues, then maps those tags to performance metrics such as ROAS and CTR. This makes attribute-level analysis fast and repeatable for cross-network campaigns.
Monitoring & alerting (set automated checks for data gaps and KPI drops)
What to do: Set basic alerts for missing revenue events, sudden drops in daily revenue, large ROAS swings, and data pipeline failures. Keep alerts actionable (who fixes what). Use a small number of high-value checks rather than a flood of noisy alerts.
Why it matters: Scaling on broken data is a common cause of wasted spend. Monitoring prevents blind scaling and saves time.
Quick step: Implement three initial alerts: (1) revenue < 70% of expected for 24 hours, (2) ROAS drop > 30% vs 7-day average, (3) ingestion failure for any core data source.
Pair automated alerts with on-call ownership so issues are fixed quickly, and you don’t accidentally scale broken campaigns.
Note: For automated alerts, Segwise offers automated creative fatigue detection and unified reporting across 15+ ad networks and MMPs, so you can flag falling ROAS or rising CPI before costs balloon.
With the framework in place, the remaining question is how to operationalize this level of insight across multiple creatives, networks, and testing cycles.
Suggested Watch: Catch Creative Fatigue Before It Drains Budget with Segwise - Demo of Segwise’s fatigue-detection features and alerting, useful for the trend + cohort checks you describe.
Final Thoughts
When you build your ecommerce analytics workflows around real revenue signals, creative testing becomes a reliable growth engine instead of a guessing game. By tying spend to revenue, surfacing creative patterns that correlate with performance, and building processes that catch weakening ads early, you create a clear roadmap from measurement to scalable results that improve ROI.
But managing creative performance at this level across networks, formats, and dozens of variations quickly becomes overwhelming. What modern teams need isn’t just better reporting. They need creative intelligence.
Segwise is a creative intelligence platform designed to help creative strategists and growth teams turn data into winning creative strategy.
It brings together three core capabilities:
Creative Analytics: Unifies creative data across networks, automatically tags and analyzes elements like hooks, visuals, audio cues, and CTAs, and maps them directly to performance metrics such as ROAS, CPA, LTV, and CTR.
Creative Generation: Translates performance insights into data-backed creative iterations so teams can scale what works faster.
Competitive Tracking: Monitors competitor creative strategy so you can identify emerging patterns, positioning shifts, and market opportunities early.
The result isn’t just cleaner dashboards. It’s a repeatable system for building winning creatives and a scalable creative strategy grounded in real revenue signals.
Start a Free Trial of Segwise to bring your ecommerce analytics to life, shorten creative test cycles, and make revenue-backed decisions that grow long-term value.
