In 2025, every dollar of your user acquisition (UA) budget counts. Mobile app spending reached $150 billion in 2024, with the majority of growth concentrated in a few high-value titles. Gaming revenue grew by 4% to $81 billion, even as downloads dropped 6% to 49.6 billion, indicating that getting installs no longer guarantees engagement or spending. To stay ahead, you need to optimize UA spend for quality over quantity.
In core markets like the US and Japan, every extra dollar battles against market fatigue, privacy shifts (think SKAdNetwork), and skyrocketing CPIs. You’re losing users to ad saturation, tighter targeting rules, and platforms that demand more spend for each impression.
Ultimately, allocating your UA budget wisely will determine whether you hit your installs, engagement, and revenue goals. You’ll need data-driven spend that reflects player behavior, campaign goals, and turns tighter budgets into higher returns.
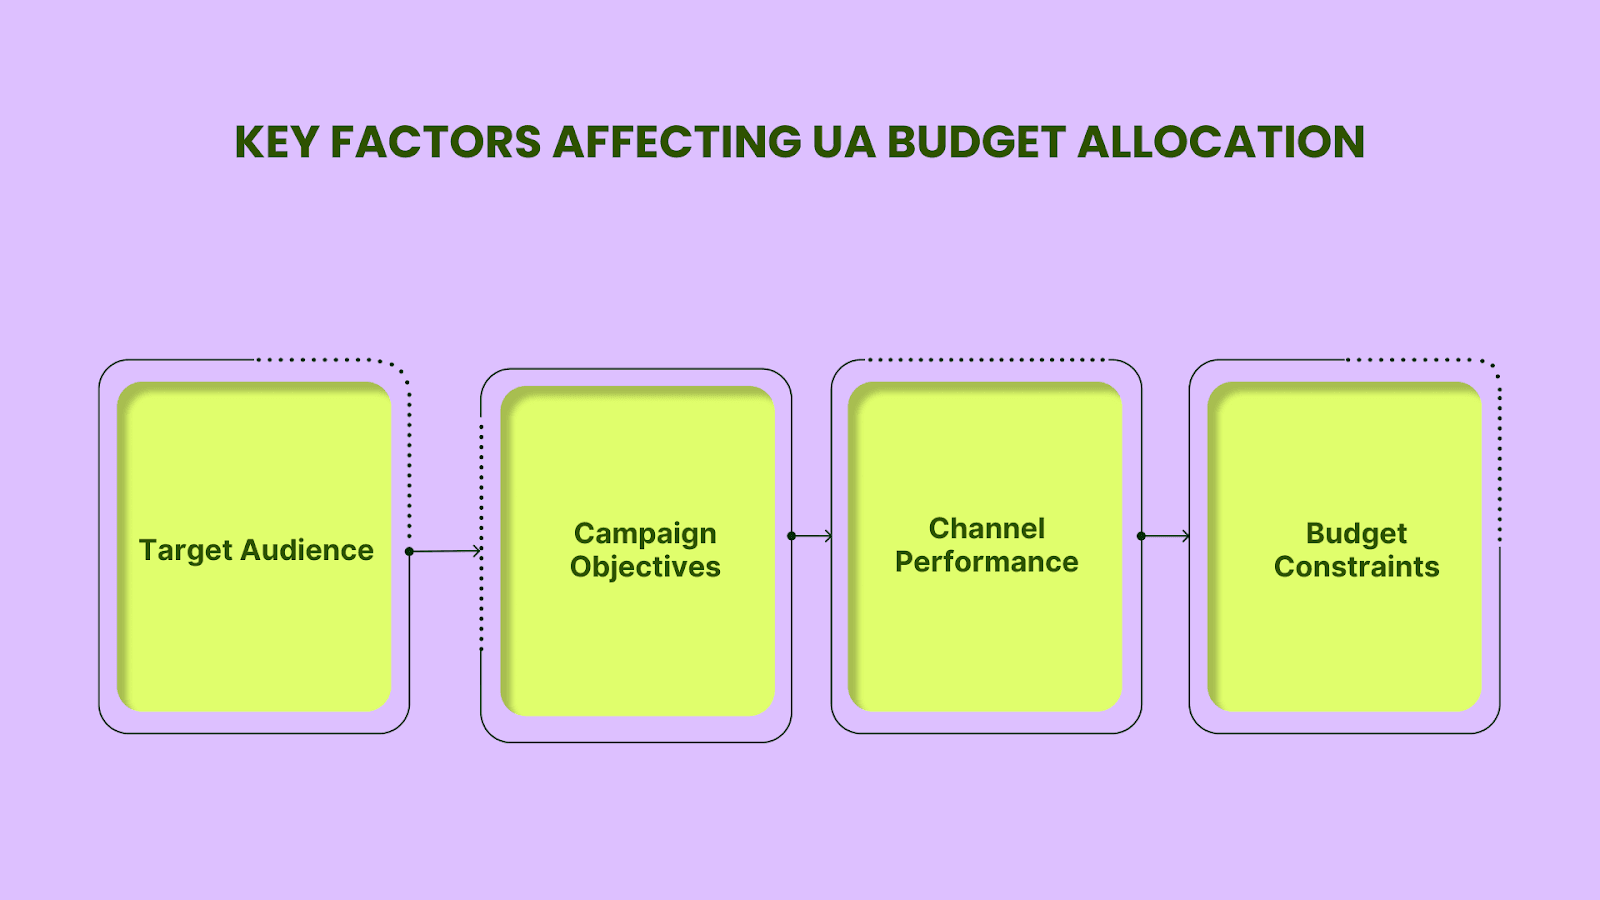
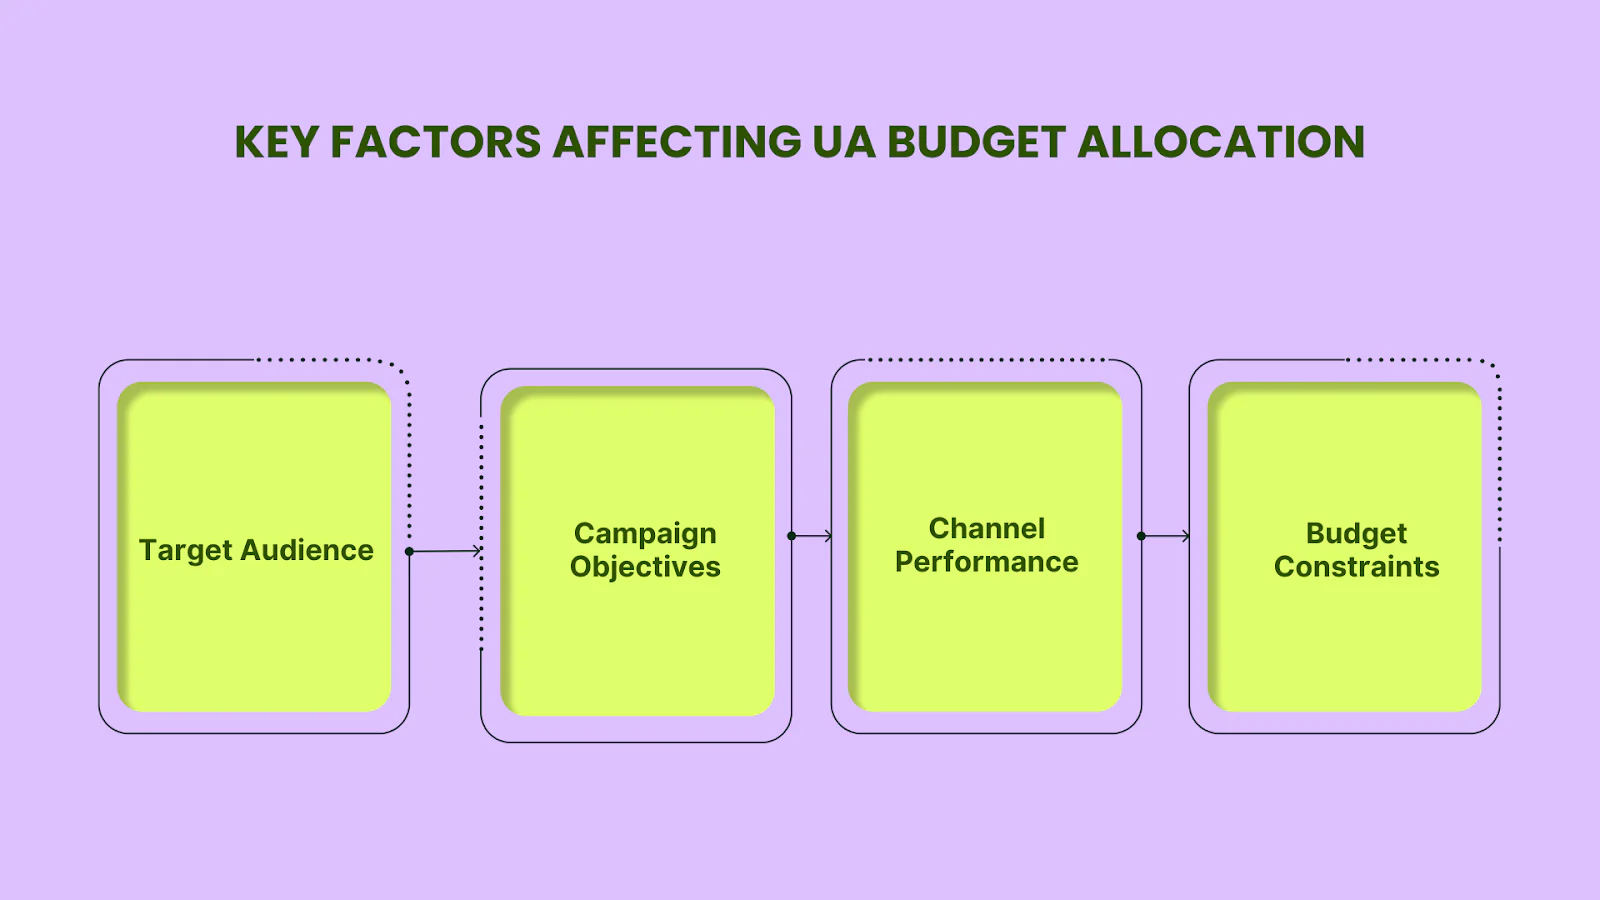
Key Factors Affecting UA Budget Allocation
To optimize UA spend, consider these critical factors:
Target Audience: Differences in player demographics and spending behavior across genres (e.g., high ARPU strategy/MMO vs. low-spending hyper-casual) directly impact value per user and cost efficiency.
Campaign Objectives: Budgeting varies based on goals like installs or ROAS. Each objective affects allocation priorities, such as scaling, testing, or allocating spend between the brand and its performance.
Channel Performance: Performance differences across platforms (e.g., TikTok vs. Facebook) and game genres, as well as shifting CPIs and ROAS over time, influence how budgets should be distributed and diversified.
Budget Constraints: Whether budgets are fixed or flexible and how they respond to seasonal trends or campaign efficiency influence how funds are allocated and adjusted.
Effective UA budgeting depends on aligning spend with audience value, campaign goals, platform dynamics, and financial constraints to optimize UA spend. Let's explore the challenges that could impact your budgeting decisions.
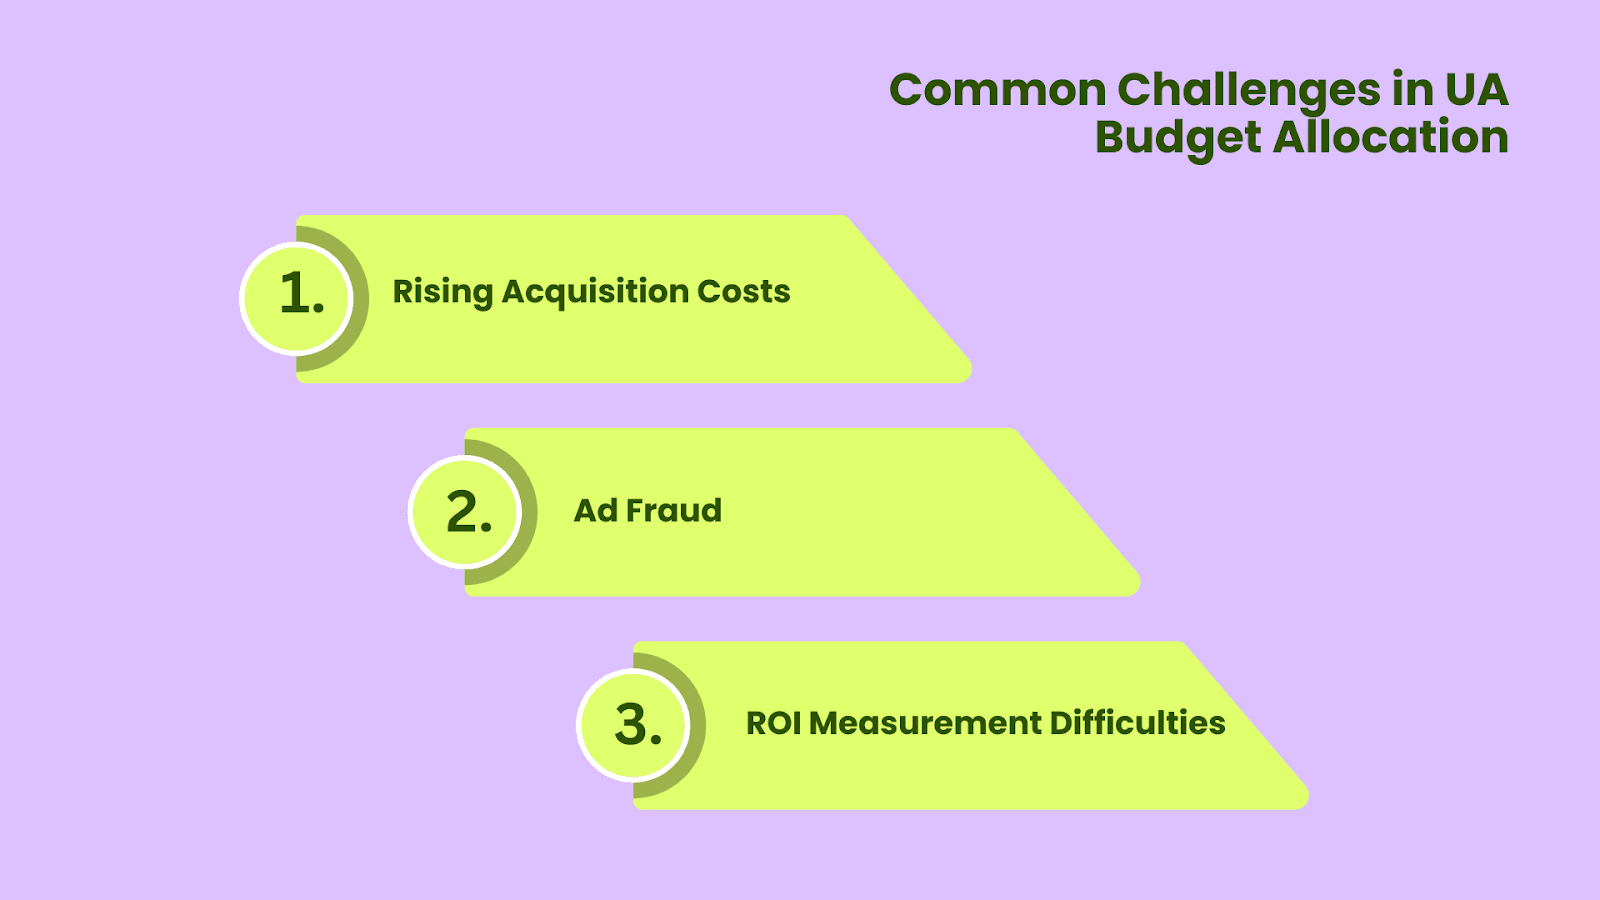
Common Challenges in UA Budget Allocation
User acquisition (UA) in 2025 presents several challenges that impact budget allocation:
1. Ad Fraud
Ad fraud is a malicious practices that generate fake ad traffic, impressions, clicks, or installs to drain budgets and distort campaign performance illicitly. Fraudsters employ click spamming, install farms, SDK spoofing, click injection, domain spoofing, and ad stacking to fabricate user activity, inflate metrics, and hijack attribution models, making it nearly impossible to measure ROI and optimize marketing spend accurately. Such activities erode advertiser trust, waste billions annually (Juniper Research estimates 22% of all digital ad spend in 2023, about $84 billion, was lost to fraud), and necessitate robust fraud detection and prevention measures.
2. ROI Measurement Difficulties
Recent privacy-focused updates, including Apple’s SKAdNetwork 4.0 and Google’s phase-out of GAID, have significantly reduced access to granular user-level data, complicating ROI measurement.
SKAdNetwork 4.0 introduces features like coarse conversion values, delayed postbacks across three attribution windows (up to 35 days), and stricter privacy thresholds that limit visibility, especially for low-volume campaigns. If thresholds aren't met, data returns to aggregated, less-informative crowd-based insights.
On Android, the deprecation of GAID and the shift to the Privacy Sandbox, with tools like the Attribution Reporting API, deliver only aggregated, non-user-level metrics. These changes mirror Apple’s privacy path and are rolling out throughout 2024–2025.
As a result, marketers must now depend on modeled lifetime value (LTV), coarse conversion buckets, and aggregated postback data, often interpreted using statistical or machine learning models, to estimate ROI in this privacy-first environment.
With these challenges in mind, it's time to explore how you can build a robust framework for your UA budget allocation to overcome them and maximize the effectiveness of your campaign.
A well-structured budget framework lets you lean into growth when it matters most, diversify your investments to manage risk, and continually rebalance toward your highest-return channels. Below you’ll find three models, you can adopt one or blend all three to fit your game’s unique metrics and goals:
1. Stage-Based Budgeting
Tailor your spend according to your game’s lifecycle phase, with clear buckets for “test,” “scale,” and “sustain.”
Pre-launch / soft-launch (“Test” bucket): Reserve some of your total UA budget for experimentation across new geos, ad partners, and creative formats. Focus on validating CPI and early quality metrics (Day-1/3 retention, D1 ARPU).
Launch/ramp-up (“Scale” bucket): Once you hit your soft-launch KPIs (e.g., D1 > 30%, CPI < $2.50), shift your budget to broad channels (Meta, Google) and high-impact formats (playables, UGC) to drive installs at volume. Gradually increase spend as ROAS stabilizes.
Mature growth (“Sustain” bucket): After peak scale, allocate the remaining toward retention-focused campaigns (AA, remarketing, cross-promo) and incremental UA tests in lower-priority regions. This keeps CPMs efficient while you harvest long-term LTV.
2. Portfolio Approach
Think of each UA channel as a financial instrument in your marketing portfolio. Blend “blue-chip” mass-reach channels with “growth-stock” niche partners to balance cost, volume, and ROI.
Channel type
Example partners
Role
Broad-reach (lower ROI)
Meta, Google Ads
Primary volume drivers, scaling CPI
Niche-vertical (higher ROI)
TikTok, Unity Ads, IronSource
Targeted segments, LTV-driven scale
Emerging / test
Snap, Reddit, programmatic DSPs
Discovery of under-leveraged supply
Start with a 50/30/20 split across broad, niche, and test segments.
Weekly re-balance: increase share in channels hitting your ROAS/CPI targets; pause or trim those drifting above your efficiency thresholds.
Quarterly review: reallocate up to 10% of the overall budget to emerging platforms that are showing early-stage success.
3. ROI vs. Scale Trade-Off
Define efficiency targets (e.g., target CPI, target ROAS) and let those numbers drive dynamic budget flows.
Set channel-level thresholds, e.g., CPI ≤ $2.00 and ROAS ≥ 1.5× at D30.
Scale winners: Allocate incremental spending where CPI/ROAS fall within the target. Algorithms will optimize toward the lowest-cost, highest-value users.
Pause or pivot: Cut spend on channels trending 10–15% above the CPI target and reallocate to the test bucket or best-performing channels.
LTV-based model: Use your projected LTV-to-CPI ratio to calculate the maximum scalable spend. If LTV₍30d₎ is $5 and your CPI target is $2.50, you can profitably scale up to 2× your baseline spend on that channel.
4. Hybrid budgets
Balance short-term ROI with longer-term brand lift:
Brand/Growth reserve (tempo campaigns on TikTok, Twitch) boosts organic uplift, long-term retention, and lifts virality.
To measure the actual impact of those brand/growth investments, you can:
Leverage Marketing Mix Modeling (MMM) to isolate how your brand's spending moves the needle on key metrics like retention and revenue over time. MMM uses statistical regression to attribute lifts across all your channels and environmental factors.
Analyze post-campaign ROAS deltas by comparing your ROAS before and after your brand campaigns to quantify how much additional organic installs and lifetime value you drive.
While budget frameworks provide the structure, your success also depends on choosing the right platforms. Let's break down the strategies for key channels and explore how to maximize their potential.
Channel & Platform Strategies
Here are strategies for some key platforms:
1. Meta (Facebook / Instagram / IG Ads)
Meta remains the workhorse for user acquisition across genres, particularly when broad targeting is combined with sophisticated lookalike audiences and in-app event bidding. You should enable Campaign Budget Optimization (CBO) to allow Meta’s AI to allocate spend toward top-performing ad sets, reducing manual bid management and improving return on ad spend (ROAS).
To counter ad fatigue, cap frequency at 2–3 impressions per week per user and cycle in new creatives every 7–10 days. Rotate between Stories, Reels, playable ads, and video to keep your content fresh.
2. Universal App Campaigns (UAC)
Google's Universal App Campaigns (UAC) offer extensive reach across platforms, including Search, Play, YouTube, and Discovery. This makes them ideal for Android campaigns where automation streamlines budget management and optimization.
For iOS, Apple Search Ads (ASA) often deliver better results for high-intent installs, though costs are rising in Tier 1 markets. To optimize UAC, focus on a keyword-rich app store listing with engaging visuals and videos to boost conversions. Tailor bidding strategies based on campaign goals, target CPI for installs, and CPA for in-app actions. Diversify creative assets, including videos, images, and headlines, for A/B testing.
To optimize, integrate your ASA and UAC data in your MMP dashboard, and reallocate budget weekly based on actual CPIs and early-cohort retention. If UAC’s iOS CPIs exceed your ASA CPI by >10%, shift incremental iOS spend into ASA campaigns targeting branded and competitor keywords.
3. Unity & ironSource Ads
Run Unity Performance (CPI) or ironSource SKAdNetwork-compliant campaigns to optimize bids under ATT constraints. These “black-box” algorithms consistently meet target CPAs while ensuring compliance with privacy regulations.
Playable ads deliver up to 6x higher CTRs and conversion rates than video or static formats, and short (<20s) playable ads boost CTR by approximately 15%. Rewarded video achieves approximately 75–76% completion rates, driving 4x higher retention when introduced in Week 1. Ensure you feed high-quality creative assets into Unity’s Creative Automation tool to unlock these performance gains
Finally, by leveraging LevelPlay’s dedicated cross-promotion bidder and ironSource’s unified in-app bidding mediation, you can treat your own portfolio like another ad network, running CPI-based campaigns within your UA stack, dynamically optimizing bids against external demand, and seamlessly backfilling lower-tier geos.
4. TikTok (ByteDance)
TikTok's algorithm favors authentic, user-generated content (UGC) over polished trailers, making meme-inspired ads and creator-driven narratives highly effective.
UGC delivers up to 4× more clicks and 30% lower costs than traditional brand videos, with 22% better performance on engagement, click-through rates, and ad recall. Allocate 20–30% of your video budget to TikTok, but funnel most of that budget into creator-led UGC and meme-inspired trailers rather than high-budget cinematic spots.
Utilize trending audio clips, on-screen captions, and quick edits that mimic organic posts; this native aesthetic signals the algorithm to prioritize delivery and reduce the cost per install. Regularly test multiple formats, playables, behind-the-scenes teasers, authentic user reactions, and iterate based on performance insights to stay ahead of TikTok’s evolving preferences.
Offer AI/ML-powered, in-app programmatic buying and retargeting tailored to mobile gaming. These platforms provide granular geo, device, and audience targeting across iOS and Android, with real-time bidding on premium in-game inventory.
They enable frequency capping, dayparting, creative A/B testing, and budget automation to optimize for install-to-payer conversion and long-term lifetime value (LTV). Trade-offs include higher CPMs compared to open-exchange networks, making them best suited for high-value cohorts (e.g., whales, esports fans) and seasonally timed campaigns where standard ad-network UIs are limited.
Choosing the right platforms is just one piece of the puzzle. Next, we'll examine how to allocate your budget effectively across various creative formats to maximize engagement and ROI.
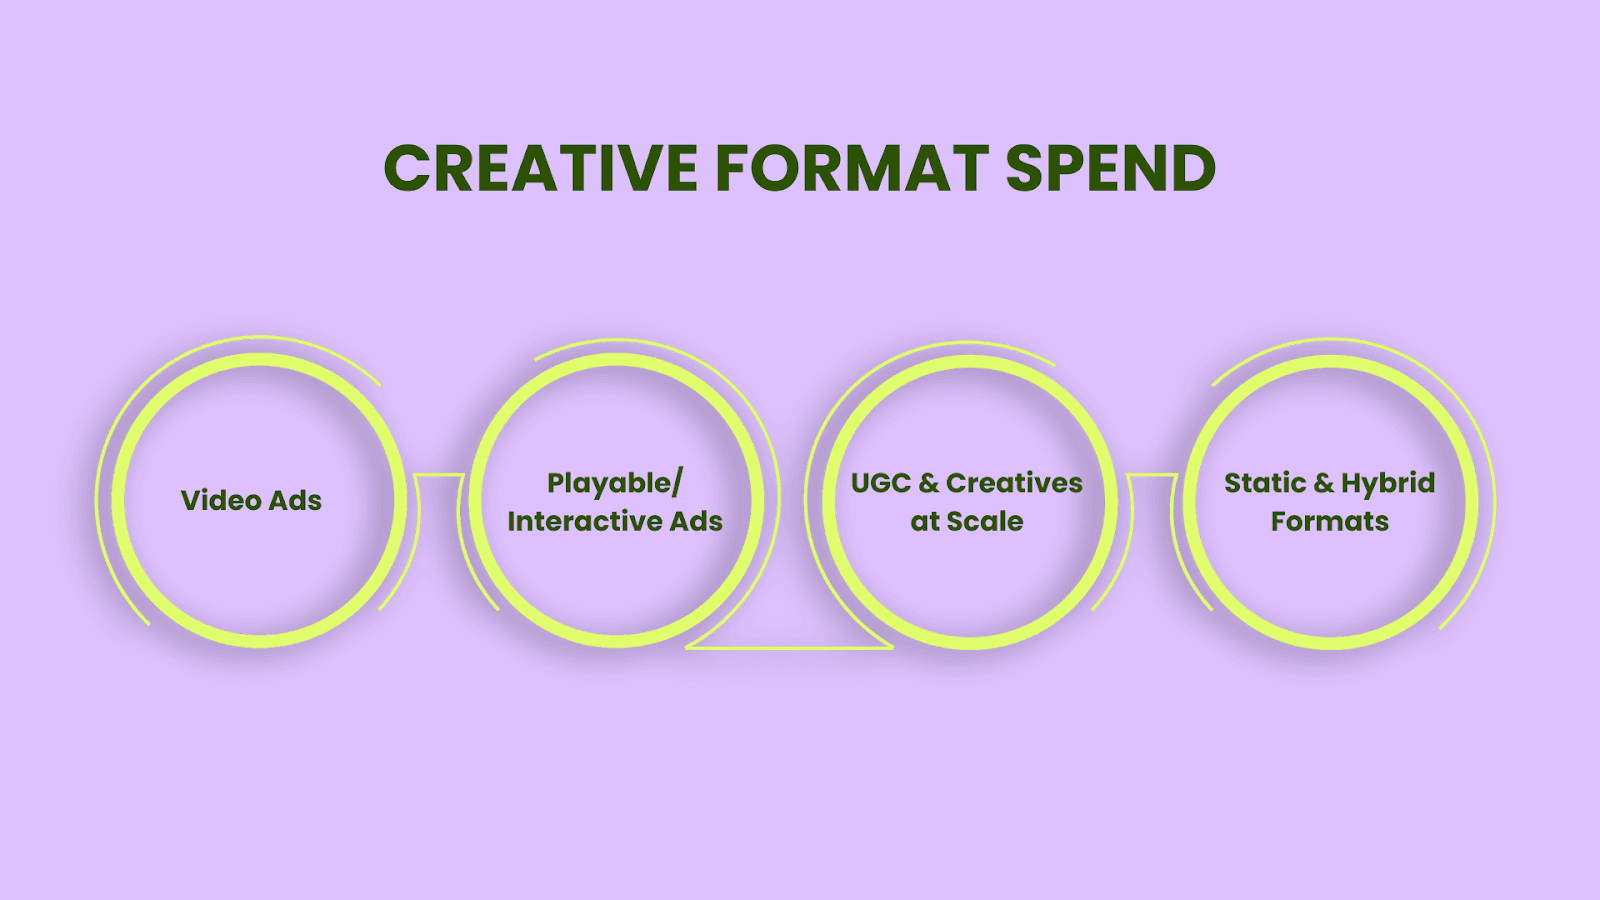
Creative Format Spend
1. Video Ads
Video ads now account for roughly 60 percent of total mobile ad budgets, making them the central pillar of your user acquisition (UA) strategy. You should allocate the bulk of your spend here, continuously refreshing 6–15 second cuts that hook fast-scrolling users.
Meta: Vertical/full-screen (4:5 or 9:16) for Reels and Stories.
Continuous testing of new video hooks is essential; experiment with different openings, calls-to-action, and emotional triggers to identify what resonates with your audience. Launch at least one new video variant per week per platform to combat ad fatigue and maximize incremental lifts.
2. Playable/Interactive Ads
Playable and interactive ads are crucial for hyper-casual and casual games, as they provide users with a "try before you buy" experience that significantly enhances conversion rates. Allocate 5–10% of your budget to playables, focusing on ad networks like Unity and Meta, which support this format. Their effectiveness stems from allowing potential players to engage with gameplay mechanics, increasing install intent and long-term retention. Closely monitor key performance indicators, particularly cost per install (CPI), install-to-Day 7 retention, and Day 1 engagement. If CPIs fall below your campaign target while retention and engagement metrics exceed industry averages, scale your playable spend aggressively.
A common approach is to increase playable allocation when these conditions persist, thereby capturing more high-value users at optimal cost. Although this dynamic scaling strategy is more resource-intensive per thousand impressions, it targets users with higher lifetime value (LTV), ultimately boosting return on ad spend (ROAS) and long-term revenue performance.
3. UGC & Creatives at Scale
Authentic, influencer-style ads on TikTok and Instagram can outperform polished commercials, especially when you leverage AI to scale.
Budget split: Reserve approx 10 percent of your creative production budget for UGC-style shoots and influencer partnerships; you’ll spend less on media since algorithmic feeds prioritize native posts.
AI Workflows: Utilize TikTok’s “Symphony Creative Studio” AI suite, which enables advertisers to create custom video content.
Measurement: Track topline engagement (shares, saves) to identify top-performing UGC assets, then port those into paid in-feed tests.
4. Static & Hybrid Formats
While video and interactive ads dominate, static and hybrid formats, such as carousels or short looping videos, serve as strategic supplements. These are particularly effective in localized markets with low bandwidth, where video ads may underperform.
When to use: Localized campaigns in regions with poor network speed or as a backup when video turnaround times spike.
Format tips: Design carousels with 3–5 cards that tell a concise story progression. For hybrid units, insert 3-second GIF-style loops that highlight in-game moments.
Keep static/hybrid spend under 5 percent of your total UA budget, focus here only when video inventory or creative capacity is constrained. As your creative formats take shape, it's crucial to tailor your spend based on geographic priorities. Let’s explore how to adjust your budget according to the performance of different markets.
In 2025, you’ll drive the most value by prioritizing Tier-1 markets (US, Canada, UK, Western Europe) with stable spend for creatives and channels, while shifting incremental dollars into Tier-2 (Eastern Europe, LATAM, SEA) and emerging markets (MENA, Africa, India) when CPIs spike in Tier-1.
1. Tier-1 Markets (US, Canada, UK, Western Europe)
You should maintain consistent investment in the US, Canada, the UK, and Western Europe, because although CPIs/CPAs are highest here, LTVs justify a premium spend.
Proven Channels & Creatives: Lean on established platforms, Google App Campaigns, Meta Advantage+, and major DSPs, and rotate top-performing video and playable ads.
Seasonality Focus: Ramp budgets during holiday peaks (e.g., Black Friday, Christmas) to capitalize on elevated consumer spending.
ROAS Monitoring: Track D7 and D30 ROAS to ensure spend aligns with payback windows; dial spend up or down based on cohort performance.
2. Tier-2 Markets (Eastern Europe, Latin America, Southeast Asia)
These regions offer lower acquisition costs and rapidly growing user bases, making them ideal for aggressive scaling. Allocate larger budgets to platforms like Google UAC and TikTok, which excel at driving volume at cost-effective rates.
While the ROI per user may be lower compared to Tier 1, the total revenue can be significant due to the larger number of users. Regularly assess performance metrics to ensure that increased volume translates into sustainable revenue.
3. Emerging Markets (MENA, Africa, India)
Emerging markets can deliver high ROAS with relatively low spend, but they require a cautious approach due to less predictable user behaviors and market dynamics. Start with small test budgets on Android DSPs and localize ad copy, visuals, and in-app messaging to resonate with regional preferences. Only scale up allocation after confirming positive ROI through metrics like CPI, retention, and ARPDAU.
4. Dynamic Reallocation
If Tier 1 markets show signs of saturation, such as rising CPIs without corresponding improvements in ROAS, consider shifting incremental budgets to Tier 2 or emerging markets, where opportunities may be more favorable. Conversely, if performance in Tier 2 plateaus, redistribute budgets back to Tier 1 or other high-performing regions. Define CPI/CPA and ROAS thresholds in your Mobile Measurement Partners (MMP) or Business Intelligence (BI) stack to trigger budget adjustments without manual intervention.
Adjusting your budget for geographical regions sets the stage, but targeting the right user segments can amplify results. Here’s how you can segment your audience to ensure your budget works harder for you.
To stretch your UA budgets further, focus on acquiring high-value users who are likely to generate significant revenue through in-app purchases (IAPs) or long-term engagement.
LTV Prediction Models
You can invest in machine-learning LTV forecasting to score new installs on predicted payback and lifetime value.
Data Inputs: Leverage first-party events (retention, session length, IAP behavior) from day 1 through day 7.
Bid Multipliers: Apply LTV scores as bid adjustments in UAC and Meta to prioritize high-value prospects.
Cohort-Based Allocation
Allocate budget against install cohorts defined by date, source, and region, focusing on those with superior retention or ARPDAU.
Rolling Analysis: Compare 30-day and 60-day retention cohorts on a weekly basis; shift more spend to channels and creatives that drive the top-performing cohorts.
Channel Pruning: Pause or reallocate channels with cohorts underperforming on D30 retention or ARPDAU targets.
Value-Based Audiences
Build lookalike and value-optimized audiences from your top-earning and most loyal players.
iOS Conversion APIs: Utilize Meta’s value optimization to target users with high-spend profiles.
Android Signal Data: Leverage Google’s first-party signals and Custom Segments for high-intent targeting.
Quality over Quantity: Gradually decrease generic prospecting budgets as value-based audience ROI proves superior.
Once you've segmented your users, it’s time to decide how to manage your budget. We’ll now discuss the balance between automation and manual adjustments to optimize your campaigns.
Automation vs. Manual Optimization
A hybrid approach combining both automatic and manual optimization can maximize the efficiency of your UA budgets.
Embrace ML Bid Strategies:
By setting baseline budgets and letting these algorithms handle bidding, you can achieve more efficient spend allocation, particularly when scaling campaigns across multiple geographies and channels. This is especially effective for managing large-scale campaigns where manual oversight would be impractical. Some primary channels:
Google App Campaigns: Set your budget and target cost/per action, then let UAC algorithms optimize across Search, Display, YouTube, and Play.
Meta Advantage+: Deploy Advantage+ campaign budgets and creative AI, which use real-time learning to maximize conversions within your daily budget.
Strategic Manual Controls
Retain manual overrides for fine-tuning and risk mitigation:
Caps & Floors: Implement daily spend caps orCPM floors for DSPs to prevent budget leakage during low-signal hours.
Dayparting: Manually schedule higher bids during peak traffic windows identified in auction insights.
Creative Rotations: Human oversight should focus on refreshing ad assets and testing new angles, rather than micromanaging bids.
Hybrid Optimization
Combine the best of both worlds:
Baseline Automation: Assign 70–80% of your budgets to ML-powered campaigns.
Experimental Bursts: Reserve 20–30% for manual, short-term tests, new geos, niche segments, creative concepts.
Review performance dashboards each morning, but let algorithms handle the heavy lifting of budget pacing and bid adjustments.
To optimize your budget allocation, you need to measure its true impact. Let’s look at how incrementality testing and Media Mix Modeling (MMM) can provide the insights you need.
Measuring Impact: Incrementality & MMM
To allocate budgets effectively, you must first understand the actual impact of your campaigns. This involves measuring incrementality, how much growth is directly attributable to your ads, and using Media Mix Modeling (MMM) to guide long-term decisions:
Incrementality Testing
Run controlled lift tests quarterly on each primary channel to isolate actual incremental performance. Meta’s Conversion Lift framework enables you to segment holdout groups and compare install rates against exposed cohorts, revealing the net new user gain per dollar spent. TikTok’s Conversion Lift Study and Geo Lift Tests support both campaign-level and region-based holdouts, proving that standard last-click models undercount mobile-game installs by up to 79%.
Google Ads offers lift and measurement studies through Performance Max or via your account team, tracking “X% lift” versus control groups to validate scale decisions under privacy constraints.
For additional rigor, consider integrating with third-party MMM solutions, such as Google Meridian or Airbridge MMM Studio, to cross-validate lift estimates and refine channel weights before implementing incremental budget growth.
MMM and Multi-Touch Attribution
In a privacy-impacted era with SKAdNetwork and limited cookies, MMM is essential for allocating budgets across paid, organic, and owned channels. MMM estimates overlap and synergy, revealing how channels interact with each other. For example, if Google campaigns cannibalize organic traffic, MMM can help guide you in rebalancing your spend.
Combining next-generation MMM with last-touch attribution (LTA) provides a full-funnel view of ROAS, capturing upper-funnel activities that LTA misses. Tools like Kochava’s Always-On Incremental Measurement (AIM) offer privacy-compliant, real-time insights without relying on user-level data.
Causal Inference
To sharpen targeting, apply uplift modeling and regression analysis on first-party signals combined with MMM insights. Uplift models identify sub-audiences, new versus likely organic converters, so you can reduce paid bids for low-incrementality segments and reallocate that budget to net new players.
When a DSP’s algorithm update triggers a dip in conversions, regression-based causal attribution pinpoints the magnitude of the shift and suggests budget pivots by month-end to alternative DSPs or ad formats. Embedding these causal inferences into your quarterly budget playbook ensures that you’re not just chasing volume but optimizing for genuine, incremental growth.
Now that you understand how to measure the impact of your campaigns, it’s essential to be able to adapt quickly. Let’s discuss how to adjust your budget midway through the quarter to ensure you're still on track.
Mid-Quarter Reallocation & Signal Loss
Mid-quarter reallocation and adaptation to signal loss ensure your budgets remain effective despite privacy constraints and platform changes.
Ongoing Monitoring
Avoid rigid quarterly budgets. Conduct bi-weekly reviews to assess performance metrics, such as Cost-Per-Install (CPI) and Cost-Per-Mile (CPM), across platforms, genres, and regions. For example:
Platform Variations: The Android CPI ($0.63) is significantly lower than the iOS CPI ($2.23).
Genre-Specific CPI: Casino games have high CPIs (iOS: $11.45, Android: $1.14), while puzzles are more cost-effective (iOS: $2.32, Android: $0.69).
Regional Differences: North America has a higher CPI ($3.59) compared to EMEA ($0.90) or Latin America ($0.55).
If an Android campaign meets targets early, increase its budget mid-cycle. Conversely, if iOS campaigns underperform, consider reallocating to Android DSPs or non-tracked formats, such as influencer marketing.
Signal Loss Adaptation
SKAdNetwork 4.0’s privacy-preserving design introduces data delays of up to 35 days across three postback windows: 0-2 days, 3-7 days, and 8-35 days. To manage this:
Leverage Hierarchical Conversion Values: Use coarse-grained (high, medium, low) values for low-install campaigns and fine-grained (6-bit, 64 variables) values for high-install campaigns.
Utilize Multiple Conversions: Track up to three postbacks per user, with the first receiving fine-grained data, enabling more profound insights into user engagement.
Adopt Hierarchical Source Identifiers: Replace 2-digit campaign IDs with 4-digit identifiers, supporting up to 10,000 combinations for detailed attribution.
To offset delayed SKAN optimizations, rebalance budgets from iOS-heavy channels to Android DSPs, web ads, Connected TV (CTV), or influencer campaigns. Server-side solutions, such as Facebook’s Conversions API, enhance iOS retargeting by providing alternative data streams.
Managing your budget throughout the quarter requires careful pacing and caps. Here's how you can prevent burnout and keep your campaigns running efficiently without overspending.
Start every new campaign with conservative pacing controls to prevent front‐loading and early budget exhaustion:
Use lifetime or phased daily caps. Instead of dumping your full daily funding on day one, cap it at approximately 30–50% of your intended daily budget and ramp up by 15–30% increments every 3–4 days as performance stabilizes. This gives the ad network’s learning phase the room it needs to find optimal audiences without depleting your budget too quickly.
Monitor pacing vs. pace‐through. Keep a close eye on your spending curve relative to the time of day and target thresholds. If you see that more than 80% of your budget is spent by midday, consider dialing back your cap for the next day or switching to a lifetime budget to even out your delivery.
Frequency Caps
Protect ROI by limiting how often the same players see your ads.
Set hard caps per user. For evergreen UA campaigns, aim for no more than 2–3 impressions per user per day. This balance ensures enough exposure to drive installs without causing irritation or blindness.
Channel‐specific tuning. On social platforms like Meta, test stricter caps (e.g., 1–2 per day) and watch your CPI curve. If your cost per install spikes when frequency exceeds your cap, tighten it or swap creatives sooner.
Creative Refresh & Rotations
Run fresh assets before they go stale; every game creative has a shelf life.
Rotate assets every 4–6 weeks. Even your top‐performing video ads should be retired after six weeks at high spend to maintain CTR and install‐rate efficiency.
Allocate a creative budget pool. Reserve approximately 10–15% of your monthly UA spend for ongoing creative production; this ensures you have replacements ready when performance dips.
A/B test 5–8 variants per ad group. Learn which angles and hooks resonate fastest, then double down on winners. This portfolio approach provides you with proactive insights and helps stave off fatigue.
Burnout Indicators
To manage ad fatigue, track key metrics across video, static, and playable ads.
For video, a drop in view rate of over 20%, a completion rate below 50-60%, or a 15% reduction in watch time signals fatigue, prompting a creative refresh.
In static ads, a 20% drop in CTR, a 15% decline in CVR, or a rising CPC/CPA suggests burnout, requiring ad rotation.
Playable ads are considered to be in a state of fatigue if the playthrough rate drops by 20% or if the average playtime falls below 20 seconds.
In all cases, avoid boosting the budget, pausing, updating, or swapping creative before reinvesting. Monitoring these metrics helps optimize budget and engagement by identifying when creatives are losing effectiveness.
Conclusion
With rising CPIs and fluctuating creative performance, data-driven strategies are critical. Smart budget allocation should align with audience demographics, campaign goals, channel performance, and financial limits. Approaches such as stage-based budgeting, portfolio models, and ROI-driven frameworks help inform better decisions.
Segwise.ai supports this with AI-powered agents that streamline user acquisition. The Creative Agent automates tagging across ad formats and surfaces detailed insights on performance drivers, such as CTAs, backgrounds, and emotional cues, tied to IPM, CTR, and ROAS.
Meanwhile, the Campaign Monitoring Agent tracks campaign data from MMPs and ad networks to flag anomalies and suggest actions on creative fatigue, targeting gaps, or budget inefficiencies. Integrating these tools reduces manual work, sharpens creative insights, and enhances campaign efficiency and return on ad spend (ROAS).
Ready to transform your user acquisition strategy? Sign up now for a 14-day free trial, no credit card or engineering resources required.
FAQs
1. How can I optimize UA spend to target high-value users?
To optimize your UA spend, focus on identifying and targeting high-value users through machine learning LTV prediction models. By segmenting users based on predicted lifetime value (LTV), you can ensure your budget is spent on users who are likely to generate significant returns over time.
2. What is the impact of rising CPIs on my UA budget?
As CPI rates rise, particularly in competitive markets such as the US and Japan, it becomes increasingly crucial to optimize UA spend effectively. You can manage this by shifting budgets to lower-CPI regions or platforms that yield high engagement, helping to maintain a balanced and efficient acquisition strategy.
3. How do I determine the best channels for my UA budget?
Analyzing channel performance is key to optimizing UA spend. By continuously testing and reallocating your budget across various platforms, such as Meta, Google, and TikTok, you can identify which channels offer the best return on investment (ROI), ensuring your spend is directed toward the most effective platforms.
4. What role does creative performance play in optimizing UA spend?
Creative performance has a direct impact on the efficiency of UA spend. Regularly refreshing your creatives and testing different formats (e.g., video, playable ads) can help reduce ad fatigue and improve engagement rates, leading to a more efficient use of your budget.
5. How can I use stage-based budgeting to optimize UA spend?
Stage-based budgeting allows you to tailor your spend to the lifecycle of your app. By allocating a larger portion of your budget to scaling during the launch phase and focusing on retention in later stages, you can optimize UA spend based on the needs of each phase, ensuring maximum ROI.
AI agents to help you unify creative data across 15+ networks, simplify creative analytics, track fatigue and generate winning ads backed by data. Get started in less than 5 minutes with our no code integrations.