How to Build a Competitor Dashboard for Insights
The global mobile gaming market generated $92 billion in 2024. This surge highlights the competition among developers as they strive to attract new players. To stay ahead, it's crucial to understand not only your performance but also how your competitors are acquiring users.
By analyzing their approaches, you can uncover valuable insights to inform your own marketing decisions. This knowledge allows you to identify effective channels, creatives, and tactics that resonate with your target audience. So, if you're grappling with questions like, "How do I identify which channels my competitors are utilizing?" or "What creative strategies are they employing to attract users?"
This blog examines the process of creating a competitor dashboard to collect key data from competitors. We'll explore how to monitor your competitors' advertising strategies, assess their creative approaches, and use this information to enhance your user acquisition efforts.
What is a Competitor Dashboard?

When you’re handling user acquisition for mobile games, you need a clear view of what other titles in your genre are doing. A competitor dashboard is a manually updated report that gathers and displays your rivals' key insights in one place. Since you can’t directly pipe competitor performance data, you pull information from tools like Sensor Tower and AppMagic and add it to your dashboard.
The Competitor Dashboard helps you identify which ads are performing best, which games are generating the most installs, and when your competitors are launching new features or updates. By examining this data, it becomes easier to identify trends, determine what’s working, and adjust your strategy to achieve better results.
Now that you know what a competitor dashboard is, let’s look at why it’s a must-have tool for mobile game developers.
Why Mobile Game Developers Use a Competitor Dashboard
A clear view of your rivals’ moves can spark smarter UA decisions. By manually gathering public data and organizing it in a simple dashboard, you turn scattered signals into actionable insights. Here are the key advantages you gain when you use a competitor dashboard to guide your user acquisition efforts:

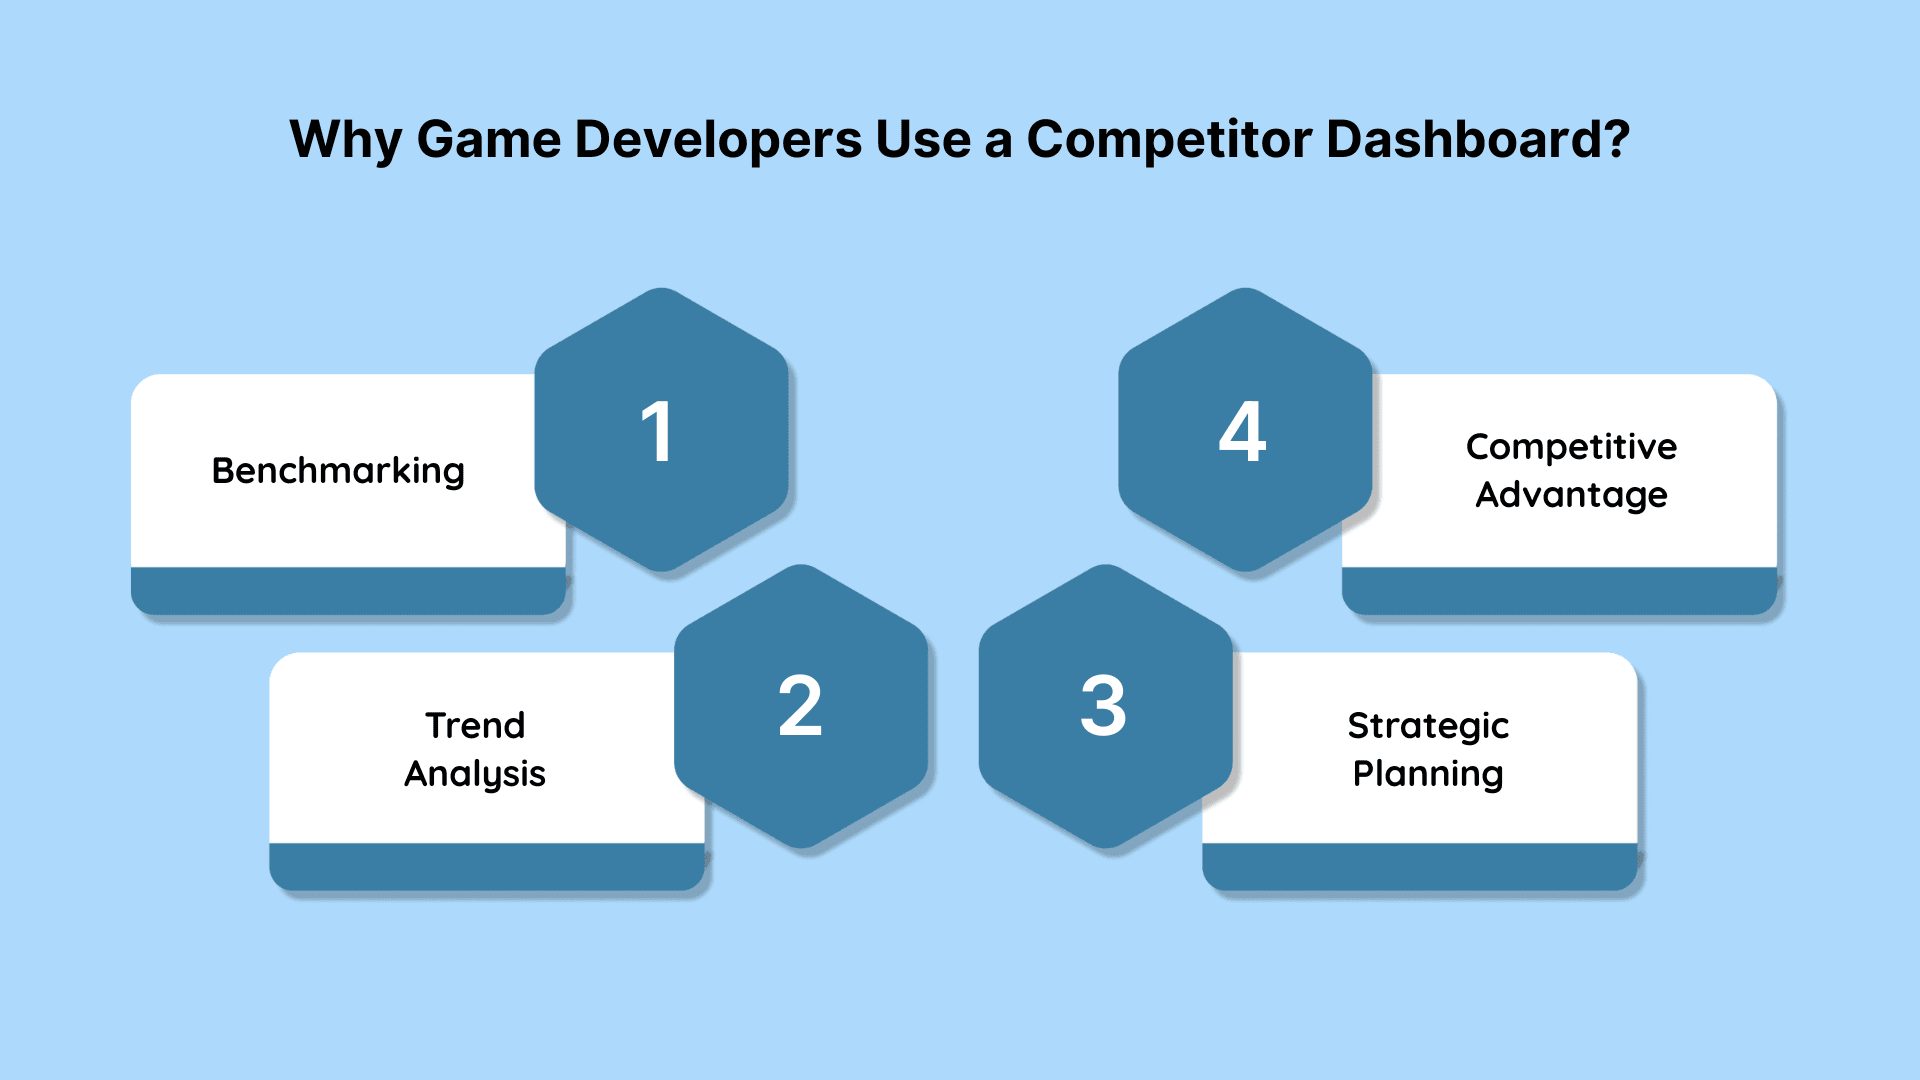
Benchmarking: You can see how your installation numbers, ad spend, and engagement compare to those of leading titles. This helps you spot where you’re underperforming and what you need to improve.
Trend Analysis: You track shifts in downloads, revenue estimates, and creative tactics over time to catch rising genres and successful ad formats early. That way, you can tweak your approach before your rivals do.
Strategic Planning: You gather insights on competitors' feature updates, live ops pushes, and market moves to inform your next campaign. With precise data on what’s working, you can plan UA budgets and creatives with confidence.
Competitive Advantage: Gain a deeper understanding of competitors' strengths and weaknesses, enabling you to capitalize on opportunities and mitigate threats.
Now that you know why a competitor dashboard matters, let’s break down how you can build one that delivers UA insights.
Also Read: Innovative Gaming Trends Shaping 2025
How to Create an Effective Competitor Dashboard

Gaining a clear understanding of what other games are doing can help you identify new ad opportunities and refine your campaigns. Below is a simple, step-by-step guide to set up a manual competitor dashboard for your mobile game’s user acquisition efforts:
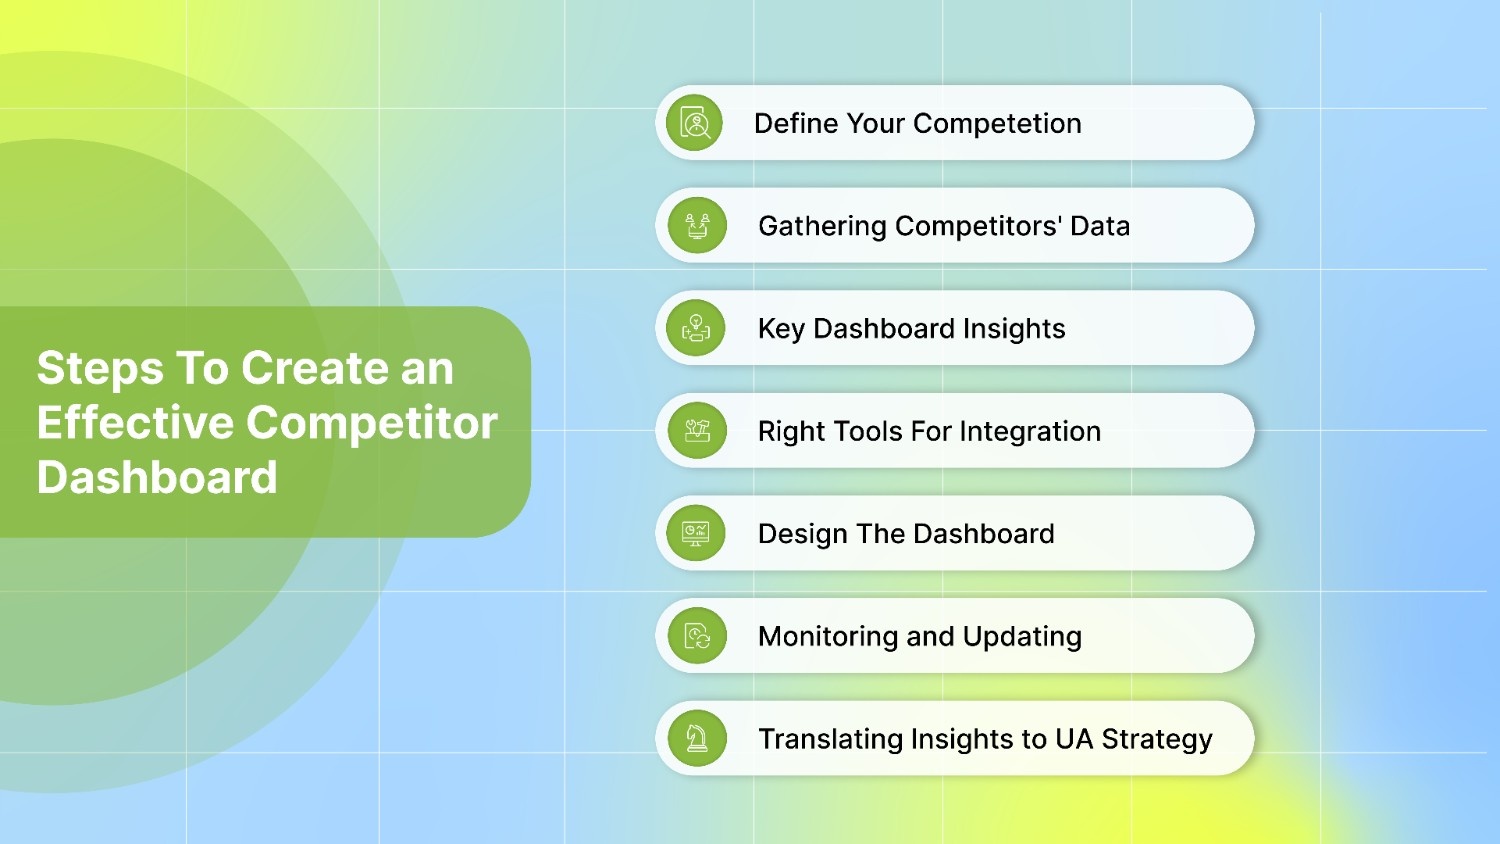
Step 1: Define Who You’re Competing Against
First, decide whose performance you want to track:
Direct competitors: Direct rivals are games in your genre or with similar mechanics (for example, Royal Match vs. Matchington Mansion).
Indirect competitors: Indirect rivals compete for the same players or ad space (say, casual match‑3 vs. idle clickers).
You can find top apps on the App Store and Play Store charts, or click “Similar apps” on each game’s page to see the most related titles. ASO platforms (like AppTweak or FoxData) can automatically list competitors based on shared keywords or high download volumes. Once you have a list, classify competitors to prioritize analysis.
Step 2: Gathering Competitors' Data
App Store Metrics: Pull data on each competitor’s chart rank, estimated downloads/installs, and search keywords. Tools like AppTweak, Sensor Tower, or MobileAction provide historical rank and download trends. Track which search terms competitors rank in (especially top-10 results) to reveal which keywords drive visibility.
Listing Metadata: Collect each app’s store listing details, including title, subtitle, keyword list, and description text. These reveal competitors' ASO strategies. Also, save their creative assets such as app icon, promotional screenshots, and preview video clips. Analyzing these images and videos helps you see how they market the game to users.
Creative Ads (UA Assets): If available, gather any competitor ad creatives (video ads, playable demos, banner images) from ad intelligence tools or public channels. Examining top-performing ad creatives can reveal which visuals and calls to action resonate with players.
Reviews & Ratings: Scrape competitor user ratings (average stars) and a recent sample of reviews. This user feedback uncovers strengths and weaknesses. For example, reading reviews shows what players “love” or “hate” about the game. Common complaints (bugs, difficulty, UI issues) and praise (fun features, art style) are gold for shaping UA messaging.
Step 3: Key Dashboard Insights
App Store Performance: Track competitors' category chart positions and keyword rankings over time. Compare month-to-month or week-to-week trends. A rising chart rank may indicate a successful UA push or update. Watch for spikes or drops (e.g., a competitor jumped to the top of the charts in March). Question what changed (new feature, updated visuals, etc.).
Keyword & ASO Stats: On the dashboard, show each competitor’s top search keywords and position. For example, list “#1 ranked keywords” or a table of search terms where rivals appear in the top 5. Identifying these terms (and keywords they missed) helps refine your own ASO
Creative Assets: Include snapshots of competitor icons/screenshots or thumbnails of video ads. Note design styles and messaging. For instance, note whether a top competitor’s icon features bright colors and a stylized logo, or if their initial screenshots emphasize social features.
You can borrow high-conversion visual ideas, e.g., FoxData advises to “borrow high-conversion icons and screenshot designs to strengthen visual assets. Track when competitors update these assets (new screenshots often mean a feature launch or A/B test).
User Feedback: Visualize review sentiment and ratings. A chart of rating distribution (count of 1–5 stars) or a word cloud of frequent review terms can be helpful. Highlight common praise (“great graphics”, “fun gameplay”) versus complaints (“too many ads”, “buggy”).
As AppTweak suggests, analyze ratings to see what competitors do well: recurring positives are elements you might emulate, while recurring negatives are opportunities to differentiate.
Step 3: Choose the Right Tools For Data Integration
To power your dashboard, select tools that allow you to export the exact competitor data you need. Below are some trusted platforms:
AppTweak: AppTweak provides no-code exports of App Store and Google Play metrics. You choose which apps and which data (rank history, download estimates, keyword positions, review snapshots) you want, then schedule daily or weekly reports.
Exports arrive as CSV files (or via email, Slack, AWS S3, or Google Cloud Storage), allowing you to upload them directly into your dashboard. Its new REST API also allows you to retrieve metadata, titles, descriptions, icons, screenshots, and ASO data programmatically in JSON format.
Sensor Tower: Sensor Tower’s Data Feed (historically known as 'Connect') delivers historical rank trends, download estimates, keyword ranking, and ad‑creative exposure data via scheduled exports.
For ad creatives specifically, App Advertising Insights exports top-performing video and banner ads, so you can see which creatives drive the most installs.
MobileAction: MobileAction can combine Apple Search Ads performance data with ASO metrics when you connect your Apple Search Ads or App Store Connect account via MMP or official APIs.
Their API also supports ASO, Ad Intelligence, and Market Intelligence endpoints, allowing you to automate the export of keyword ranks, creative assets, and ad data directly into your BI system.
FoxData: FoxData (formerly AppLyzer) provides a Report Generator and REST API for extracting competitor insights. You can download CSVs of search‑keyword performance, historical rank trends, and user‑review translations.
Its API endpoints deliver keyword suggestions, metadata snapshots, and review sentiment for up to 155 app stores in real time. Simply point your dashboard at the CSV exports or API, and FoxData feeds your charts and tables without manual copy‑paste.
App Radar: App Radar combines ASO and competitor intelligence into one platform. Its Competitor Intelligence module tracks metadata updates (titles, screenshots, videos), keyword performance, and store feature placements.
You can browse top competitor creatives in a gallery view. For seamless integration, App Radar’s REST API exposes app store metrics, ranks, keyword indexes, and ratings over time, so you can schedule CSV exports or query data on demand and feed it straight into your custom dashboard.
By choosing one or more of these tools, you’ll get reliable CSV or API feeds with the exact competitor data you need for your dashboard. However, full access is only available on paid plans. Without a subscription, you won’t get the complete data, especially if you need API access, which can be quite expensive.
If you're specifically looking to track competitor ad creatives, Segwise’s Free Competitor Ad Tracker is a solid choice. It enables you to quickly and efficiently monitor your competitors' latest creatives.
Step 4: Design The Dashboard
Layout: Organize your dashboard into clear sections or tabs to easily find insights at a glance. For example, create a “Competitor Overview” tab that displays overall rank and installation trends, an “ASO Metrics” tab with keyword and metadata comparisons, a “Creative Gallery” tab featuring icons and ad thumbnails, and a “Review Insights” tab for ratings and user feedback.
Keep the navigation simple by using labels that match your team’s daily workflow, so everyone knows exactly where to look.
Charts: Use line graphs to track download and chart‑rank trends over time; this helps you spot when rivals launch UA pushes or updates. For keyword performance, bar charts make it easy to compare ranking positions side by side and identify gaps that can be exploited.
When displaying reviews and ratings, include a table or histogram of star counts, and add image snapshots or thumbnails of top creative assets directly on the page, allowing you to compare visuals without leaving the dashboard.
Interactivity: Build in filters that allow you to drill down by region, enabling you to see which competitors are dominating specific markets or countries. Allow date‑range selectors to focus on recent UA campaigns or seasonal events and compare them to historical baselines.
Add toggle controls for viewing different genres or player segments. This way, you can tailor the view to your current ad strategy and see data that matters most.
Step 5: Monitoring and Updating
Regular Refresh: Update competitor data on a set cadence (e.g., monthly or quarterly) as recommended by experts. The mobile app market moves quickly, so stale data can mislead.
Automated Alerts: Set up automated alerts that trigger when key metrics move sharply, such as a rival breaking into the top 10 or a sudden drop in average ratings. Deliver those alerts via email or in your team’s messaging channel, so you can react without having to manually check the dashboard every day.
Step 6: Translating Insights to UA Strategy
ASO Improvements: Use competitor keyword gaps to optimize your store listing. If a top competitor ranks for “idle RPG game” but you don’t use that phrasing, consider adding it.
Creative Inspiration: Adapt successful visual themes from competitor ads. If competitors' ads are beating yours, study their pacing or hooks and iterate your creatives accordingly.
Addressing Weaknesses: Utilize review insights to refine your UA messaging. If competitors get bad reviews for a clunky tutorial, emphasize your easy onboarding in user acquisition materials. Highlight areas where your game fixes a rival’s pain point.
Benchmarking: Continuously compare your UA KPIs (e.g., organic installs, conversion rate, return on ad spend) against those of your competitors to identify areas for improvement. A competitor dashboard makes it easy to identify areas where your game lags in specific metrics, signaling where to investigate further.
By following these steps, you’ll have a custom dashboard built from reliable exports and a clear line of sight into your rivals’ UA moves. With this in place, you can turn their data into ideas that grow your user base.
While building your dashboard is a strong start, using advanced tools can take your competitor analysis to the next level. Here is how Segwise explicitly helps you track your competitors latest creatives.
How Segwise Performs Competitor Analysis

Segwise, an AI-powered platform, offers a Free Competitor Ad Tracker, a powerful tool designed to simplify your Meta ads competitor analysis. Simply enter the competitor's meta page ID or meta ad library URL in the “competitors” tab of the tool. By automating the process, Segwise lets you focus on strategic decision-making.
Here is how Segwise helps in the competitor analysis:
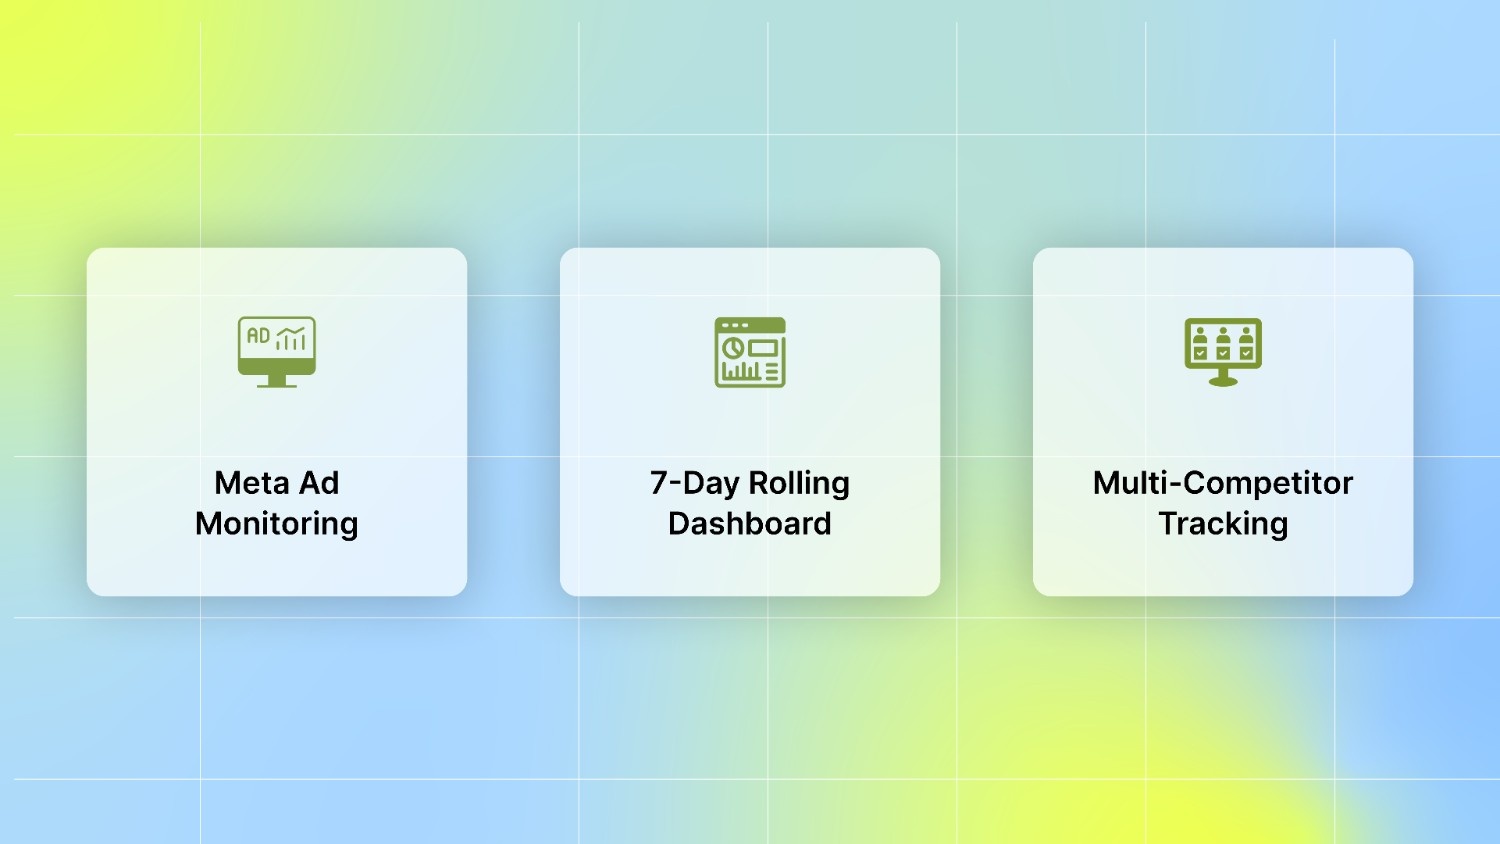
Meta Ad Monitoring: Segwise continuously scans the Meta Ad Library, enabling you to track up to five competitors and view their newest ads within hours of launch. This feature eliminates the need for manual look-ups, ensuring you stay updated with the latest ad creatives and strategies.
7-Day Rolling Dashboard: The intuitive dashboard presents ads from the past seven days, providing a clear and current view of your competitors' activities. This approach helps you focus on what's working now, rather than outdated campaigns.
Multi-Competitor Tracking: Monitor up to five different competitors simultaneously in a single dashboard. This feature enables you to compare creative formats, messaging, and ad types side by side, helping you identify emerging trends and common tactics among your competitors.
By using Segwise’s Free Competitor Ad Tracker, you can gain valuable insights into your competitors' user acquisition strategies, enabling you to make informed decisions and enhance your campaigns.
Now that you know how Segwise approaches competitor analysis, it’s equally important to understand what to do and what to avoid when building and using your own dashboard.
Also Read: Optimization Techniques for Meta Ad Campaigns in Mobile Gaming
Best Practices & Pitfalls
A reliable competitor dashboard gives you the insights you need to steer your user acquisition efforts in the right direction. Follow these guidelines to keep yours accurate and actionable:
Do:
Refresh data on a weekly or monthly basis to keep insights current.
Track a mix of top-charting titles and up‑and‑coming games so you don’t miss emerging threats or opportunities.
Monitor creative and listing updates on competitor profiles to see how changes affect rankings and download volumes.
Don’t:
Copy competitor strategies blindly. Always validate any new tactic with small‑scale tests before rolling it out.
Ignore user reviews; they reveal what players love or dislike and can guide your organic UA efforts.
Let your dashboard sit without updates. Manual checks and updates help you use real numbers when making choices.
Conclusion
Building a competitor dashboard is essential for gaining actionable insights for your user acquisition strategies in the mobile gaming industry. By systematically tracking your competitors' advertising strategies, creative approaches, and performance metrics, you can identify trends, benchmark your efforts, and refine your campaigns. This proactive approach empowers you to make informed decisions, optimize your user acquisition strategies, and stay ahead in the market.
Are you also seeking a solution to monitor your competitors' advertising strategies? And also want to take your user acquisition strategies to the next level? Start your 14-day free trial today and discover how Segwise can enhance your approach to competitor analysis and campaign optimization.
FAQs
1. How do I identify which competitors to track for user acquisition insights?
Start by analyzing games within your genre or those targeting similar audiences. Utilize tools like App Store charts, ASO platforms, and competitor analysis tools to identify top-performing titles. Classify them into direct and indirect competitors to prioritize your analysis effectively.
2. How do I ensure the accuracy of the data in my competitor dashboard?
Cross-reference data from multiple reliable sources to validate its accuracy. Implement data cleaning processes to remove inconsistencies and ensure that your dashboard reflects the most accurate and up-to-date information.
3. What are the benefits of building a competitor dashboard for user acquisition?
A well-constructed competitor dashboard provides actionable insights that can inform your marketing strategies, optimize ad spend, and improve user targeting. It enables you to stay ahead of market trends and make data-driven decisions to enhance user acquisition efforts.
Comments
Your comment has been submitted