Top Alternatives to Motion for Ad Creative Analytics
Have you ever looked at your creative performance dashboard and still felt unsure why your best ads suddenly stop converting?
You’re scaling budgets, producing dozens of variants, and running cross-network campaigns, yet your team is still guessing which hooks, dialogs, visuals, or concepts are converting. And in user acquisition, guessing is expensive; it kills budgets, slows creative iteration, and makes every campaign feel riskier than it should.
Tools like Motion help you view creative performance, but you're still not getting the depth you need to make confident creative decisions. This blog covers the best creative analytics alternatives to Motion so you can understand which concepts to scale, which creatives are declining, and what’s truly driving results across your campaigns.
Why You Need an Ad Creative Analytics Tool
An ad creative analytics tool helps you understand why your ads perform the way they do. It doesn’t just show impressions, clicks, or ROAS; it breaks down the exact creative elements driving that performance.
You see which creatives influence conversions and overall UA efficiency. For teams running fast creative cycles, this becomes the source of truth for what to scale and what to stop.
Here are the main reasons you need a dedicated ad creative analytics tool: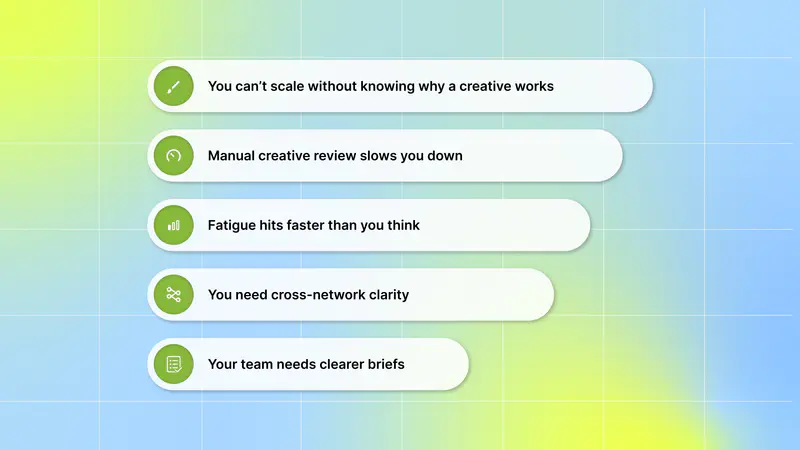
1. You can’t scale without knowing why a creative works
It’s not enough to see that an ad performed well; you need to know which part of it worked. Whether it’s the hook, product angle, CTA, gameplay moment, or storyline, understanding the exact creative element behind the performance helps you repeat winning patterns instead of guessing.
2. Manual creative review slows you down
If you’re watching videos, tagging elements, or checking multiple ad dashboards, you’re losing hours every week. A creative analytics tool automates tagging and analysis so you spend less time sorting data and more time producing high-performing ads.
3. Fatigue hits faster than you think
Whether you run mobile game ads, DTC product creatives, subscription funnels, or multi-client agency campaigns, fatigue kills performance quickly. Creative analytics helps you spot decline before it impacts ROAS so you can refresh creatives on time.
4. You need cross-network clarity
Meta, Google, TikTok, Snap, and DSPs all show data differently. Creative analytics gives you one unified view across networks, so you no longer jump between dashboards to understand what’s happening.
5.Your team needs faster, clearer creative briefs
Creative teams move faster when they know exactly which elements drive results. A strong analytics tool turns performance into insights, helping you build briefs that actually work instead of relying on gut feeling.
Once you understand why creative analytics matters, the next step is to evaluate whether your current tools provide the depth you need.
What Is Motion and Where It Falls Short?

Motion is a creative analytics platform that helps you review how your ads perform across Meta, TikTok, YouTube, and LinkedIn. It focuses on showing you which creatives are winning, why they might be working, and what patterns you can use in your next round of production.
Key Features
1. Automatic grouping of creatives to show trends: It groups similar creatives together so you can find winning patterns. Instead of looking at single ads, you see groups of creatives that share the same theme, angle, or structure.
2. Creative filtering with performance metrics: It lets you filter by naming conventions, product categories, custom conversions, Northbeam data, and performance metrics. This helps you dig deeper into what lifted revenue or engagement.
3. Frame-by-frame creative analysis: Motion helps you understand why certain videos work by breaking them down frame-by-frame. You can review drop points, placements, and demographic performance to improve future iterations.
4. AI-powered recommendations for hooks, headlines, and creative ideas: Motion’s AI analyzes your Meta ad data and generates ideas for what to try next. It gives you suggestions for hooks, headlines, and creative angles based on what has performed well before.
5. Track ads launched by competitors: Motion’s AI agent hunts down the latest ads from your biggest rivals and builds you a plan to beat them. Learn, adapt, and ship faster.
Where Motion Falls Short
Even though Motion is helpful for high-level creative understanding, it has several limitations. Here’s where Motion struggles for fast-moving performance teams:
1. No integration with MMPs and CDPs
Motion does not connect with your attribution or customer data platforms.
If you rely on Appsflyer, Adjust, Singular, Segment, or mParticle, you can’t fetch data to gain deeper insights. This means you only see platform-level performance, not the full impact of each creative.
2. No creative fatigue detection or proactive alerts
The platform doesn’t warn you when a creative starts to decline. Without proactive alerts, you often notice performance drop only after your ROAS has already fallen.
3. No playable ad analysis
If you run playable ads, this platform can’t analyze or tag the interactive elements inside your creatives. Playables depend heavily on micro-moments. Without this level of insight, it’s hard to understand why some playables drive better IPM, CTR, or install quality.
4. No in-depth Studio View for multi-app
Motion doesn’t offer a “Studio View” or portfolio-level dashboard for managing multiple apps, products, or clients in one place. If you’re publishing multiple mobile games or subscription apps, switching between accounts becomes slow and messy. You can’t standardize insights, compare performance across projects, or monitor everything from a unified place, which is essential for high-volume UA teams.
Now that the limitations are clear, it’s essential to identify which platforms offer the depth and clarity required for smarter creative decisions.
Also Read: Top Creative Analytics Platforms for DTC Brands
Best Alternatives to Motion for Smarter Ad Creative Analytics
If you’re looking for deeper insights beyond surface-level dashboards, there are platforms built specifically to optimize creatives at scale. These tools go beyond just tracking metrics; they connect creative elements directly to outcomes.
Here are the top alternatives that deliver smarter, faster, and more actionable creative analytics:
1. Segwise

Segwise is an AI-powered creative analytics platform that helps UA and growth teams understand exactly which ad creatives and elements drive performance across Meta, Google, TikTok, and more. It automatically tags creative elements such as hooks, characters, and CTAs, and maps them directly to key UA metrics, including ROAS, IPM, and CTR. Segwise unifies creative and performance data into one place so you can make faster, data-backed decisions instead of guessing what works.
Key Features
1. Better Team Collaboration: Segwise lets you invite teammates with role-based access so everyone sees only the data they need. You can share clean, easy-to-read reports with UA managers, creative leads, or clients without overwhelming them with unnecessary numbers. This helps your whole team stay aligned on what’s performing and what to test next.
2. Comprehensive Dashboard: You get a unified view of all your creative and performance data across every ad network and MMP. Instead of jumping between Meta, Google, TikTok, and attribution dashboards, Segwise brings everything together in one place, saving you hours of manual reporting.
3. Performance Data Mapping: It connects creative elements directly to ROAS outcomes. You can see which hooks, dialogs, scenes, visuals, product shots, or gameplay clips actually drive results. This is especially useful when you need to prove why a certain ad is winning and where your next iteration should focus.
4. Data-Backed Creative Iteration: You no longer guess what to produce next. Segwise shows you which creative ideas, storylines, themes, and concepts are working based on performance data from ad networks and MMPs. This helps you scale winners faster and cut losers before they waste budget.
5. Tag-Level Performance Optimization: The platform automatically tags creative elements and shows you which specific components move the needle like hooks, characters, CTAs, color styles, emotions, or gameplay moments. You get a clear view of what consistently performs across campaigns and channels.
6. Multi-Project Management (Studio View): If you run UA for multiple games, brands, or clients, it gives you a Studio View to manage everything from one dashboard. You can switch between apps or accounts instantly and keep performance tracking consistent across your entire portfolio.
Why Segwise Is the Best Alternative
Segwise addresses the biggest gaps Motion can’t, such as fatigue detection, and full integration with MMPs and CDPs. You get a deeper, element-level view of what actually drives ROAS across every channel you run. Segwise also offers Studio View for managing multiple apps or clients, making it a stronger choice for fast-moving UA teams that need clear insights, not just dashboards.
Limitation
Segwise doesn’t offer instant, self-serve pricing. You’ll need to speak with the team to get a tailored quote, which may slow things down if you’re trying to evaluate tools quickly.
In short, the buying process may feel less plug-and-play, but the depth of insights you get far outweighs this extra step. With tag-level creative element mapping, cross-network visibility, MMP integration, and automation, Segwise stands out as the clear winner among all options.
2. Magicbrief

MagicBrief is a creative analytics and ad research platform that helps your team understand what’s working across Meta, TikTok, YouTube, and LinkedIn. It turns messy ad data into clear insights so you can make smarter creative decisions fast.
Key Features
1. Identify Winning Ad Traits: It helps you compare how different creators, themes, hooks, and copy styles perform. This makes it easier to see what’s resonating with your audience so you can double down on elements that consistently win.
2. Prebuilt Creative Reports for Faster Decision-Making: You can generate instant creative reports without manually building dashboards. These reports highlight your top creatives, best hooks, strong landing pages, and top copy, giving you immediate direction on what to scale next.
3. Live Collaboration & Shareable Reports: It lets you tag teammates, leave context, and maintain a fast creative feedback loop. You can also build clean, shareable creative reports that help teams or clients understand performance without the need for complicated data exports.
Why Magicbrief Is the Better Alternative
MagicBrief offers deeper creative performance insights, structured reports, and built-in competitor tracking. It helps you not only save and organize ads, but also understand why they work through data-backed scoring, automated suggestions, and trend visibility.
Limitation
However, it lacks the multi-network, MMP-connected insights and element-level creative mapping needed to understand, which limits its usefulness when you need more than surface-level creative comparisons.
3. Tryatria

TryAtria is an AI-powered ad engine that helps teams discover ideas, analyze performance, and create high-impact ads faster. With its AI insights and organized dashboards, TryAtria makes it easier to understand what’s working and turn that into better ad production.
Key Features
1. AI Insights for Optimization: Its AI automatically highlights important performance signals and offers suggestions for creative or campaign adjustments. This helps you identify opportunities you might otherwise miss.
2. Goal Tracking & Progress Monitoring: You can set creative or performance goals and track progress directly inside the platform. This makes it easy to monitor whether your ads are moving in the right direction over time.
3. Customizable & User-Friendly Dashboards: Tryatria gives you clean visuals and the ability to filter results for deeper analysis. The interface makes creative performance easier to understand for everyone on your team.
Why Tryatria Is the Better Alternative
Tryatria brings together analytics, research, creation, and asset management in one place, giving creative teams more than just an inspiration board. It provides quick insights, AI-recommended improvements, and clear visual dashboards.
Limitation
However, it doesn’t offer detailed element-level breakdowns or multi-network performance mapping, both of which are essential for understanding what actually drives results.
4. Vidmob

Vidmob is a creative analytics platform that helps teams understand which creative strategies work best across audiences, regions, and platforms. It tracks how people respond to different messages, visuals, and concepts so you can turn those learnings into better creative decisions. Vidmob connects creative performance to business outcomes, making your production process more informed and more effective.
Key Features
1. Audience Response Tracking: The platform tracks how different versions of your creative messaging, visuals, brand claims, and concepts impact results. This makes it easier to see which choices are helping or hurting ad performance.
2. Full Creative-to-Business Measurement: It helps creative leaders stop guessing. It connects creative decisions directly to business outcomes, giving you clarity on which creative approaches move the needle and which do not.
3. Predictive Creative Analysis for Media Teams: Media teams can use Vidmob’s predictive scores to understand which ads are likely to perform well before they run. This helps avoid wasting money on underperforming assets.
Why Vidmob Is the Better Alternative
Vidmob goes far deeper than basic asset organization. It provides creative strategy insights, audience response tracking, and predictive analysis, areas where Motion is limited. Instead of simply showing performance dashboards, Vidmob helps teams understand why their creative is not performing well and how to improve it.
Limitation
However, Vidmob does not offer “Studio View,” which lets you switch between multiple projects, apps, or accounts in a single unified workspace. Managing several creative streams requires jumping between different views rather than monitoring everything at once.
5. Darwin

Darwin is an intelligent, creative analytics platform that helps brands understand which creative elements truly drive performance. It focuses on measurable results, giving you actionable insights from your existing campaigns so you can confidently produce ads that convert.
Key Features
1. Intelligent Creative Analysis: Darwin analyzes individual creative elements like text size, logo placement, tone, aspect ratios, and visual styles. The platform pinpoints which traits are lifting or hurting performance, helping your team understand what actually works in your ads.
2. Actionable Optimization Insights: It helps you identify performance drivers early and guides your creative testing strategy, ensuring new ads are built around what converts.
3. Creative Network for Scaling Output: Darwin includes a creative network, enabling you to collaborate with vetted creative talent directly inside the platform. This makes it easier to scale production.
Why Darwin Is the Better Alternative
Darwin provides deeper analysis, customizable tracking, and data-backed creative recommendations, areas where Motion is more limited. Motion focuses mainly on performance dashboards, but Darwin goes further by showing exactly which visual and textual attributes affect KPIs, helping you make creative decisions rooted in analytics.
Limitation
It doesn’t provide dedicated insights for playable ads. There’s no feature for breaking down interactive elements, user flows, or engagement points within playables, which makes it harder for teams relying on playable formats to understand what’s driving conversions or where users drop off.
Also Read: Segwise vs Motion: Choosing the Right Creative Analytics Tool
Conclusion
Finding the right ad creative analytics tool is essential for fast-moving teams that need clarity, not guesswork. While Motion provides insights, it lacks deeper features such as fatigue detection, playable ad analysis, MMP integration, and multi-project visibility. Alternatives like MagicBrief, Tryatria, Vidmob, and Darwin offer different features for complete performance understanding.
For teams that need full, actionable creative analytics across networks, Segwise delivers unmatched value. Its creative analytics deliver features, from tag-level creative element mapping to studio view, enabling teams to connect creative performance directly to business outcomes.
Here’s why it stands out as the best alternative option:
Cross-Platform Integration: No-code integrations with Meta (Facebook/Instagram), Google, TikTok, Snapchat, YouTube, AppLovin, Unity Ads, Mintegral, IronSource, and more. Setup takes just 10–15 minutes with no engineering support needed.
MMP Integration: Easily connect to AppsFlyer, Adjust, Branch, and Singular for unified attribution data alongside ad network metrics.
Historical Data Import: Automatically import up to 90 days of historical data during setup, delivering actionable insights from day one.
Creative-Level Performance Monitoring: Track impressions, clicks, installs, CPI, ROAS, CTR, CVR, spend, and even custom events all at the creative level.
Studio View: Manage multiple apps, games, or brands from a single dashboard, ideal for agencies, studios, and portfolio teams.
Card View: A visual-first performance analysis mode that lets you view creative thumbnails with key metrics, replacing spreadsheet clutter.
Custom Dashboards: Tailor your analytics workspace with dashboards built around your specific workflow and reporting needs.
So, are you ready to upgrade your creative analytics? Start your free trial today and turn creative data into performance gains!
FAQs
1. How do creative analytics tools differ from traditional ad reporting?
Creative analytics tools go beyond basic metrics like clicks and impressions—they break down creative elements to show which visuals, hooks, and formats drive results, rather than just reporting performance.
2. Can creative analytics platforms analyze individual ad components?
Yes, some tools provide element-level analysis or frame-by-frame breakdowns, scoring specific parts of a creative like hooks and CTAs to show what drives conversions.
3. Is it possible to link creative analytics with MMP or attribution data?
Yes, the most advanced platforms like Segwise integrate with mobile measurement partners (MMPs) to tie creative performance directly to installs, revenue, and lifetime value.
