Analyzing Paid Ad Performance: Metrics, Tools, and Optimization Strategies
You’re tired of guessing which ads actually bring value. When you focus on analyzing paid ad performance, you stop wasting budget on clicks that don’t turn into long-term users. Privacy changes and new platform rules mean raw click counts are often incomplete, so you need ways to read blurred signals and still make clear decisions.
At the same time, ad platforms now use more automation and AI (such as Advantage+ on Meta or Performance Max on Google) to place and build ads for you. That helps scale, but it can hide which creative or setting truly moved the needle. Understanding how automation works and where to add manual checks is essential to maintain control over performance and costs.
To know what your ad spend really did, you’ll also need proper lift tests and holdouts. Simple platform reports can show correlation; incrementality tests show cause. Use those tests to identify which channels and creatives drive real growth rather than just shifting existing demand.
In this blog, we’ll cover the key metrics you must watch, the tools that save hours of manual work, and simple optimization tactics and tests that prove real value so you can scale what works and stop the waste.
Why Paid Ad Performance Analysis Matters
When you stop guessing and start measuring, every dollar you spend tells a story. Regular analysis helps you:
Find which ads actually drive value, not just clicks.
Decide where to shift the budget to scale wins and pause waste.
Improve creative and messaging based on real performance signals.
Forecast revenue and set realistic bids and budgets.
Top performance teams now tie ad metrics to revenue windows (30/60/90 days) and use multi-source reporting to avoid fragmented views. These practices let you make faster, safer budget decisions.
Knowing that analysis matters is only the first step. The next step is to focus on metrics that reflect progress from ad exposure to real value.
Key Metrics for Analyzing Ad Performance
Understanding paid ad performance is not about tracking every number available. It is about focusing on the metrics that show how your ads are delivered, how people respond, and whether your spend turns into real value. The metrics below follow the natural flow of an ad journey, starting with visibility, moving to engagement and conversion, and ending with long-term business impact. This structure helps you diagnose issues faster and optimize with confidence.
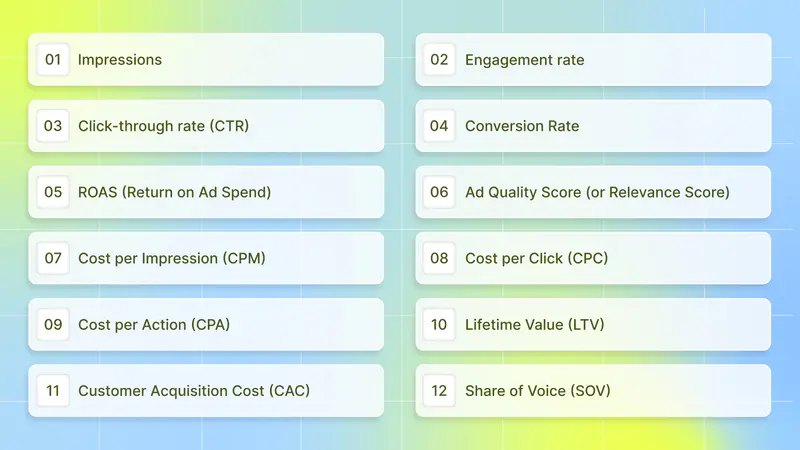
1. Impressions
Number of times an ad is shown.
Why it matters: Impressions measure reach and awareness. They show whether your creative and targeting are getting in front of people.
How to use it: Compare impressions with your audience size and campaign settings. If impressions are low and budget is available, broaden targeting or increase bids. If impressions are high but engagement is low, your creative might not be relevant.
Quick tip: Use impression trends to spot delivery problems (e.g., ad disapproved, exhausted creative).
2. Engagement rate
Actions taken on an ad divided by impressions (likes, shares, comments, video plays).
Why it matters: Engagement shows how well your creative resonates before users click. High engagement often predicts better downstream metrics, such as CTR, and lower costs.
How to use it: Track engagement by creative variant and placement. Use as an early filter to keep high-performing creatives in rotation.
Quick tip: If engagement is rising but CTR is falling, it may mean people enjoy the creative, but the call to action or landing page isn’t clear. Try testing stronger CTAs.
3. Click-through rate (CTR)
Clicks ÷ Impressions.
Why it matters: CTR measures ad relevance and initial user intent. It affects auction performance and often quality-related costs.
How to use it: Use CTR to rank creatives quickly. A low CTR with high impressions suggests poor relevance or mismatched audience. CTR also guides bid strategy: a low CTR can increase CPCs.
Quick tip: Test headline and image/video combinations in small A/B tests. Prioritize versions with at least a meaningful lift in CTR before scaling.
4. Conversion Rate
Conversions (installs, signups, purchases) ÷ Clicks (or sessions).
Why it matters: This is where intent becomes value. Conversion Rate links your ad messaging and landing experience to outcomes.
How to use it: Segment conversion rate by creative, placement, device, and traffic source. If CTR is high but conversion rate is low, fix the landing flow, tracking, or offer.
Quick tip: Use short conversion funnels and single-goal landing pages to reduce drop-off and clearly measure the ad-to-action path.
5. ROAS (Return on Ad Spend)
Revenue from ads ÷ Ad spend (often measured at 30/60/90 days for apps).
Why it matters: ROAS shows whether your ad spend is generating a return. It’s a direct efficiency gauge for scaling budgets.
How to use it: Calculate ROAS across different lookback windows (e.g., day 7, 30, 90). Early ROAS can guide short-term bids; later ROAS validates long-term value. Remember, ROAS ≠ full profitability; it excludes platform fees, refunds, operational costs, and infrastructure costs.
Quick tip: Set tiered ROAS targets by campaign objective (branding vs. direct response). Pause campaigns that fail to meet minimum ROAS thresholds after a defined learning window.
6. Ad Quality Score (or Relevance Score)
Platform-specific index (e.g., Google’s Quality Score) that measures the relevance of keywords/creative/landing page.
Why it matters: A better quality score lowers costs and improves ad placement. It’s a direct sign that your creative and landing page match user intent.
How to use it: Monitor quality score at the keyword and ad level (search) or relevance diagnostics on social platforms. Improve landing page relevance, speed, and match keywords/CTAs to ad copy.
Quick tip: Fix low-ranking elements first (poor landing experience or irrelevant keywords). These typically deliver the biggest cost improvement.
7. Cost per Impression (CPM)
Cost ÷ 1,000 impressions.
Why it matters: CPM shows how expensive it is to reach an audience. Use it to compare channel efficiency for awareness buys.
How to use it: Use CPM to budget reach campaigns and to compare inventory quality across exchanges or placements. Higher CPM can be fine if it delivers high-value users downstream.
Quick tip: Monitor viewability and placement; lower CPMs on poor viewability are often false savings.
8. Cost per Click (CPC)
Cost ÷ Clicks.
Why it matters: CPC measures the price of driving attention. It helps compare keyword bids and test creative efficiency.
How to use it: Pair CPC with CTR and conversion rate to understand real acquisition economics. A low CPC but poor conversion rate can be worse than a higher CPC with strong conversions.
Quick tip: Use CPC caps during tests to control spend while you validate creative and targeting.
9. Cost per Action (CPA)
Cost ÷ Desired action (install, signup, purchase). Also called Cost per Conversion or Cost per Install.
Why it matters: CPA shows the true cost to acquire the outcome you care about. It’s a core metric for budgeting and profitability calculations.
How to use it: Set acceptable CPA targets from your LTV and CAC math. Use CPA to decide whether to scale or pause campaigns.
Quick tip: Use campaign-level CPA bidding only after the creative, audience, and funnel are validated.
10. Lifetime Value (LTV)
Total revenue a user (or cohort) generates over a set period (common windows: 30, 60, 90, 365 days).
Why it matters: LTV tells you how much you can afford to spend to acquire a user and still be profitable. Cohort-based LTV (by source, country, or creative) gives the most actionable insight.
How to use it: Build LTV by cohort and update regularly. Use cohort LTV to set ROAS/CAC targets and prioritize sources that deliver higher LTV, even if short-term metrics appear weak.
Quick tip: Always report LTV with confidence intervals or sample sizes, as small cohorts can be misleading.
11. Customer Acquisition Cost (CAC)
Total acquisition spend ÷ Number of new customers acquired.
Why it matters: CAC measures how much you pay to win a user. When compared to LTV, it determines the sustainability of your growth.
How to use it: Track CAC by channel and by campaign. Use CAC-to-LTV ratio thresholds (e.g., LTV should be meaningfully higher than CAC) to determine scaling. Include all marketing costs to calculate an accurate CAC.
Quick tip: Lower CAC by optimizing creatives for a higher conversion rate, and by shifting spend to the highest-LTV sources.
12. Share of Voice (SOV)
Your ad/media presence compared to competitors, often measured as your spend or impressions share in a category or channel.
Why it matters: SOV helps you understand competitive pressure and whether you have sufficient presence to be considered by users. Increasing SOV often correlates with higher brand awareness, but only when supported by differentiated creative and incrementality validation.
How to use it: Track SOV in campaigns where category visibility matters (new app launches, limited-time offers). Combine SOV with performance metrics; a high SOV with poor efficiency signals wasted spend.
Quick tip: Use SOV to decide when to defend share during peak windows (holidays, product launches) and when to conserve budget in quieter periods.
When you review these metrics together instead of one by one, clear patterns start to appear. You can quickly see where attention drops, where costs increase, and where real value is created.
Metrics show what happened, but strategy explains why. Turning numbers into decisions requires a structured approach to segmenting, testing, and interpreting results.
Also Read: AI Ad Analysis Tools in 2025: Find What Drives Creative Success
Top Strategies for Analyzing Paid Ad Performance

Start with an outcome: define what success looks like (e.g., new users, bookings, subscriptions, lifetime value). From that outcome, pick the small set of metrics that really move the needle. In a privacy-first world, you’ll combine platform signals, aggregated measurement frameworks, and designed experiments to get reliable answers.
1. Segmenting and Interpreting Results
Segmentation turns a single metric into a map. Rather than asking “how did the campaign do?” ask “how did different groups respond?”
What to segment by:
Source/network (search, social, in-app).
Creative (video vs. static; hook tested).
Geography and OS (iOS vs. Android behave very differently now).
Cohort by install date (first 7, 30, 90 days).
User behavior (completed tutorial, made first purchase).
Why this matters: different segments reveal where your ads find high-value users or where spend is leaking. For example, a network may send plenty of installs, but with poor retention segmentation, it exposes that gap, so you can shift budget or change creative.
What you should read and why:
CPA / Cost per Action (shows acquisition cost for the thing you care about). Use it to cap spend per channel.
CPI (Cost per Install) (quick health check for install buys). But CPI alone is shallow; pair it with retention and LTV to see value.
ROAS (Return on Ad Spend) (short-term revenue signal) and LTV (Lifetime Value) (longer-term revenue). Combine them: ROAS shows immediate efficiency, LTV shows whether those users are worth scaling.
Retention & Engagement (1-day, 7-day, 30-day): indicate whether installs turn into active users.
Conversion funnels inside the app (which step users drop off at?).
How to interpret: Always pair a cost metric with a quality metric. A low CPI + low retention = bad. A slightly higher CPI + strong LTV = worth scaling. Use cohort views (acquisition week → retention curve) to avoid mixing short-term and long-term signals.
Use privacy-safe postbacks and aggregated views: Apple’s SKAdNetwork and similar systems give aggregated signals. Treat these as directional, but dependable at scale; they are central to iOS analysis now. Balance them with server-side events, platform reports, and MMP summaries to form a fuller picture.
Segment first, interpret second; that order turns noise into action.
2. Optimization Tactics Based on Data
Once you can read segments, act on them with precise tests and tactical changes.
Creative testing:
Test one variable at a time when possible (hook, CTA, visual). Use multivariate only when you have a big volume.
Write a clear hypothesis (example: “Video with early reward hook will lift installs by 20% for 18–34 users”). Track both front-line metrics (CTR, install rate) and downstream value (retention, purchases). Automation tools can speed this up, but keep human review.
Why this matters: creatives account for most performance differences across channels. Rigorous creative testing reduces wasted spend and prevents “creative fatigue.”
Bid and budget tactics:
Optimize bids toward the metric you genuinely care about (if you want purchases, set conversion-based bidding, not installs).
Move budgets from low-LTV but cheap channels to slightly costlier channels that produce higher LTV. Use break-even CPA or LTV: CAC targets to guide reallocation.
Attribution and incrementality:
Run incremental experiments (holdouts, geo-tests, or randomized ad exposure) to measure true lift versus organic or baseline growth. Incrementality reveals spend that actually creates value, not just reassigns credit.
Use a mix of attribution data (platform + MMP) plus experiment results. If an ad network reports high installs but shows near-zero incrementality, reduce spend.
Measurement adjustments for privacy-era reality:
Design conversion-value mappings for SKAdNetwork or aggregated frameworks: prioritize events that best predict LTV (e.g., subscription start, first purchase). Revisit mappings quarterly as behavior and OS capabilities change.
Optimize in small, measurable steps, test, learn, reallocate, and repeat.
3. Reporting and Communicating Insights
Good reports don’t just recite numbers; they answer decisions.
What a decision-focused report contains:
1. Headline: One sentence that answers “Should we increase, decrease, or hold spend?”
2. Top-level metrics: Spend, installs, CPA, ROAS (or equivalent) with trend arrows.
3. Segment insights: Which creatives/networks/geos outperformed and why?
4. Action items: Clear next steps (pause creative A, double creative B, run incrementality test in Geo X).
5. Confidence & caveats: Note data limits (e.g., “SKAN post-backs aggregated; sample size < 1000 installs this week”).
Visualization and cadence:
Use funnel charts, cohort retention graphs, and simple tables. Keep dashboards focused; two slides or one dashboard screen should be enough for an exec summary.
Weekly tactical updates + monthly strategic reviews are a practical cadence for most teams. Include a quarterly deep-dive when you need to change conversion-value logic or revisit LTV modeling.
How to frame tests and uncertainty:
Report both observed lifts and statistical confidence. For experiments, show sample size, p-values, or at least simple thresholds (e.g., “lift > 5% with n ≥ X”). When privacy limits detail (SKAN), state that as a caveat.
Use plain language. Avoid raw data dumps. Attach data appendices for technical readers, but lead with decisions and impact. Clear reports speed decisions, making the next move obvious.
Applying these strategies consistently depends on the tools behind them. The right tools make analysis faster, clearer, and easier to scale.
Also Read: Top Creative Analytics Tools for Successful Ad Campaigns 2025
List of Top Tools for Analyzing Paid Ad Performance
By this point, one thing should be clear: analyzing paid ad performance is not just about having access to data, it’s about how quickly and clearly that data helps you make better decisions. The right tool should reduce guesswork, surface patterns early, and connect creative effort to real business outcomes, especially in a privacy-first environment where signals are fragmented.
When evaluating tools, start by asking a few practical questions:
Does this tool help you understand why certain ads perform better, not just which ads perform better?
Can it break performance down at the creative level so you know what to repeat, refine, or remove?
Does it save time by automating analysis instead of adding reporting work?
Can it support decisions across testing, scaling, and budget allocation, not just reporting?
Platform-native tools are essential for running campaigns and accessing inventory, but they are often optimized for delivery rather than in-depth analysis. They show performance outcomes but rarely explain the creative drivers or the competitive context. Dedicated analytics tools fill this gap by turning raw performance data into clear, actionable insights.
The best choice is not the tool with the most features; it’s the one that aligns with how you analyze, test, and scale ads day to day, and helps you move faster with confidence rather than overwhelm you with dashboards.
1. Segwise

Segwise is an AI-first creative analytics platform that automates tagging, tracks competitor creative, and surfaces simple, actionable insights across ad networks. It solves the common problem of manual creative analysis: instead of you spending hours tagging assets, Segwise uses AI to identify creative elements, show what works, and help you quickly generate creative variations and idea prompts informed directly by top-performing creative elements. That makes it especially strong when your decisions depend on creative performance (what creative to scale, what to kill, and why).
In plain terms, if your goal is to improve creative ROI and identify which ads actually drive higher-value users, Segwise is built for that challenge and helps you act fast.
Key features:
AI Creative Tagging: auto-labels hook scenes, first dialogues, headlines, characters, influencer traits, CTA text, CTA dialogue, audio cues, and other creative elements so you can compare consistently across campaigns and networks. This saves time and removes human tagging bias.
Competitor Tracking: monitors competitors’ creatives (Meta only) and highlights trends you can exploit (what creatives they test, which styles repeat). Use this to spot creative gaps and copy what works in your market.
Custom Tagging: lets you define your own naming and taxonomy so insights align with your reporting and experiments. This keeps dashboards meaningful to your workflows.
AI Creative Generation: generates creative variations or idea prompts from top-performing elements so you can iterate faster without losing signal.
Unified Dashboard / Studio View: manage multiple apps or projects from one place and compare creative performance side-by-side.
Best for:
Suppose your primary need is creative-level insight that directly ties to value (not just clicks). Use it when your decisions rely on knowing which visual hooks, CTAs, or storylines drive retention and revenue.
Pros:
Speeds up creative analysis with automated tagging.
Makes competitor creative intelligence actionable.
Helps you generate and prioritize new creative ideas based on what’s working.
Cons:
Onboarding requires a short setup to align tags with your naming conventions (quick but necessary).
Public language support is strongest in English teams; however, teams operating heavily in multiple non-English markets may need additional checks.
No widely advertised mobile app for viewing dashboards on the go (desktop/web-first).
Pricing:
Segwise typically offers a free trial, then quote-based or tiered plans after a demo, and expects custom pricing for larger programs rather than a single public price sheet.
2. Google Ads (Search, YouTube, Performance Max)

Google Ads is the platform-native system for search, video, shopping, and display inventory across Google properties. It provides direct access to bidding, placements, and audience targeting across high-intent search and large-reach channels such as YouTube and Gmail. Google’s recent product updates continue to drive AI automation across campaign types (e.g., Performance Max) to consolidate channels and simplify delivery.
Key features:
Performance Max (multi-channel AI campaigns): consolidates reach across Google channels while optimizing for your conversion goals; well-suited when you want a single campaign to reach users across search, video, and discovery.
Search & Shopping auction controls: granular keyword, match type, and shopping feed control for intent-driven buys.
YouTube video placements and formats: reach and brand-building, plus direct-response opportunities across skippable, non-skippable, and in-stream formats.
Extensive reporting + attribution: platform metrics and conversion tracking tied to Google’s systems (but remember attribution reflects Google’s model).
Best for:
If you need a broad reach across search and video, and rely on intent signals and direct conversions. If your priority is search volume, brand reach, or complex feed-based commerce, this is a natural fit. If your day-to-day is focused narrowly on creative-first, asset-level testing, and competitor creative intelligence, this may feel less tailored.
Pros:
Massive inventory and intent signal (search + YouTube).
Mature auction and bidding tools, including automated bidding and Genie/Gemini AI capabilities.
Deep integrations with Google measurement and analytics.
Cons:
Not built for creative analytics at the asset-level: it reports ad performance but won’t auto-tag creative elements or suggest creative variations the way specialized creative analytics tools do.
Changes to attribution and privacy (iOS privacy, aggregated reporting) can make it harder to link platform metrics to true incremental value without experiments.
Complexity can lead to noisy experiments, and ramping automation without proper guardrails may hide which creative elements actually drove value.
Pricing:
Google Ads does not have fixed subscription pricing. You pay based on auction-based spend (CPC/CPM/CPA, etc.).
3. Meta Ads Manager (Facebook & Instagram)

Meta Ads Manager runs campaigns across Facebook and Instagram. Its automation (Advantage+ campaigns) and broad audience graph power efficient delivery for many direct response and brand goals. Meta continues to push AI automation and product changes that simplify campaign setup and asset optimization.
Key features:
Advantage+ / Automated creative optimization: automates placements and combinations of assets to find high-performing mixes for conversions.
Detailed audience targeting & lookalikes: strong tools for audience expansion and retargeting.
In-platform creative testing & insights: ad sets can test different creatives and report by placement (Feed, Stories, Reels).
Ad Library / public transparency: lets you research competitor ads at a high level (manual monitoring required).
Best for:
Suppose your goals are social reach, engagement, or conversion on Facebook/Instagram, where creative and short video formats matter. If you need platform reach and social signals more than deep creative analytics, this is useful. If you need a creative-first analytics stack that tags and surfaces asset-level patterns for rapid iteration, consider a specialist tool instead.
Pros:
Huge social reach and strong creative-first placements (Reels, Stories).
Powerful automated delivery and audience expansion tools.
Native creative testing workflows.
Cons:
Limited automated creative element tagging: Meta provides performance per ad, but it does not auto-tag hooks, characters, or visual elements as dedicated creative analytics platforms do.
Attribution ambiguity after privacy changes: signals can be delayed or aggregated, making precise LTV linkage harder.
Policy and delivery volatility: creative approval and ad review policies can unpredictably affect campaign timing and scale.
Pricing:
Meta (Facebook & Instagram) also operates on an auction model without set subscription prices. Cost depends on bidding competition, audience, and objective. Meta has not published a flat pricing list.
Ultimately, choosing the right solution for analyzing paid ad performance comes down to clarity: pick the tool that helps you understand what truly drives results, act on those insights faster, and consistently turn ad spend into measurable growth.
With metrics, strategies, and tools aligned, paid ad analysis becomes a growth system rather than a reporting task. What matters next is using that system to guide smarter, more confident decisions.
Also Read: Why Creative Tagging Matters for Mobile Game Marketers in 2025
Conclusion
Analyzing paid ad performance is about turning data into clear, repeatable actions. By focusing on metrics that tie spend to real business outcomes, testing changes with purpose, and reviewing results through a revenue lens, teams can optimize with confidence and scale what works. This approach removes guesswork and ensures every decision contributes to long-term value.
To move from insight to execution, teams need tools that connect creative decisions to measurable impact. Segwise uses multimodal AI to automatically tag creative elements and link them to performance metrics, making it easier to see which ads truly drive ROAS, identify creative fatigue early using proprietary fatigue detection algorithms, and learn from competitor ad trends (Meta only). This keeps budget and creative choices grounded in proven performance signals.
Segwise makes it easy to apply this in practice with a no-code setup that integrates with major ad platforms and requires no engineering or a credit card. Start a Free Trial with Segwise to quickly identify the creative elements that drive value and turn insights into action.
