Google Performance Max Channel Performance Reporting Guide
You’re optimizing Performance Max campaigns but still guessing which Google surfaces actually drive installs or conversions. Spend shifts across Search, YouTube, and Display, yet visibility remains limited, making it harder to act on what’s working.
Google has started rolling out the new Channel Performance Report (beta), giving a clearer view into how each surface contributes to your goals. As of latest updates, Google says channel performance reporting is available in all Performance Max campaigns, with search-partner breakdowns and MCC access coming in the next few weeks.
In this blog, we'll cover how to access and interpret the report, use its metrics to make faster creative and targeting decisions, and apply diagnostics insights to improve campaign efficiency.
What the Channel Performance Report Shows
The Channel Performance Report breaks a Performance Max campaign into the Google surfaces where ads run: Search, Google Display Network, YouTube, Discover, Gmail, Maps, and recent additions such as Waze for store-goal campaigns in the U.S. You can use segments like ‘Ads using product data’ (Shopping-style formats) or ‘Ads using video’ to compare by creative type. This view shows where your ads were seen or engaged and which surfaces contributed to your goals.
For each surface, the report lists key metrics you’ll use to compare performance: impressions, interactions (clicks or engagements), conversions, conversion value, cost, and the actual ROAS or CPA for the selected time range. You can filter by format (for example, ads using product data or video) and download the channel table for external analysis.
The report pairs a channels-to-goals visualization with a channel distribution table and a diagnostics/status column. The chart shows how each surface maps to the conversion goals you set. The table provides sortable, exportable rows per surface and shows status flags indicating issues such as missing asset types, disapproved creatives, or limited serving. Use these outputs together to see which surfaces add value and which need work.
Why Channel Level Visibility Matters
Seeing performance by channel turns a guess into a clear signal. When you can compare results across surfaces, you can find where low-cost installs or high-value conversions actually come from, spot formats that aren’t working, and check whether a new creative moved the needle on a specific surface.
Practical daily uses:
Find efficient surfaces that deliver lower CPA or higher conversion value so you can back the right creative types.
Detect underperforming asset formats (video, image, or product-feed ads) on a given surface and replace them quickly.
Confirm whether a creative change improved conversions on a specific surface before you scale it.
Trace unexpected trends (for example, rising spend with flat conversions) back to the surface to identify the cause of the shift.
Note: Performance Max uses Google’s automation to allocate budget across channels based on your goals, targets, and budget. The report helps you diagnose issues and prioritize asset, feed, or goal changes; it does not let you set manual bids per channel.
Now that you know why this visibility matters, here’s where to find it and how to start using it inside your account.
How to Open the Channel Performance Report
Follow these steps in your Google Ads account:
Go to Campaigns and open the Performance Max campaign you want to inspect.
From the left or top navigation inside the campaign, open Insights & reports (or the channel reporting entry shown there).
Choose Channel performance. Use the dropdowns at the top of the report to change date ranges (supports ranges after June 6, 2025), conversion goals, or to segment the view. You can download the channel distribution table or jump to the placement and asset reports via the provided links.
Practical checks before you dig in: confirm conversion tracking for the goal you’re viewing, and check asset groups and feeds are current, both of which affect how channels are used and how results map to goals. Recent updates mean the channel report is rolling out broadly and is available across many accounts.
After opening the report, you’ll see several panels and data views. Each panel serves a distinct purpose, and together they build a complete picture of your campaign’s performance.
Also Read: Guide to Performance Max Creative Specs and Practices
Understanding the Report Panels and Key Metrics
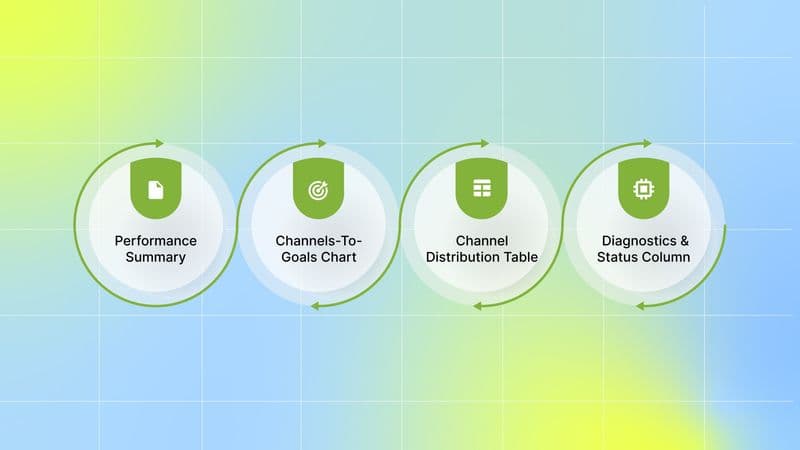
Below are the panels you’ll use every day, what each shows, and how to act on it:
1. Performance Summary
Shows campaign-level headline metrics: actual ROAS or CPA, average target ROAS/CPA, interactions (clicks/engagements), conversions, conversion value, and cost. Use it as a quick health check. If actual ROAS/CPA is far from the target, use the channel breakdown to find which surfaces are driving the gap.
2. Channels-To-Goals Chart
The Channels-to-Goals chart breaks down how Performance Max uses Google’s surfaces (Search, YouTube, Display/Discover/Gmail, Shopping, Maps, and partners) to help you reach the goals you set. For each channel, it shows key metrics such as impressions, interactions, cost, conversions, and conversion value so you can quickly see which surfaces are driving results.
At the top of the chart, you’ll find three dropdowns to focus the view:
Channel: choose one channel or keep all channels visible.
Format: filter by Ads using product data, Ads using video, or All ads to see performance by creative type.
Conversions: pick Conversions or Results. Conversions show the actions the campaign is actively optimizing for. Results include conversions across all account goals, even those the campaign isn’t optimizing. Use this to spot hidden value or gaps between what you measure and what the campaign actually delivers.
How to act on what you see: scan the chart to find channels that deliver high value for modest spend and channels that take budget without similar returns. Use that insight to decide where to add or swap creatives, fix landing pages, or change budget and targets.
3. Channel Distribution Table
What it shows: A sortable table with channel rows and columns for metrics such as impressions, engagements/clicks, conversions, conversion value, cost, and ROAS or CPA. You can add segments (like “ads using product data”) and download the table for deeper analysis.
How to use it:
Sort by conversion rate, cost per conversion, or conversion value to find priority channels.
Add segments to see format-level performance (for example, which product-fed ads work on Search).
Export to CSV if you want to join these channel rows with other account data in a spreadsheet or BI tool.
Keep exports for week-over-week comparisons when testing new creatives or asset edits.
4. Diagnostics and Status Column
The Status column flags whether a channel can show ads and highlights issues that limit delivery. Hover a status or click View channel diagnostics to get specific guidance.
Status labels (what they mean):
Not eligible: the channel cannot show ads.
Eligible (limited): the channel can serve, but one or more issues are restricting when or where ads run.
Eligible: The channel can show ads, and no significant issues were detected.
You may also see “Eligible (limited)” cards calling out specific problems (for example: Missing location asset, Final URL expansion isn’t enabled, or Asset groups limited by policy). Treat those cards as a short, prioritized to-do list.
While metrics tell you how your ads perform, diagnostics explain why certain results appear. The next section focuses on the common issues that can limit delivery or skew performance across surfaces.
Also Read: Analyzing And Measuring Campaign Performance Metrics And Strategies
Common Diagnostics You May See
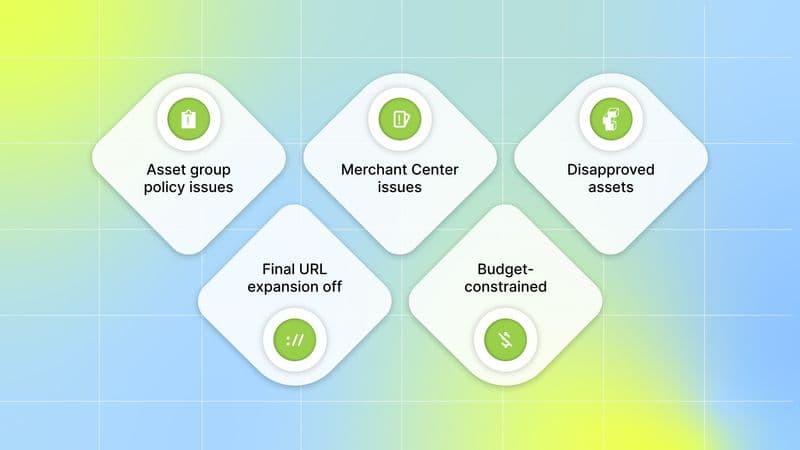
Sometimes the reason a channel underperforms isn’t about creative or targeting, it’s a delivery or setup issue flagged right in the Diagnostics tab. These insights act as early warning signals that help you fix serving problems before they impact results. Here’s what you might see and how to resolve each one:
Asset group policy issues: Some asset groups may be disapproved or limited by policy. Review the asset group details in the Diagnostics tab, remove or edit any content flagged by policy, and request a review once corrections are made.
Product feed or Merchant Center issues: Problems in your Merchant Center account can prevent Shopping-style placements from serving. These issues often include inactive accounts, disapproved products, missing GTINs, or out-of-stock items. Open Merchant Center, go to Products → Diagnostics, fix the specific item issues, and request a review only after resolving the root cause.
Missing or disapproved assets: Each channel needs certain asset types to serve ads effectively—such as videos for YouTube, location assets for Maps, or call and lead-form assets for call and lead goals. When these are missing or disapproved, delivery may be restricted. Upload the required assets or resolve disapprovals, then check the Status column to confirm the issue is cleared.
Final URL expansion off: If Final URL expansion is disabled, Search delivery may be limited since the system can’t match searches to alternate landing pages. Enable Final URL expansion in your campaign settings if it aligns with your strategy, or review URL exclusions to prevent unwanted pages from appearing.
Budget-constrained / allocation to higher-performing channels: Sometimes, a channel may show limited activity even without errors. This usually means the system is directing your budget toward channels predicted to deliver stronger conversions. If you prefer more presence in the quieter channels, consider shifting budget, adjusting targets, or testing new creatives. Otherwise, treat this as a sign that your campaign is optimizing for the best return on investment.
Treat diagnostics as your campaign’s health monitor. By checking this panel regularly and resolving the flagged issues early, you keep every channel eligible to serve, maintain smoother delivery, and avoid losing performance momentum while running new creative or budget tests.
Note: Advertisers running Performance Max for store goals in the United States can now reach Waze inventory (Promoted Places in Navigation). No extra setup is required; PMax uses existing assets to optimize for local actions such as Directions. Waze inventory is available in the U.S., with planned expansion to more markets.
Once diagnostics are resolved and your data is clean, you can turn those insights into focused tests that improve creative performance and channel efficiency.
Turning Channel Signals into Tests for Creative and Acquisition
Every insight in the Channel Performance Report points to an opportunity; the key is translating those signals into quick, focused experiments that improve results without guesswork. When you see patterns across channels, use them as a testing roadmap rather than making broad assumptions.
Below are focused tests you can run based on what the report shows:
If one channel has strong impressions but low conversions, try tighter creative relevance on that surface (shorter video hooks, different CTAs on display).
If a channel has a good conversion rate but low spend, you can’t directly raise bids for that specific channel in Performance Max. Instead, increase exposure by optimizing your overall campaign-level bid strategy (where it’s profitable to do so) and adding more assets tailored to that surface.
If cost is high but conversion value is low: test a creative that elevates value messaging, or change your conversion action segmentation and re-run the report segmented by conversion action to confirm impact.
When diagnostics flag delivery limits, resolve them before running tests. Export channel data for deeper ROI calculations or to tie channel rows into your internal reporting for automated analysis.
With this structured approach, each insight from the report becomes a practical experiment, building toward a cycle of continuous optimization and smarter creative choices.
Conclusion
Use channel-level data to build a tight, measurable testing loop: pick one surface, run a single creative or feed change, fix any delivery blockers, and judge success by business metrics before scaling. Small, frequent experiments compound insights fast. Each channel signal becomes a direct prompt for your next creative or targeting test.
While channel reporting tells you where performance shifts happen, it doesn’t always reveal why certain creatives outperform others. That’s where Segwise helps close the loop.
Segwise automatically tags every creative element—images, videos, text, playables—and maps those tags to performance signals like CTR, CVR, and ROAS. This lets you pinpoint which hooks, CTAs, visuals, or audio cues actually move the metrics that matter and translate channel insights into focused creative tests.
Cut time-to-insight by connecting your ad accounts and letting Segwise surface element-level wins and fatigue alerts so you can scale the right creatives sooner. Start a Free Trial to plug in your data, review AI-tagged creative insights, and validate decisions with real performance.
FAQ's
1. What is the Channel Performance Report?
It shows how a Performance Max campaign performed across Google surfaces (Search, Shopping, YouTube, Display/Discover/Gmail, Maps, and partners), with channel-level metrics including impressions, interactions, conversions, cost, and ROAS/CPA.
2. Is the channel report available to all accounts, and does it include Waze or search partners?
Google says channel reporting is rolling out broadly and is available in Performance Max campaigns; Waze inventory is now included for store-goal campaigns in the U.S., and search-partner breakdowns are being added.
3. Can I set different bids or manual budgets per channel from this report?
No, Performance Max uses automated bidding across channels, so the report helps you diagnose and test, but it does not let you place manual bids per channel.
4. Which channel metrics should I focus on to decide what to test or change?
Look at conversions, conversion value, cost, and ROAS/CPA by channel first, then check impressions and interactions to spot mismatches (high impressions but low conversions).
5. What common issues will the Diagnostics column show, and how do I act?
Diagnostics typically flag asset disapprovals, Merchant Center feed issues, missing channel-specific assets (such as video or location), or Final URL expansion settings. Fix the flagged item, request reviews if needed, then re-check channel eligibility.