Essential Mobile App Analytics Metrics to Track
Selecting the right Mobile App Analytics Metrics is becoming increasingly challenging. Many standard signals are weaker or delayed because platform privacy rules and new attribution systems limit direct device-level data.
That matters because most apps lose a large share of new users very quickly. So every wrong choice in what to track can hide why users leave or waste budget on the wrong channels.
At the same time, measurement tools are changing. Apple’s privacy-first APIs and Google’s Privacy Sandbox or attribution work mean marketers must rely more on aggregated and modeled signals when planning spend and product fixes. These shifts change how acquisition, retention, and LTV should be measured and compared.
This blog solves that problem by mapping clear metric choices to common app goals, showing which metrics to start with, and explaining how to keep those measurements reliable in a privacy-first world. The aim is to give a simple, practical set of metrics that lead to fast, correct decisions for acquisition, activation, retention, and revenue.
How to Pick Metrics
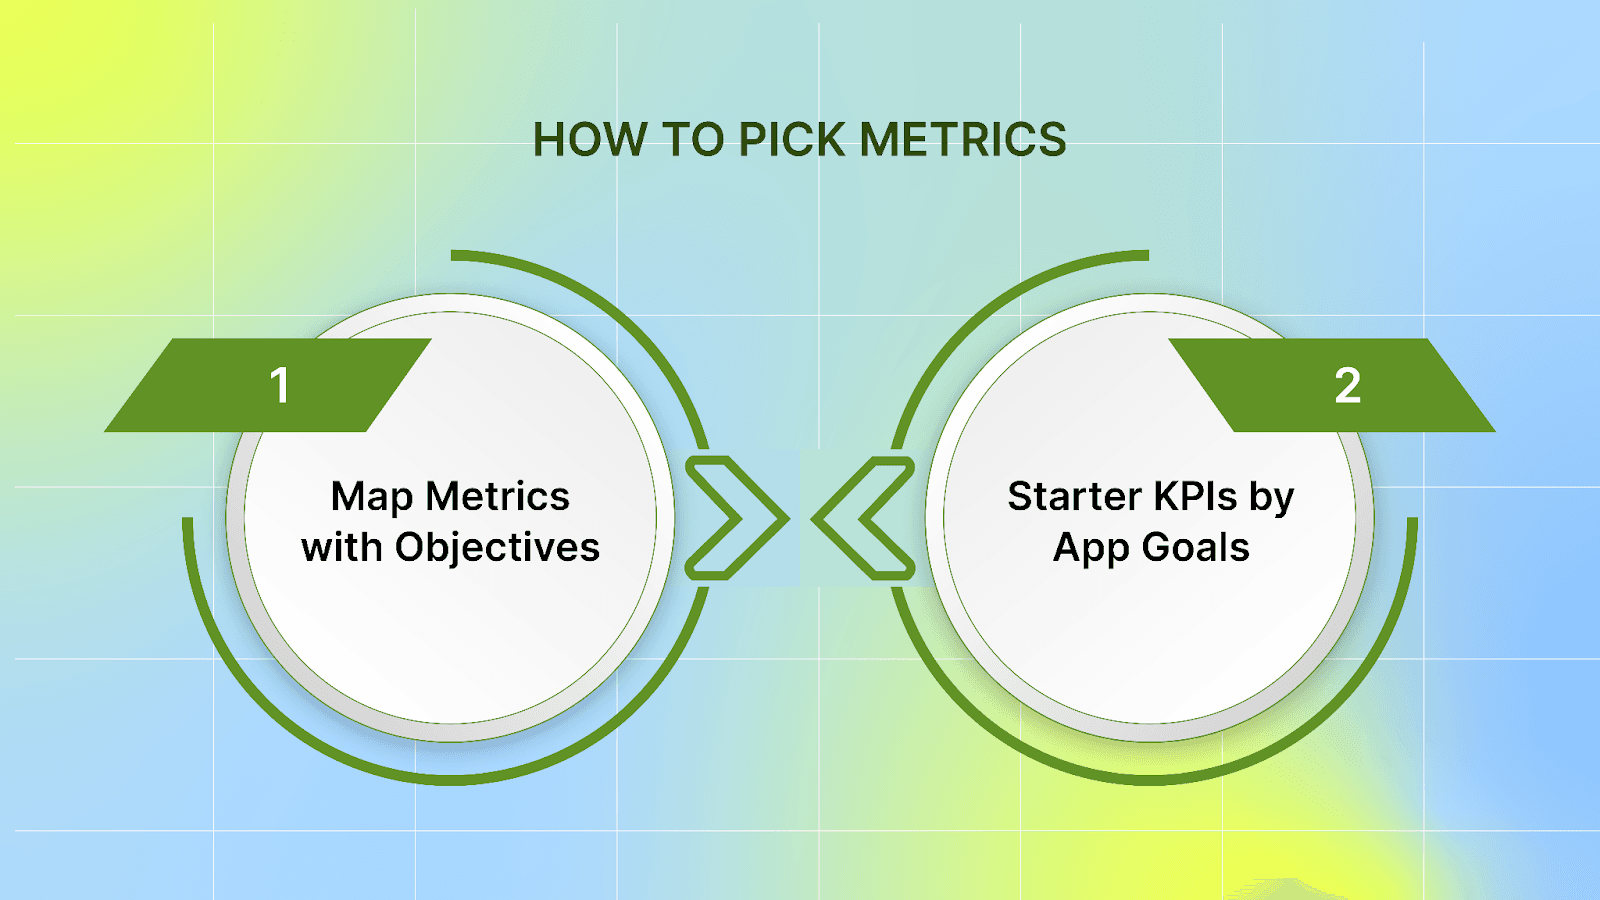
Mobile app marketers must select metrics that directly align with the app’s business goals, ensuring every tracked number leads to a clear decision:
1. Map Metrics to Business Objectives
Acquisition goals: track installs, cost per install (CPI), click-through rate (CTR) on ads, and conversion rate from ad click to install. These reveal how well marketing channels bring users in and how much each user costs.
Activation goals: track onboarding completion, time to first key action (for example: first search, first message, first saved item), and initial session length. These show whether new users get value fast.
Retention goals: track Day-1, Day-7, Day-30 retention, churn rate, and DAU/MAU ratio. These show whether users keep returning and help compare cohorts over time.
Monetization goals: track average revenue per user (ARPU), average revenue per paying user (ARPPU), lifetime value (LTV), free-trial conversion rate, in-app purchase conversion, and ad revenue per user (e.g., eCPM, ad RPM). These show how well the product turns users into revenue.
Begin with a short, KPI-driven set that answers the biggest business question (for example: “Is the trial converting?” or “Are new users returning after seven days?”). Track those reliably, fix measurement gaps, then expand the set as the app and goals evolve. Begin by focusing on core behavioral events and cohorts, then add advanced metrics.
2. Suggested “starter KPI set” by common app goals
Free trial / freemium conversion focus: installs, trial starts, trial conversion rate, time in trial, trial drop-off step (where users abandon).
In-app purchase (IAP) focus: active users, purchase conversion rate, ARPPU, top purchase flows, and LTV by cohort.
Ad revenue focus: eCPM (effective cost per mille), ad impressions per active user, ad revenue per DAU, and retention among high-value ad users.
Growth/engagement focus: DAU, MAU, DAU/MAU ratio, sessions per user, and average session length.
Choose a compact set of KPIs that answer the app’s most urgent business question, measure them cleanly, then expand only when those metrics are stable and producing clear insights.
Once you know which KPIs to focus on, the next question is how to analyze them. Different analytic approaches serve different purposes, from basic reporting to guiding actions.
The Four Types of Analytics You’ll Use
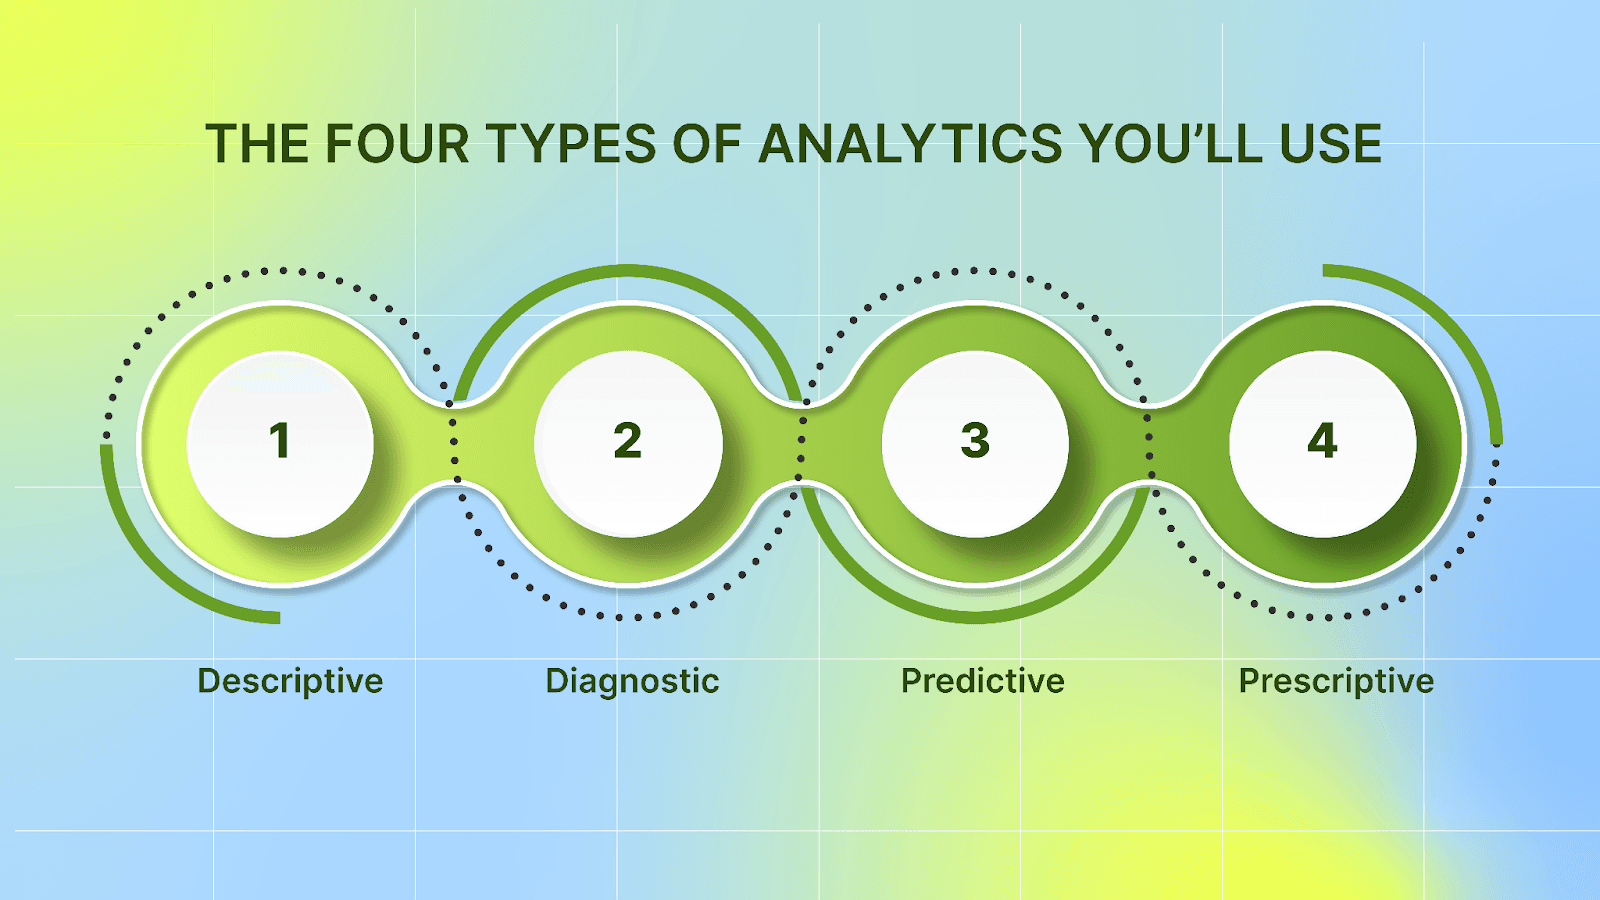
You can use four analytic modes, each answering a different question, and together they cover “what happened,” “why,” “what’s next,” and “what to do.”
1. Descriptive: “What happened”
Purpose: basic reporting and dashboards that summarize activity (installs, sessions, revenue, DAU/MAU, crash counts).
Use in app context: A monthly dashboard displaying installs, revenue, and retention over the last 30 days.
How it helps: gives the quick health check the team needs before digging deeper.
2. Diagnostic: “Why did it change?”
Purpose: explore causes behind changes seen in descriptive reports (drop in retention, spike in crashes, fall in conversion).
Techniques: cohort analysis, funnel breakdowns, event segmentation, session recordings, and crash traces.
Use in app context: diagnosing a Day-7 retention drop by checking which onboarding step users drop from and whether a recent release coincided with the drop.
How it helps: points teams to the feature, bug, or campaign change responsible for the change.
3. Predictive: “What’s likely to happen”
Purpose: Use historical patterns to forecast future metrics (LTV, churn risk, revenue trends).
Techniques: Time-series models, user-level churn scoring, and cohort trend projections.
Use in app context: Producing an LTV forecast for users acquired through a new ad channel to decide budget allocation.
How it helps: It provides a forward view, enabling marketing to adjust spend and targeting earlier. Many modern analytics platforms offer built-in forecasting features.
4. Prescriptive: “What action to take”
Purpose: Recommend or automate actions using ML and rules (for example: which users to send a re-engagement push to, or which variant to show).
Techniques: automated experiment suggestions, cohort-based messaging rules, and ML-driven cohort prioritization.
Use in app context: A model flags users likely to churn, and the system automatically enrolls them in a tailored push campaign or an incentive offer.
How it helps: It moves from insight to action quickly, as platforms increasingly offer prescriptive features that tie forecasts to recommended interventions.
Combine these four analytic modes to start with clear descriptive reports, use diagnostics to find causes, add predictive models for planning, and adopt prescriptive actions to close the loop and drive measurable outcomes.
With the four analytic modes in place, let’s break down the specific mobile app analytics metrics that matter most.
Key Mobile App Analytics Metrics You Should Track
1. Acquisition Metrics
Mobile app marketers need acquisition metrics that show where users come from, how much they cost, and whether those users are likely to generate value.
Attribution (organic vs paid)
Attribution separates users who arrive naturally from those brought in by paid campaigns.
Organic refers to people who found you on their own, such as through search, app store browsing, or friends’ links.
Paid here refers to people who came from ads or sponsored placements.
It shows which sources attract users who stay and spend, not just cause large install spikes. How to interpret channel results:
A lot of installs today don’t guarantee good results later. Check retention and revenue over weeks and months.
Numbers depend on how you measure them and how long you give credit (the “attribution window”).
Use the same window for every channel, and compare groups of users who joined in the same time period (a “cohort”) to see real differences.
Cost-per-install (CPI) and Cost-per-acquisition (CPA)
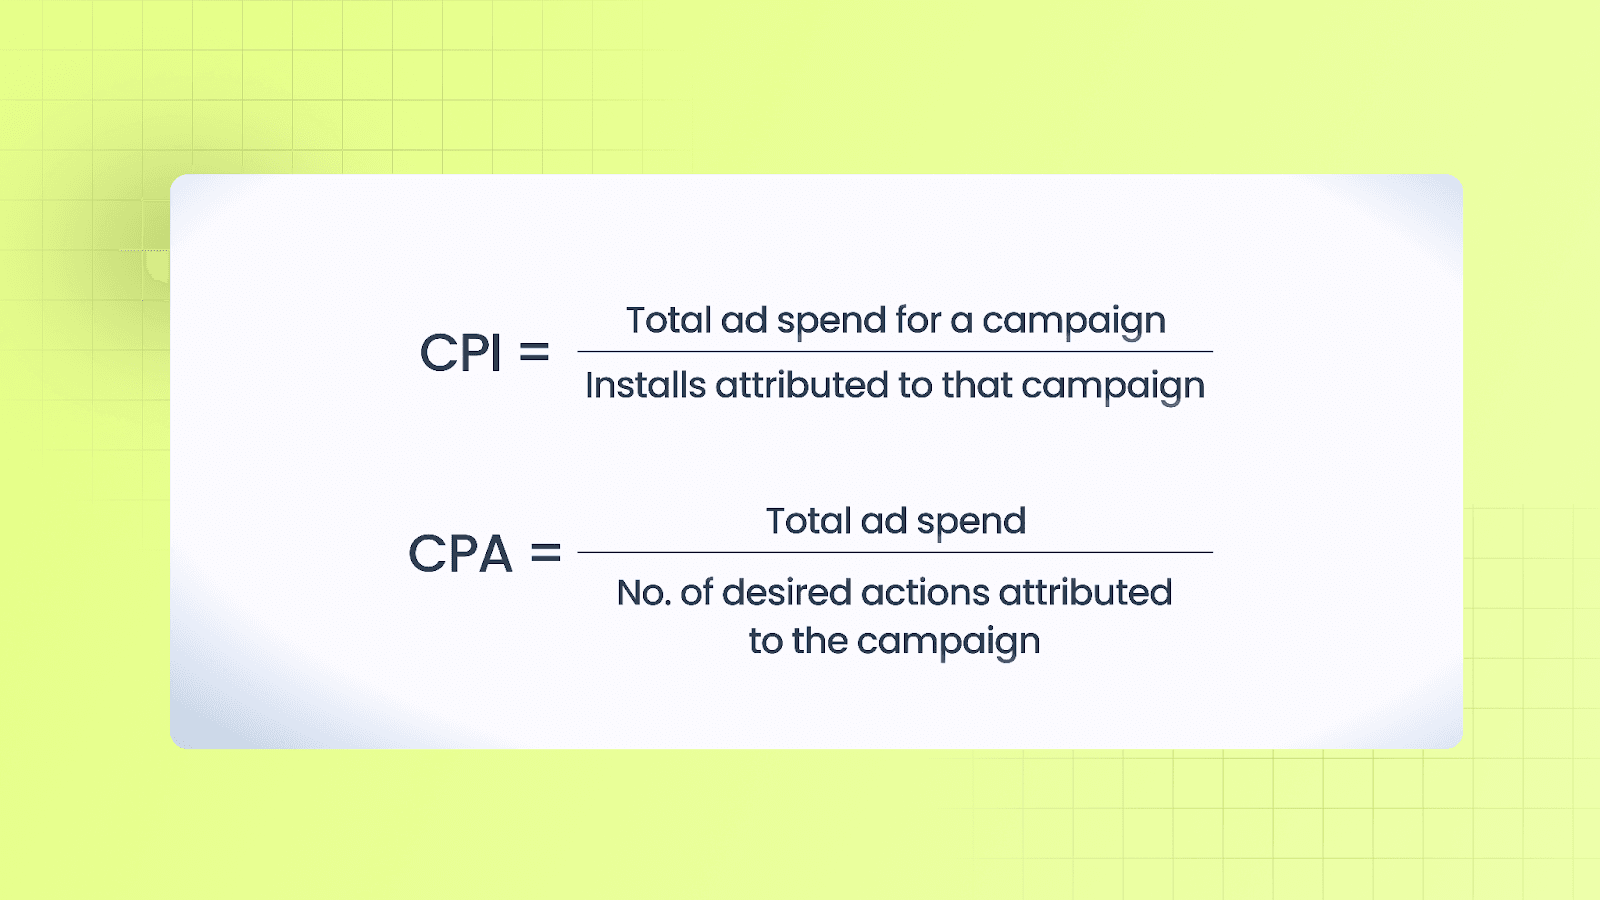
Use Cost-per-install (CPI) when the goal is installs. Use CPA when the goal is a deeper action. Let both guide budgets. Compare CPI and CPA across channels and cohorts before scaling.
Customer Acquisition Cost (CAC) vs LTV
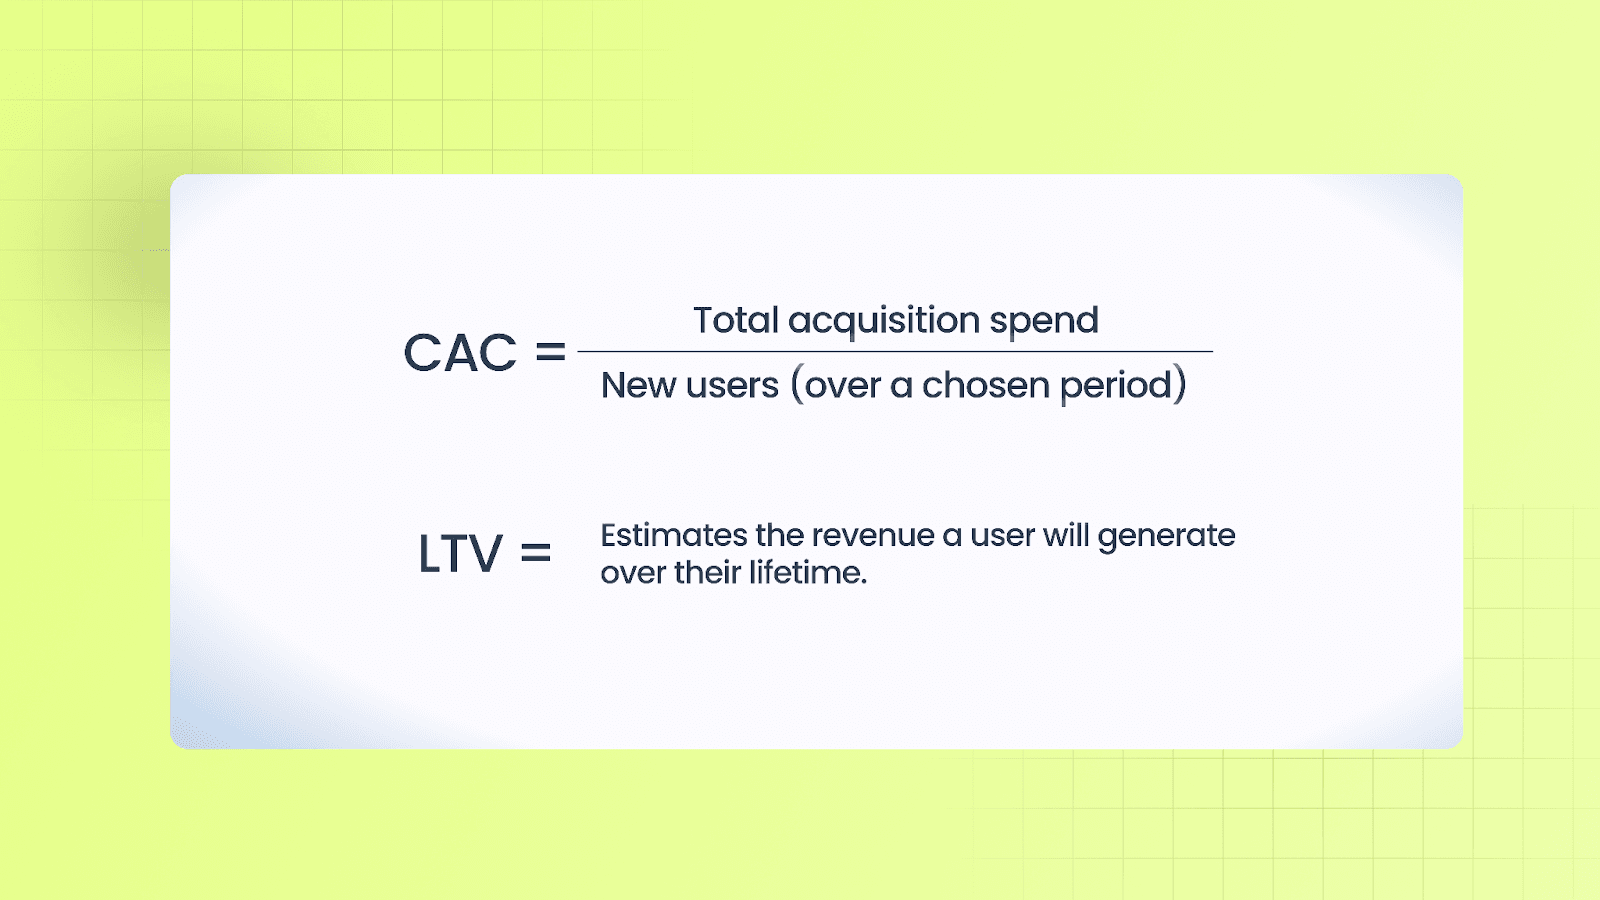
Look at groups of customers who joined in the same month or from the same channel (a “cohort”). Match the CAC for that channel/time to the LTV of that cohort. This shows which channels truly pay off.
Spend more on channels where LTV × gross margin – CAC still leaves room to cover operating costs and profit. (Many teams use a rough rule: LTV should be a few times larger than CAC.)
Install-to-Activation Conversion
Activation is the first moment a user gets real value. Examples include creating an account, completing onboarding, making a first purchase, or saving an item.
Track two things:
What percent of new installs reach that step (activation rate)
How long does it take them to get there (time to activation)
If few users activate or it takes too long, the problem often lies in onboarding or the first-run experience. Removing friction there tends to lift results quickly.
Start by tracking four things. Where users come from. What each install costs. What each key action costs. How many installs turn into active users? Then compare the cost to acquire a customer with the lifetime value of each user group to link spend to expected value.
2. Engagement Metrics
Engagement metrics show how frequently and how deeply users use the app; frequency and depth together show product fit.
Installs vs active users
Installs from the store count as downloads. A download doesn’t necessarily mean it was used.
Active users are defined as individuals who have actually used the app within a specific time window: DAU (daily active users), WAU (weekly active users), and MAU (monthly active users).
Use installs to gauge reach. Use active users to gauge real traction and habit.
Sessions and Session Length
A session is one period of use between opening and closing. Session length measures the time spent per session. Frequency (sessions per user) shows habit strength; length shows depth of engagement.
A pattern of many short sessions suggests repeated quick tasks; fewer long sessions suggest immersive usage. Look at both the median and tail percentiles (for example, 95th) so slow devices or heavy users are visible.
DAU/MAU (stickiness)

This ratio shows how often monthly users return daily. A higher value indicates stronger return behavior. Compare stickiness by cohort and acquisition channels to see which audiences form habits fastest.
Events and Event Taxonomy
Define a consistent event plan before instrumenting. Use clear, stable event names (for example: tutorial_complete, purchase) and include parameters that add context (value, currency, item_id, step). Track auto-collected events (sessions, installs) and custom business events. Keep the event list focused so data stays actionable rather than noisy.
Funnels and Conversion Rates
Map key flows (onboarding, purchase, subscription upgrade) into step-by-step funnels. For each funnel, measure per-step conversion and absolute drop. Prioritize fixes for areas where the largest proportions of users leave the funnel, using session traces or diagnostics to identify friction points.
Combine installs, active-user measures, sessions, clear event taxonomy, and targeted funnels to see how users engage and which flows need product fixes.
3. Retention and Churn
Retention measures the number of users who continue to use your app over time, whereas churn indicates the number of users who stop using it. These metrics help you understand if the app keeps users engaged and which groups of users stay loyal.
Retention (day-N retention)
Day 1: Measures how well the onboarding process worked (how many users come back after their first use).
Day 7: Shows how well users have formed short-term habits (how many are still using it after a week).
Day 30: Indicates how valuable the product is over the medium term (how many users are still around after a month).
By plotting retention curves for different groups of users (called cohorts), you can see how engagement drops over time and compare the performance of various user groups.
Cohort Analysis
A cohort is a group of users who share a common characteristic (such as when they installed the app or which marketing campaign brought them in). By comparing retention, revenue, and engagement across cohorts, you can see which groups stay longer and which ones drop off. This helps you spot long-term trends instead of short-lived spikes.
Churn Rate

You should focus on early-session churn (users who stop using the app after their first session) because it’s a strong indicator of potential problems. Look at churn over longer periods to spot issues with the product or content.
By using Day-1, Day-7, and Day-30 retention and cohort analysis, you can see which marketing sources and features lead to longer-lasting user engagement. Fixing early churn can significantly help keep users.
4. Monetization Metrics
Monetization metrics show how the app converts engagement into revenue and which levers to pull.
ARPU & ARPPU
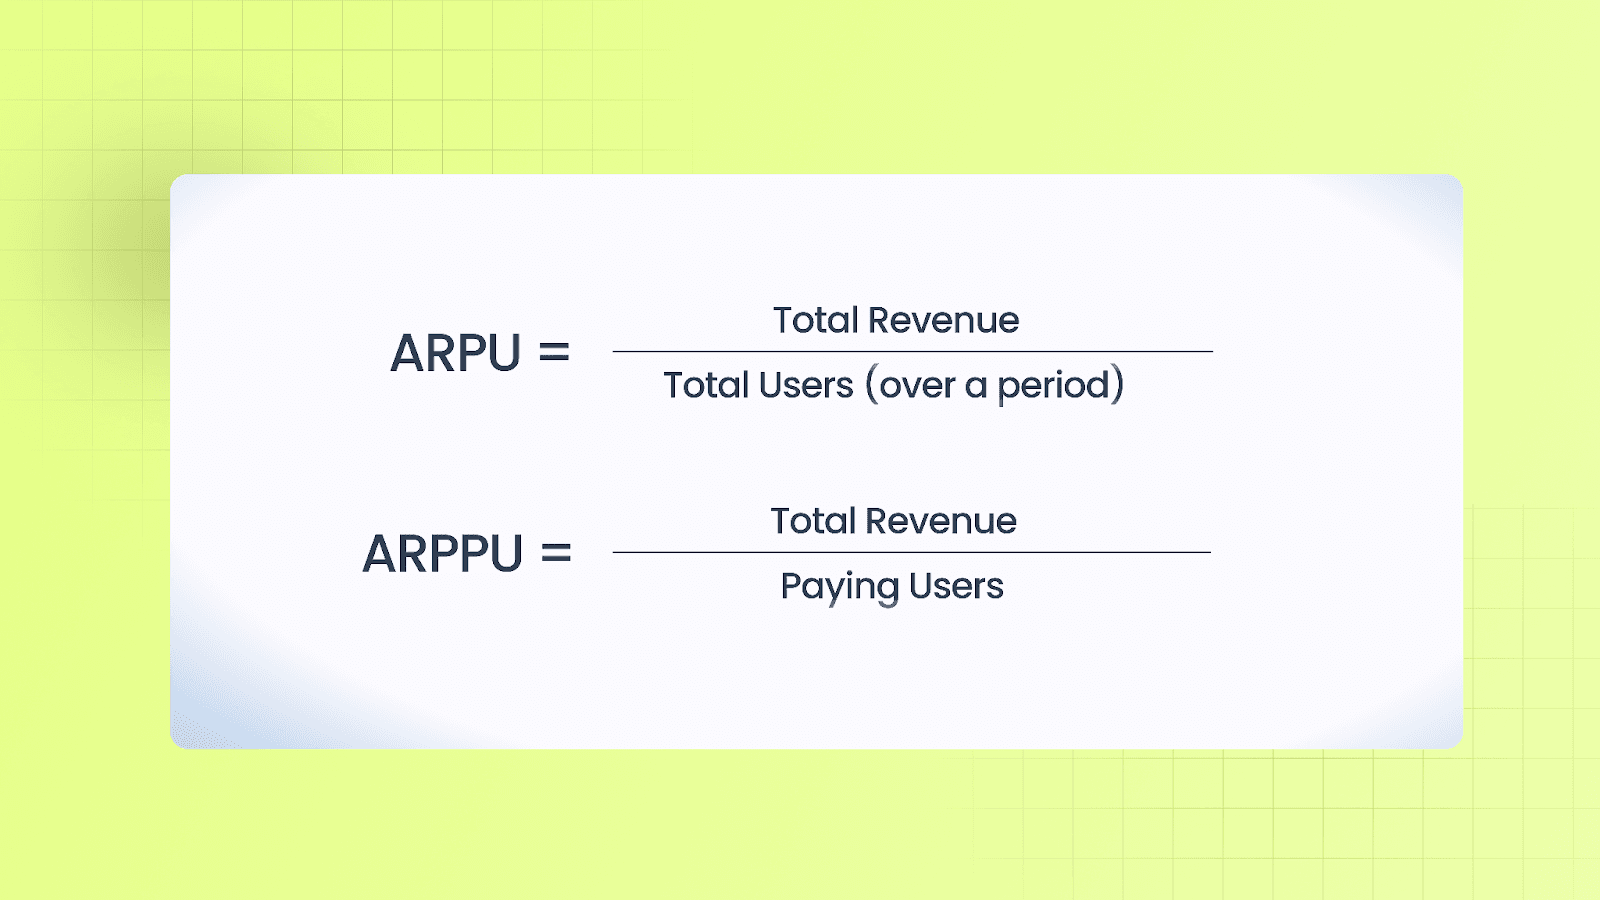
ARPU tells you how much money you're making from all users, while ARPPU focuses only on paying users. Both help you understand pricing and estimate future revenue.
Lifetime Value (LTV)
LTV is the total revenue you expect to generate from a user over their entire time using the app. It factors in how many users leave (churn) and how much money they spend (ARPU). You use LTV to decide how much to spend on user acquisition. To scale sustainably, compare the cost of acquiring a user (CAC) with the LTV of that user.
Purchase Conversion Rate & Average Order Value (AOV)
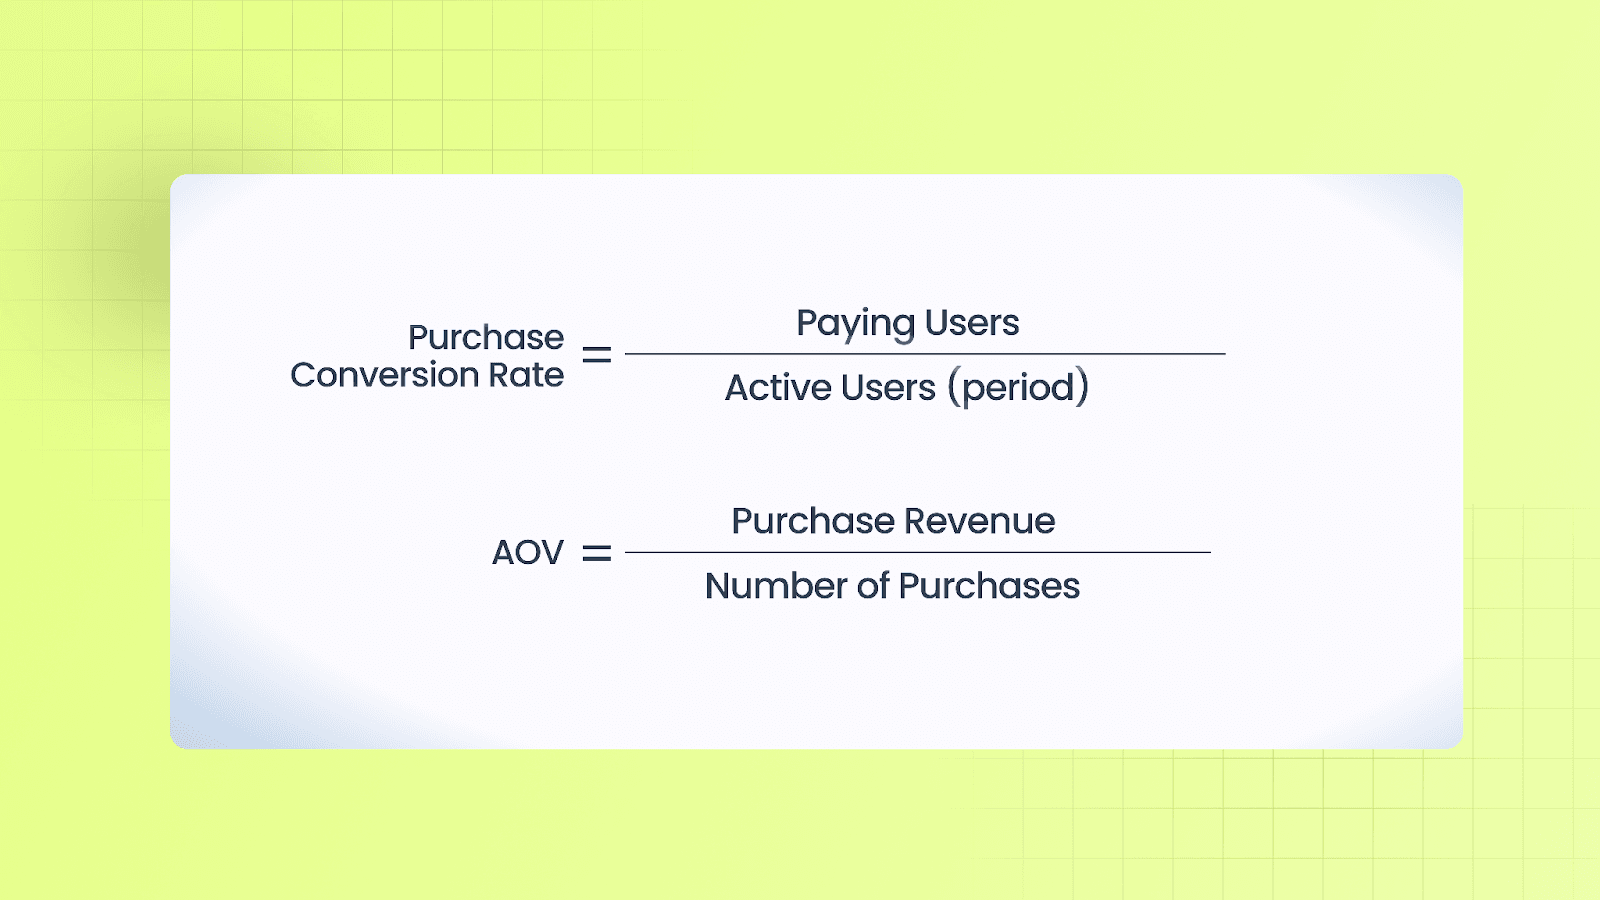
To improve conversions, make the checkout process easier, and experiment with pricing. Consider offering bundles or special deals to increase AOV.
Ad Revenue Metrics

Focus on the number of ad views per user and the fill rate (how often ads are shown). Strike a balance between displaying ads and keeping users engaged; too many ads can damage retention.
Use all these metrics together to make wise decisions about where to spend money on marketing, product improvements, or ads.
5. Privacy, Next-Gen Measurement, and Transformative Tech
As privacy rules tighten, measurement shifts from device-level signals to aggregated, modeled insights. You must adjust your measurement and bidding strategies around these changes.
What Changed and Why It Matters
Global privacy rules and platform changes have limited access to device identifiers and per-user signals. Many platforms now return aggregated or delayed results, requiring a rethinking of analytics setups to ensure reliable campaign decisions without full user details.
Key Frameworks Affecting Mobile Measurement
SKAdNetwork (Apple): A privacy-first attribution system offering limited postbacks and conversion values, requiring careful conversion mapping.
AdAttributionKit (Apple): Apple’s attribution framework that complements SKAdNetwork and provides privacy-preserving attribution records and interoperability across App Store conversion sources.
Google Privacy Sandbox (Android): Google is transitioning Android attribution toward privacy-preserving, aggregated APIs; the platform is being rolled out gradually, and Google has signaled plans for transition and compatibility windows for existing advertising features.
Practical Effect on Signals and Dashboards
Expect more aggregated, delayed signals instead of immediate per-install attribution. This impacts KPIs like CPA or ROAS, which require cohort-based adjustments for accurate channel comparisons.
Analytics Response: Modeling and Next-Gen Tools
With less per-user data, predictive analytics and ML fill gaps. Predictive LTV models use early behavior to estimate long-term revenue and retention, guiding bidding and channel comparison. Similarly, predictive funnels forecast retention and revenue, enabling quicker budget decisions.
Modeling vs. Deterministic Attribution
Use deterministic attribution when per-user identifiers are clear. Use probabilistic models when identifiers are limited, trading precision for valid estimates. Combine both methods and compare the results to detect discrepancies.
Checklist for Adopting Next-Gen Measurement
Define the event inputs needed for models (e.g., first session, purchase flag).
Map key conversions to SKAN/AdAttributionKit/Privacy Sandbox before launching campaigns.
Validate models with cohort backtests.
Monitor model drift and retrain on fresh data.
Combine signals (server revenue, postbacks, spend) for robust estimates.
Privacy-driven measurement is a shift toward probabilistic decision-making, keeping models validated and using multiple data sources to inform bids and channel choices.
Also Read: Meta AEM vs SKAN in 2025: Choosing the Right iOS Attribution Stack
6. Attribution, Privacy & Measurement
Attribution rules and governance control dashboard data. Clear rules and proper data hygiene ensure meaningful KPIs.
Attribution Windows & Multi-Touch vs. Last-Touch
Attribution windows, like the period after a click or view when an install is tracked, can influence performance results.
Last-touch attribution gives all credit to the last click or view before the install.
Multi-touch attribution splits the credit across several interactions that lead to the install.
It’s essential to understand how your chosen model impacts key performance indicators (KPIs) for channels before comparing networks or campaigns.
Deterministic vs. Probabilistic Attribution
Deterministic attribution uses exact user data (like device IDs) and is very accurate but limited by privacy rules.
Probabilistic attribution uses data patterns to estimate the source of installs when exact data isn’t available. It’s less accurate but helps fill gaps.
Using both methods and models helps maintain useful reporting despite privacy limits.
Fraud Detection & Data Quality
Look out for these common fraud signs:
Unusual spikes in installs that don’t match ad spend.
Extremely high click-to-install ratios.
Strange session timings or repeated installs from the same device or IP address.
To avoid budget waste and incorrect lifetime value (LTV) estimates, invest in fraud prevention and monitoring tools.
Ensure consent flows record user choices and retain identifiers only as allowed. Log aggregated conversion data separately, and ensure that server-side logs have the necessary details for auditing.
Also Read: Understanding Mobile App Attribution
7. Experimentation, Incrementality, and Marketing Mix Modeling (MMM)
Use experiments for causal insights, holdouts for lift validation, and MMM for strategic budget allocation when user-level attribution is limited.
A/B Testing and Holdout Groups
A/B tests randomize users into variants to compare primary and secondary KPIs, running long enough to capture effects on retention and monetization. Holdout groups, excluded from the campaign, show the counterfactual (what would have happened without the tactic). Proper randomization and isolation are key to avoiding contamination between groups.
Incrementality Testing
Incrementality measures the true effect of a campaign. Key design tips:
Use a statistically powered holdout group,
Run the test long enough to accurately capture conversions and retention,
Ensure that the control group has no exposure
Compare short-term and long-term metrics (retention, LTV).
This ensures you’re measuring new users, not just reallocating existing ones.
Marketing Mix Modeling (MMM)
MMM analyzes historical data (spend, installs, sales) to estimate each channel’s contribution. It's best suited for privacy-sensitive contexts and long-term budget allocation, rather than for daily optimization or creative decisions.
Combining Methods for Effective Measurement:
Use MMM for high-level budget allocation and seasonality insights.
Validate campaign formats and creatives with incrementality tests.
Optimize bids and creative at scale using predictive LTV and short-term experiments.
These methods reduce reliance on imperfect signals.
Practical Tips for Valid Experiments:
Run power calculations to set the sample size and the minimal detectable effect.
Ensure treatment and control groups are large enough for meaningful comparisons.
Measure over a sufficient window (7–30 days) to capture retention and LTV.
Monitor guardrail metrics (e.g., crash rates) to avoid product regressions.
Treat experiments, incrementality tests, and MMM as complementary tools: experiments provide causal proof, holdouts validate lift, and MMM informs budget allocation.
8. Reporting, Dashboards & Alerts
A regular reporting system helps teams stay on track and quickly spot any problems.
Weekly Product Dashboard
The weekly report should cover:
Key metrics like daily active users (DAU), new installs, and revenue.
Retention trends for recent user groups.
Health of user flows (onboarding and purchases).
Lifetime Value (LTV) by user group and main marketing channels.
Any major changes in product metrics, like crash rates or load times.
The data should be visualized with trends and separated by platform and key marketing campaigns.
Daily Checks and Alerts
Daily Checks: Monitor DAU trends, new installs vs. targets, key points in user funnels, and any spikes in crashes or errors.
Alert Rules: Set up alerts for sudden drops in DAU, sharp increases in crashes, a significant fall in conversion rates, or issues with data feeds.
These alerts should trigger quick actions so the right team can address the problem fast.
Tips for Dashboards
Use simple charts with clear categories (like platform, campaign, or country).
Allow filtering by user group (cohort) and date to help teams focus on specific data.
Keep a one-page summary for leadership and provide more detailed pages for product and marketing teams to explore deeper insights.
Weekly dashboards, along with daily alerts, help establish a regular routine. This routine allows you to act on data, reducing surprises quickly.
Pulling all of this together, here’s the core approach to building reliable, privacy-aware mobile app analytics.
Also Read: Top Creative Analytics Tools for Successful Ad Campaigns 2025
Conclusion
Choose a small, question-driven set of KPIs, validate with cohort checks and experiments, and ensure measurement and attribution are reliable to base decisions on solid signals. Use diagnostic analysis and quick holdouts to identify causes, then incorporate validated predictions into rules or automations that modify campaigns or product flows. Incorporate privacy-aware modeling and conduct regular backtests to maintain trustworthy forecasts as platform signals change.
Segwise’s multimodal AI automatically tags creative elements (hooks, scenes, audio, playables, etc.) and links those element-level tags with ad-network and MMP attribution data to surface tag-level and creative-level KPIs (ROAS, CPA, IPM, CPI, cohort LTV) in a single dashboard.
Ready to try this in practice? Start a 14-day free trial.
FAQs
1. Which 3 metrics should I start tracking first for my app?
Pick one acquisition metric, one activation/engagement metric, and one monetization metric that answer your top business question. Example: Installs (or CPI), Day-7 retention (or onboarding completion), and cohort LTV. Make sure each metric has a clear definition and a reproducible query.
2. How do recent privacy changes (SKAdNetwork / Privacy Sandbox) affect my metrics?
Apple’s SKAdNetwork offers privacy-focused, aggregated postbacks instead of device IDs. Apple also has AdAttributionKit and AdServices for privacy-aware attribution. Google’s Privacy Sandbox for Android provides aggregated attribution APIs, removing cross-app identifiers; its rollout differs from Apple’s and is evolving. Expect more delayed signals and plan cohort-based comparisons.
3. How can I estimate LTV when per-user identifiers are limited?
Use early behavioral signals and predictive LTV models, join server-side revenue where possible, and validate with backtests on historical cohorts. Retrain models when input distributions shift and compare model outputs to aggregated postbacks or server revenue to detect drift.
4. What quick data-quality checks catch bad signals or fraud?
Monitor install vs. spend anomalies, extreme CTR→install ratios, unexpected spikes in installs, repeated installs from the same IP/device patterns, and mismatches between SDK and server revenue. Keep a strict event taxonomy and run automated anomaly/fraud detection on both SDK and postback logs.
5. Which analytics actions reliably lift retention and activation?
Map onboarding and purchase flows into funnels, identify the largest drop-off steps, run randomized A/B tests or holdouts on fixes, and use session replays or traces to pinpoint UX friction. Measure effects on Day-1/Day-7 retention and downstream monetization.
