How to Test Creatives in the iOS-era: The 2026 Playbook
Creative testing in 2026 means designing for a world where you get fewer signals, longer windows, and smaller variances you can detect, so the math has to be planned before the spend, not after. For UA managers and creative strategists running iOS, that means fewer concepts in parallel, larger budgets per cell, and kill rules tied to signal availability rather than gut. Segwise's Creative Strategy Agent answers which creative element drove the win across all your ad network and MMP data, so the analysis stops bottlenecking the next test.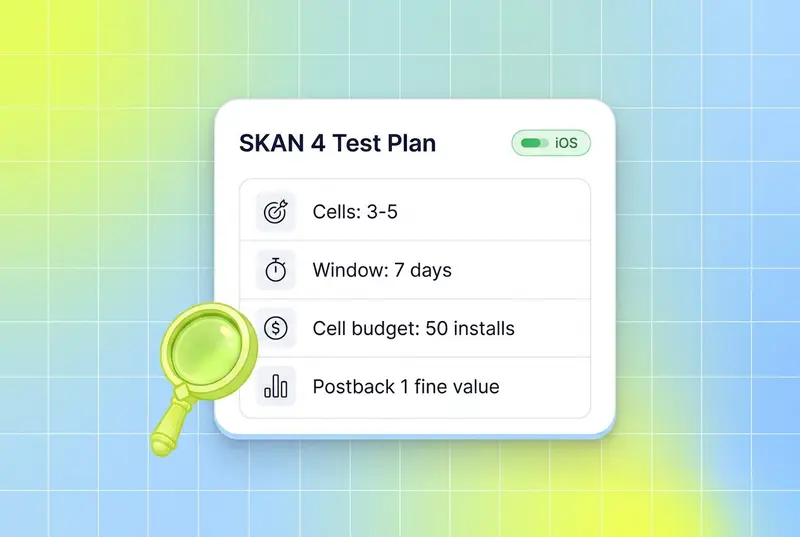
The pre-iOS playbook for creative testing was simple. Throw five to ten concepts into a campaign, watch CTR and install rate for 48 hours, kill the bottom half, scale the top one. That worked because the IDFA gave you deterministic, near-real-time, deep-funnel data per creative.
That world is gone. With SKAdNetwork 4, Apple shifted iOS attribution to a privacy-preserving framework with up to three postbacks across 35 days, fine-grained conversion values capped at 0–63, and crowd-anonymity tiers that gate how much detail you actually receive, per Adjust's SKAN 4 documentation. The first postback can be delayed 24–48 hours after a 0–2 day measurement window. Postbacks two and three only return coarse values: none, low, medium, or high.
Less signal, longer windows, smaller detectable differences. Those three constraints are why the old testing math fails on iOS in 2026, and why the teams winning are the ones who rebuilt their playbook around the new statistics. Performance is increasingly creative-driven: AppsFlyer's Performance Index 2025 analyzed 16.2 billion installs from 39,000 apps and added a Creative Index because creative is now the lever moving rankings. Get the testing math wrong and you spend into noise.
This guide is the 2026 SKAN-era creative testing playbook. It covers why pre-iOS methods fail, how to size tests for the new math, how to structure CBO vs ABO for creative testing, how many concepts to run in parallel, when to kill, when to scale, and how to read creative reports beyond CTR.
Also read How to Test Playables: Why CTR Is the Wrong Metric in 2026
Key Takeaways
SKAN 4 returns up to three postbacks over 35 days with random delays of 24 to 144 hours, and only the first postback returns the fine-grained 0–63 conversion value, per Adjust. Treating the first 48 hours as deterministic the way you did pre-iOS produces false winners.
Apple's crowd-anonymity tiers gate what data you receive. Tier 0 returns only a 2-digit source identifier on postback 1 and nothing else. Most platforms need around 50 conversion events per campaign per week before fine values flow reliably, per Bidease's SKAN guidance.
Use ABO for clean creative tests. ABO gives every cell a guaranteed budget so cells reach minimum sample size at the same rate, while CBO concentrates spend on early winners and starves the rest.
Cap parallel concepts at three to five per test round on iOS. More cells fragment installs across SKAN's anonymity thresholds, push more cells into coarse-only buckets, and reduce statistical power.
Set kill rules against pre-install metrics first (hook rate, CTR, IPM) and confirm with SKAN postback values once the 48-hour window closes. Strong creators target hook rate above 30 to 40% and IPM above category benchmarks before even reading conversion value data.
Read creative reports beyond CTR. Hook rate, hold rate, IPM, coarse conversion mix, and tag-level performance tell you whether a creative actually drove the install. CTR alone influences only a small share of ROI on iOS, where the install-to-event chain is what counts.
Why pre-iOS testing methods don't work anymore
The pre-iOS testing loop assumed three things: deterministic per-user attribution, near-real-time conversion data, and unlimited cell granularity at low spend. SKAN 4 breaks all three.
Deterministic attribution is gone. SKAN attributes a winning ad at the campaign or source-identifier level and returns aggregated postbacks. There is no user-level join. That alone forces you to design tests where the unit of analysis is the campaign cell, not the user.
Real-time data is gone. The first SKAN 4 postback is sent after a 0–2 day measurement window plus a random 24–48 hour delay, per Apple's release notes and Adjust's documentation. Postbacks two and three add even more delay (24–144 hours) and only return coarse values. The faster you try to act, the noisier your data.
Cell granularity is gated by crowd anonymity. Apple's data tiers (0, 1, 2, 3) determine what each postback actually contains, per Adjust's data tier table. Splitting a campaign into 10 small cells does not give you 10 measurable test groups. It gives you 10 cells that each fall into low anonymity tiers, returning only coarse values or null. The more granular you push, the less data you get back.
The result is a counterintuitive shift. On iOS in 2026, you test fewer concepts, with more budget per cell, over a longer window, and you read the data later. That is not slower for the sake of slow. That is what the statistics actually require.
The new testing math: statistical power, signal windows, sample size
A/B testing on SKAN is the same statistics as anywhere else. The difference is what counts as "data." On iOS, you cannot bend the framework, so you bend the test design.
Statistical power and minimum detectable effect
The conventions of A/B testing still apply: target 80% statistical power and 95% confidence, per general A/B testing guidance from Statsig and others. What changes on SKAN is the minimum detectable effect (MDE) you can realistically pick up.
With deterministic attribution, you could detect a 5% lift in install rate at moderate budgets. Under SKAN, that lift is buried under the noise of fine-to-coarse value collapses, null postbacks, and 24–48 hour postback delays. Most teams running rigorous SKAN tests target MDEs of 15–20% or larger for fine-grained metrics, and even larger for coarse-only metrics, because anything smaller falls inside the noise band.
The practical rule: if your business case requires detecting a 5% lift in D7 ROAS on iOS, you cannot run that test on SKAN with normal budgets. Either commit to incrementality testing through Apple Search Ads or web-to-app, or accept that you are testing for bigger effect sizes.
Sample size and the 50-conversion threshold
For creative testing under SKAN 4, two thresholds matter. First, the standard A/B testing threshold: at least 1,000 impressions and 100 conversions per cell to read pre-install metrics with confidence. Second, the SKAN-specific threshold: roughly 50 conversion events per campaign per week before Apple reliably returns fine-grained values, per Bidease.
Below 50 weekly installs per campaign, expect coarse-only or null postbacks. Below 10–20 installs in a measurement window, expect Apple to block the postback entirely. Cell sizing has to clear both bars.
A worked example: testing 4 creative concepts on iOS. To clear the SKAN threshold, each cell needs to reach roughly 50 installs per week. If your iOS CPI is $5, that is $250 per cell per week, $1,000 total. If your CPI is $20, the same test costs $4,000 weekly. Subscription apps with $50+ CPIs face hard tradeoffs at this stage.
Signal windows and reading the data
Each SKAN 4 postback has its own signal window, per Adjust's data tier breakdown:
Postback 1: 0–2 day measurement window, 24–48 hour delay. Fine-grained value possible if tier 2 or 3.
Postback 2: 3–7 day measurement window, 24–144 hour delay. Coarse only.
Postback 3: 8–35 day measurement window, 24–144 hour delay. Coarse only.
The right behavior is to read each window separately. Postback 1 tells you about install and early engagement. Postback 2 tells you about D3–D7 retention or monetization (in coarse buckets). Postback 3 tells you about D8–D35 LTV. Reading them as one rolled-up number throws away the only post-install signal SKAN gives you.
The lockWindow API lets you finalize a conversion value early and trigger the postback faster, per Apple's release notes. Use it when your business case is a fast event (a tutorial complete, a first session) and you want the postback to fire quickly. Skip it when LTV signal matters more than speed.
CBO vs ABO for creative testing
The CBO vs ABO debate predates iOS, but iOS makes the right answer sharper. The two strategies serve different jobs.
ABO (Ad Set Budget Optimization) gives every ad set a fixed, guaranteed budget. CBO (Campaign Budget Optimization) hands one campaign-level budget to Meta's algorithm and lets it allocate across ad sets dynamically.
For creative testing, ABO wins. Here is why.
ABO for testing: clean, controlled, statistically valid
ABO is the right structure for a creative test because it forces every cell to reach minimum sample size at roughly the same rate. The primary strength of ad set budget optimization (ABO) is the absolute control it provides during the testing phase, allowing you to force spend into specific niches to prove their potential, and ensuring every variable receives a non-negotiable budget for a clean comparison.
On iOS, that statistical fairness is structural. If a CBO campaign concentrates 80% of spend on cell A in the first six hours, cells B, C, and D will not clear the 50-install SKAN threshold during the test window. You will never get fine-grained postbacks on the cells you actually wanted to test.
ABO with one creative per ad set, equal budgets, and a fixed test duration is the cleanest design. It is more expensive than CBO because it removes algorithmic optimization, but the cost is the price of clean signal.
CBO for scaling: when winners are validated
Once a creative wins an ABO test, move it into a CBO campaign for scaling. CBO does the job ABO cannot: it lets the algorithm reallocate spend toward the highest-LTV cohorts as new creatives enter the lineup. The hybrid approach is what most large iOS spenders run today.
The mistake to avoid is testing in CBO. The temptation is real because CBO is "smarter" and looks more efficient. On iOS, CBO testing produces winner bias and underpowered loser cells. The smaller the variance you are trying to detect, the worse the bias.
Cost cap as a third option
For accounts spending over $500K per month on Meta, Ben&Vic recommends cost cap as a third option: one ABO campaign, one ad set per concept, with cost-cap bidding. This caps the floor on efficiency while still forcing each cell to reach SKAN sample size. It is more advanced and less forgiving but produces the cleanest read at high spend.
How many concepts to test in parallel
Pre-iOS, the answer was "as many as your budget allows," because every creative gave you per-user data. On iOS, the answer is much smaller and depends on three constraints: minimum sample size, anonymity tiers, and budget.
The 3-to-5 rule
Most practitioners now cap parallel creative cells at three to five per test round on iOS. AppSamurai's SKAN 4.0 guidance and Ben&Vic's testing framework both arrive at similar numbers, for the same reasons.
At three to five cells, every cell can clear the 50-install weekly threshold at reasonable budgets, every cell stays in tier 2 or tier 3 anonymity, and the test runs hot enough to read postback 1 inside a single week.
At ten cells with the same budget, every cell is starved. Apple downgrades multiple cells to coarse-only or null. You read fewer signals and you read them later. The math gets worse, not better.
Concept testing vs variant testing
Within the 3-to-5 cap, there is a useful distinction between concept testing and variant testing.
Concept testing compares fundamentally different creative ideas: a UGC tutorial vs a gameplay montage vs a celebrity hook. Each cell is a different hypothesis. Three to five cells is the right cap because the variance between cells is large and the statistical power requirement is moderate.
Variant testing compares small changes to a winning concept: hook A vs hook B on the same UGC tutorial. The variance is smaller, so the cells need more budget to read. Two to three variants per round is the right cap. More than that and you cannot detect the small lift you are looking for.
The mistake is mixing the two in the same campaign. Test concepts first, find the winning concept, then test variants on that concept. This is the loop that compounds learnings over months instead of fragmenting them.
When to kill, when to scale
SKAN's signal delays make the kill/scale decision harder than it was pre-iOS. The 0–2 day window plus 24–48 hour postback delay means you do not have install-level performance data until 48 to 96 hours after launch. Reading too early kills good creatives. Reading too late wastes budget.
The right approach uses a two-stage decision: pre-install signals first, then SKAN postback signals.
Stage 1: pre-install kill rules (0 to 24 hours)
Before SKAN data arrives, use the metrics Meta and TikTok report directly: hook rate, hold rate, CTR, and IPM (impression-to-install rate, from the ad network).
Established kill thresholds, drawn from Stackmatix's creative testing framework:
Hook rate (3-second view rate) below 30 to 40% after 1,500 impressions: the creative is not stopping the scroll. Kill.
CTR below 1.5% after 2,000 impressions on conversion campaigns: not enough downstream intent. Kill.
IPM below category benchmark (highly category-dependent) after the first 24 hours: kill.
These are pre-install signals. They are not perfectly correlated with SKAN postback values, but they catch the obvious losers fast.
Stage 2: SKAN-confirmed scale rules (48 to 96 hours)
Once postback 1 arrives, you have the first real downstream signal. The scale rule is simple: if a creative beats the test target (typically D2 ROAS or fine-grained conversion value buckets) by a clear margin, scale. If it underperforms by a clear margin, kill. If it lands in the middle, give it another 48 hours and read postback 2.
A working scale heuristic some teams use: "any creative achieving CPA below target after $100 spend graduates to scaling. Creatives with CPA above 1.5x target after $100 spend get killed. Everything in between continues testing until $200 spend," per Stackmatix. Calibrate the dollar amounts to your CPI and category, then commit to the rules.
The hard part is the patience to read postback 2 and 3 before declaring a winner. A creative with weak postback 1 but strong postback 3 (good D8–D35 LTV) is the highest-value win you can find on iOS. Killing it on day 3 means losing the LTV creative entirely.
When to lock the conversion value early
Apple's lockWindow API finalizes the conversion value before the measurement window ends, per Apple's release notes. Use it when your scale decision depends on a fast event (first session, tutorial completion) and you want postback 1 sooner. Skip it when LTV signal matters more than speed; the default 48-hour window will give you a richer fine-grained value to read.
Reading creative reports beyond CTR
The biggest mistake teams make on iOS is judging creatives on CTR. CTR alone, divorced from downstream signals, is a poor predictor of ROAS, per Madgicx's research summary citing Martech: CTR influences only 4% of ROI. On SKAN, where the install and post-install chain is what generates revenue, CTR is the start of the funnel, not the verdict.
The reports that matter on iOS in 2026 cover six metric layers.
Pre-install (from the ad network, real-time)
Hook rate (3-second view rate). Strong creators target 30 to 40% on Meta and TikTok.
Hold rate. The percentage of viewers who watch through 75% or more. Diagnostic for whether the middle of the creative is doing its job after the hook lands.
CTR. Useful as a proxy for intent, but only when paired with hook rate and IPM.
IPM (impression-to-install rate). The pre-install conversion metric that survives best on iOS, because it sits inside the ad network's attribution and is reported in real time, per AppsFlyer's path-to-install analysis.
Post-install (from SKAN postbacks, delayed)
Fine-grained conversion value distribution from postback 1 (when tier 2 or 3). The 0–63 value lets you map specific events: 0 = install only, 32 = first session complete, 48 = first purchase, etc. The schema is yours to design.
Coarse conversion value mix from postbacks 2 and 3. The percentage of installs that hit none, low, medium, or high. This is the rough LTV signal.
Tag-level performance
Beyond aggregate creative performance, tag-level reporting is what tells you which element drove the win. Hook style, character, CTA, audio mood, on-screen text, scene transitions, color palette: each of these tagged across hundreds of creatives reveals patterns no single creative report can.
Manual tagging at this depth costs roughly 20 hours per week per app, a number teams routinely report when they actually try. Most teams skip tagging entirely and lose the analysis.
This is where multimodal AI auto-tagging changes the workflow. Segwise's Creative Tagging Agent tags video, audio, image, and text together: hooks, characters, scene changes, on-screen text, voiceover style, music type, emotional tone, CTAs. It is also the only platform that tags playable (interactive) ads, which matters for mobile gaming UA on networks like AppLovin, Unity Ads, IronSource, and Mintegral.
The Creative Strategy Agent sits on top of those tags. You ask in plain language: "which hook style drove the most fine-grained conversion value above 32 on Meta last month?" or "what's different between my top 5 and bottom 5 iOS creatives by D7 coarse value?" The answer comes from your unified data across Meta, Google, TikTok, Snapchat, YouTube, AppLovin, Unity Ads, Mintegral, IronSource, plus AppsFlyer, Adjust, Branch, and Singular. No dashboard building, no SQL, no manual tagging.
That changes what creative reports look like. Instead of a CTR leaderboard, you get a mapping from tagged elements to actual SKAN-confirmed performance, the analysis layer the iOS-era playbook actually needs.
Putting it all together: a 2026 SKAN-era test plan
A clean creative test on iOS in 2026 looks like this.
Pick three to five concepts that reflect different hypotheses about what will work for your audience. Build them so each fits your fine-grained conversion value schema, meaning the test events are the same across cells.
Run them in an ABO campaign with one ad set per concept and equal budgets sized to clear 50 installs per week per cell at your iOS CPI. Use Meta's standard targeting and let the test run for a full week minimum.
Read the data in stages. In the first 24 hours, kill cells that miss hook rate, CTR, or IPM thresholds. After 48 hours, read postback 1 fine-grained values. After 7 days, read postback 2 coarse mix. After 14 days, read postback 3 if you are testing for LTV.
Use a tag-level analysis layer to figure out which element drove the win. The whole point of running the test was to learn something repeatable. If the analysis stops at "concept B beat concept A," you have a winner but not a learning. The win is the tag mapping you can apply to the next test.
Move the winners into a CBO scaling campaign and let the algorithm reallocate spend across new creatives as they enter the lineup. Restart the testing loop with new concepts in the next ABO test.
This is the loop that compounds. Each test feeds the tag library. Each tag insight feeds the next brief. Each brief produces creatives that are statistically more likely to win. Skip the loop and you are testing in noise.
Conclusion
The iOS-era creative testing playbook is not the pre-iOS playbook with smaller budgets. It is a different statistical regime that rewards fewer concepts, larger cells, longer windows, and analysis layered on tagged creative data rather than raw CTR. Less signal, longer windows, smaller variance you can detect: those constraints are what define every decision from how many cells you run to when you read the data.
Get the math right and iOS becomes a clean testing surface again. Get it wrong and you spend into noise, kill winners early, and scale random walks. The teams winning iOS in 2026 are not the ones running the most ads. They are the ones running the right number of ads at the right size for long enough to read the postback that matters, and using auto-tagging to turn each test into a learning that compounds.
If you want to stop spending hours stitching SKAN postbacks, ad network reports, and creative tags into a story, Segwise's Creative Strategy Agent sits across all of it and answers in plain language. Up to 20 hours saved per week per app or brand, plus the tag-level analysis that the iOS-era playbook actually requires.
Frequently Asked Questions
How does SKAN 4 change creative testing on iOS in 2026?
SKAN 4 returns up to three postbacks across 35 days with random delays of 24 to 144 hours, and only the first postback returns a fine-grained 0–63 conversion value, per Adjust. That changes creative testing in three ways: tests run on cells, not users, with longer read windows, and need to clear Apple's roughly 50 weekly conversion threshold per campaign before fine values flow reliably. Most teams now cap parallel creative cells at three to five per round and use ABO budget structures so every cell clears that threshold. Tools like Segwise, Adjust, and AppsFlyer help teams design SKAN conversion schemas and read postbacks at scale.
What does this mean for UA managers running iOS in 2026?
For UA managers, the iOS-era playbook means designing tests with sample size and signal availability in mind, not gut. That means fewer concepts in parallel, larger budgets per cell, kill rules that read pre-install metrics first and SKAN postbacks second, and an analysis layer (manual tagging or AI auto-tagging) that can map winning elements across hundreds of creatives. Without that layer, you are reading aggregate CTR on iOS and missing the real driver of ROAS. Platforms like Segwise, AppsFlyer, and Singular each offer their own version of this analysis layer for iOS UA teams.
How do I run a creative A/B test on SKAN 4?
Start with three to five concept cells in an ABO campaign with equal budgets. Size each cell to reach roughly 50 installs per week at your iOS CPI so postback 1 returns fine-grained values. Run the test for a full week minimum. Read pre-install metrics (hook rate, CTR, IPM) in the first 24 hours and postback 1 fine values after 48 hours. Read postback 2 (D3–D7 coarse) after a week and postback 3 (D8–D35 coarse) after two weeks if LTV matters. Move winners into a CBO scale campaign. Tools like Adjust, AppsFlyer, Singular, and Segwise help with the postback reading and the cross-creative tag analysis.
What's the difference between CBO and ABO for creative testing?
ABO gives each ad set a fixed budget, so every cell reaches sample size at roughly the same rate, which is what creative testing needs. CBO lets Meta's algorithm reallocate budget toward early winners, which starves the cells you are trying to test. Use ABO for testing creatives, then move winners into CBO for scaling. Segwise tracks performance across both structures so you can compare ABO test reads against CBO scale performance in one view.
How many creative concepts should I test in parallel on iOS?
Three to five concepts per test round is the working cap on iOS in 2026. Below three, you are not really testing. Above five, every cell starves and Apple downgrades multiple cells to coarse-only or null postbacks because they fail the crowd-anonymity threshold, per AppSamurai's SKAN 4.0 guidance. Within that cap, distinguish concept tests (different ideas, 3–5 cells) from variant tests (small changes to a winning concept, 2–3 cells). Segwise, AppsFlyer, Adjust, and Singular each support analysis at this cell granularity.
When should I kill a creative on iOS, and when should I scale?
Kill on pre-install metrics first. If hook rate stays below 30% after 1,500 impressions or CTR stays below 1.5% after 2,000 impressions, kill. Scale based on SKAN postback 1 fine-grained values once they arrive 48 to 96 hours after launch. A common rule: scale creatives that beat target CPA after $100 spend, kill those above 1.5x target after $100 spend, and continue testing the middle to $200 spend, per Stackmatix's framework. Calibrate the dollar amounts to your CPI. Segwise, AppsFlyer, and Adjust all surface these signals at the creative level.
What metrics should I track beyond CTR?
CTR is the start of the funnel, not the verdict. On iOS, track hook rate (3-second view rate, target 30–40%), hold rate (75%+ view rate), IPM (impression-to-install), fine-grained conversion value distribution from postback 1, coarse value mix from postbacks 2 and 3, and tag-level performance across hooks, CTAs, audio, and visual elements. Tag-level analysis is what tells you which element drove the win, per AppsFlyer's State of Creative Optimization 2025. Segwise auto-tags every creative across video, audio, image, and text, including playable ads, and maps each tag to performance. Singular and AppsFlyer also support tag analysis for teams using their MMPs.
How long should an iOS creative test run?
Minimum one week, ideally two. Postback 1 needs 48 to 96 hours to arrive after first install. Postback 2 needs 8 to 11 days to read D3–D7 coarse values. Postback 3 needs up to 35 days plus delay if LTV is the test metric. Reading the test before postback 1 is too early. Reading after postback 2 covers most install-to-D7 decisions. Use Apple's lockWindow API only when you need a faster read on a fast event, per Apple's release notes.
Why does my SKAN postback show "null" or coarse values only?
Null and coarse-only postbacks happen when a campaign falls into a low crowd-anonymity tier. Tier 0 returns only a 2-digit source identifier on postback 1. Tier 1 returns coarse values across all three postbacks. Tier 2 unlocks fine-grained values on postback 1, per Adjust. To move into higher tiers, increase install volume per campaign (typically 50+ weekly), reduce campaign fragmentation, and consolidate budget into fewer cells. Segwise and AppsFlyer help teams visualize tier distribution across campaigns.
