How to Test Playables: Why CTR Is the Wrong Metric in 2026
In 2026, click-through rate is the wrong primary metric for testing playable ads. Playables are mini-games, not videos, and judging them by CTR inadvertently rewards networks and templates with auto-click mechanisms rather than the creatives that actually drive installs and retention. For UA managers running playables on AppLovin, Unity Ads, Mintegral, and IronSource, the more honest scoreboard is engagement inside the playable, completion rate, CPI lift over the end-card, and post-install retention. Segwise's playable ad tagging is the only multimodal AI that breaks playables down to the mechanic, on-screen text, and CTA level, so you can see which elements inside the ad are actually moving the needle.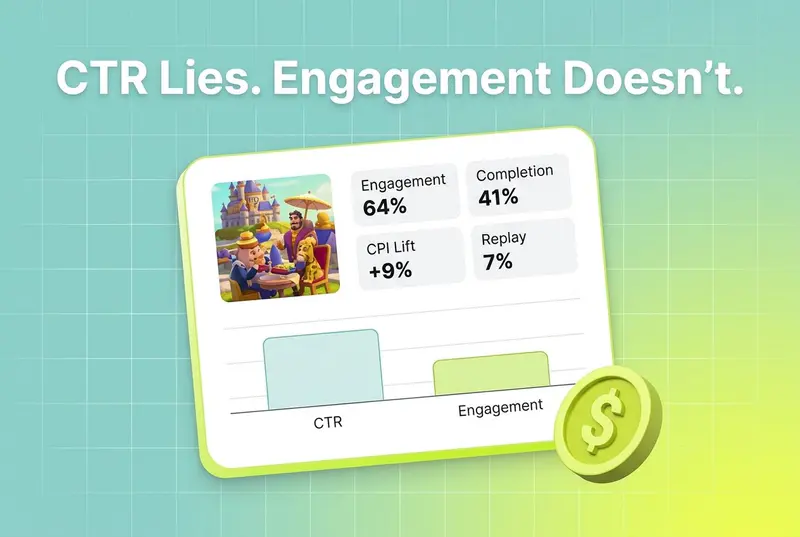
Playables have moved from a niche format to a core part of mobile UA. iLogos reports that interactive playables consistently outperform static and video ads, with 30 to 40 percent higher click-through rates in casual genres, and they have become especially important in a privacy-first world shaped by iOS SKAN and the Android Privacy Sandbox. Adjust's primer on the format makes the same case from the install side: playables let users try a sample of the app before installing, which decreases churn and uninstall rates, increases retention, and lifts LTV.
The problem is not the format. The problem is how teams test it. Most UA teams still grade playables with the same KPI they grade video and static with: click-through rate. CTR looks like the easiest number to read, and it is the loudest number on every dashboard. But CTR was never built for an ad where the user is supposed to spend 20 to 40 seconds inside the creative before they ever decide to install. Treat a playable like a video and you will kill perfectly good creatives because their CTR looks soft, while scaling broken ones that just happen to live on a network with auto-click-friendly templates.
This post is a working reference for how to test playables in 2026. We will cover why playables need a different framework, which metrics actually matter (engagement, completion, replay, CPI lift over end-card, post-install retention), the quirks of testing on AppLovin, Unity Ads, Mintegral, and IronSource, how to run playable tests during soft launch under SKAN and Privacy Sandbox, and how to read the resulting analytics without getting fooled.
Also read TikTok Creative Challenge for App UA: Is It Actually Worth It?
Key Takeaways
Playables are mini-games and need to be tested as such. iLogos puts the engagement edge at 30 to 40 percent higher CTR than static and video in casual genres, but that CTR is downstream of the experience, not the experience itself.
Click-through rate alone is misleading. GameBiz's analysis of Unity AdQuality data across multiple titles in November 2025 found that the networks with the highest CTRs were also the networks with the highest churn, engagement that "looked like monetization quietly translated into player loss."
Auto-clicks inflate CTR on certain networks. The same GameBiz dataset shows AppLovin reaching 91–92 percent CTR on rewarded video and Mintegral hitting auto-click rates as high as 87–90 percent, which means a sizeable share of clicks are template-driven, not intent-driven.
The metrics that matter are engagement (did they interact?), completion (did they finish the mini-game?), replay rate, CPI lift over end-card-only, and post-install retention. Adjust cites a Facebook case study where playable ads helped Me2Zen lift ROAS by 50 percent, triple in-app purchases, and decrease CPI by 9 percent.
Networks behave differently. AppLovin scales but is auto-click heavy. Mintegral is similar. Unity Ads tends to run longer ad durations. IronSource sits in the middle on engagement and lower on churn. Each needs its own benchmark, not a shared CTR threshold.
Under SKAN and Privacy Sandbox, soft-launch testing means designing conversion values around playable engagement (level finishes, mini-game completion) and using Topics on Android to align playables with player interests.
Liftoff's 2025 Mobile Ad Creative Index frames the industry view: top apps and games are redefining the baseline of what ad experiences look like, with interactive formats and AI-supported creative production at the centre.
Why playables need a different testing framework
A playable ad is not a 30-second video with a button on the end. It is a 20- to 40-second mini-game with an install button that, per iLogos, should be persistent and on-screen the whole time. That structural difference changes everything about how you read the test.
Adjust describes playables as a scaled-down version of the app's essential features, built so a user can try before they buy. That try-before-buy behaviour is the entire point. Users who choose to install after playing already know what the core loop feels like, which is why the format reduces churn, raises retention, and pushes LTV up. The Me2Zen case study Adjust cites is the cleanest version of this story: 50 percent ROAS lift, three times the in-app purchases, and a 9 percent CPI decrease, all from a playable swap.
iLogos lists the anatomy of a high-performing playable in 2026 in the same terms a product team would use for a game build: time-to-fun under 10 seconds, a tutorial-light design that demonstrates the mechanic in a single tap or animation, accurate visual fidelity to the real game, and a build size kept under 2 MB so the playable loads before the user gives up. None of those are CTR levers. They are engagement levers. If your test framework only reads what happens at the click, you cannot tell the difference between a playable that hooked the user in 8 seconds and one that the network's end-card just nudged into the store.
GameBiz puts the cost of misreading this in concrete terms. Their analysis of Unity AdQuality data across multiple games in November 2025 found a recurring pattern: extremely high click-through rates were frequently paired with elevated churn after the ad interaction. What looked like engagement on the dashboard was often accidental. What looked like monetization quietly translated into player loss. The same logic that applies to ad monetization on the publisher side applies to UA testing on the buyer side. A click that is not chosen tells you almost nothing about the creative.
The framework shift is simple. For video and static, you grade on CTR and CPI. For playables, you grade on what happens between the impression and the install, plus what happens for the seven to fourteen days after. The right test is closer to a soft-launch product test than to a creative test.
The metrics that actually matter
Use these as your default scoreboard for playable tests. Each one captures something CTR misses.
Engagement rate. The percentage of impressions where the user actively interacted with the playable, beyond passive viewing or the auto-loaded opening sequence. This is the single best signal that the creative is doing its job. If engagement is high and CTR is low, you have a creative that hooked players but failed to convert at the end-card. That is a fixable problem. If engagement is low and CTR is high, you almost certainly have an auto-click problem.
Completion rate. Did the user finish the mini-game inside the playable? iLogos's prescription for high-performing playables is built around this: time-to-fun under 10 seconds and a tutorial-light design so the user can see a clear win. Completion rate tells you whether the playable's core loop is intelligible. A creative with high engagement and low completion is usually too long, too complex, or too far from what the actual game feels like.
Replay rate. Did the user reset and play again? Replay is rare on ads, and when it happens it is one of the strongest pre-install signals you have. Replay also helps separate genuine interest from accidental engagement, because nobody auto-replays.
CPI lift over the end-card. Most networks let you isolate end-card-only versions of a playable concept. Comparing the full playable's CPI against an end-card-only control is the cleanest way to attribute install lift to the interactive layer specifically, rather than to the underlying art or messaging. Adjust's Me2Zen case study illustrates this pattern: alongside the playable shift, the team saw a 9 percent CPI decrease, a 50 percent ROAS lift, and triple in-app purchases, all install-layer outcomes that raw CTR would never have surfaced.
Post-install retention and ROAS. Try-before-buy users retain better. Adjust's framing, that playables decrease churn and uninstall rates because users have a clear view of what to expect, is the LTV side of the equation. Watch D1, D3, D7 retention from playable installs against your video and static cohorts. If retention is flat or worse, something in the playable is misaligned with the core game experience: check whether the visual fidelity is accurate, whether the tutorial complexity matches the actual game, and whether the end-card messaging is setting the right expectations.
Ad escape rate. Borrowed from GameBiz's monetization framework but useful on the UA side: the rate at which users force-close the ad. High escape on a playable usually means the playable is too long or the install button is not clearly visible. iLogos calls out the persistent CTA explicitly for this reason.
Auto-click rate. This is the hidden metric most UA teams never look at. GameBiz's dataset shows Mintegral hitting auto-click rates as high as 87–90 percent on iOS rewarded video, and AppLovin's iOS interstitials sitting at 65–70 percent auto-click. If your network reports auto-click data (Unity's AdQuality, IronSource's quality glossary, and similar tooling do), use it as a deflator on CTR. A 70 percent auto-click network's "CTR" is not the same number as a 5 percent auto-click network's "CTR."
A simple decision rubric
When you read a playable test result, walk down this list before you call a winner:
If completion rate is high and CPI lift over end-card is positive, the playable is working. Scale it.
If engagement is high but CTR is low, the creative hooks players but the end-card is failing. Strengthen the persistent CTA, the reward language, and the install button contrast before killing the variant.
If CTR is high, completion is low, and auto-click rate is high, the network template is doing the work, not the playable. Treat the install volume as low-quality and watch D1–D7 retention closely.
If retention is flat or worse than your video baseline, audit fidelity, tutorial complexity, and end-card messaging before iterating on mechanic.
If the same playable looks great on Unity Ads or IronSource and bad on AppLovin or Mintegral, suspect template differences before you suspect the creative. Compare engagement and completion across networks, not CTR.

Network specifics: AppLovin, Unity Ads, Mintegral, IronSource
The same playable will behave differently on every network. Some of that is audience. Most of it is the network's ad template. GameBiz's November 2025 dataset, drawn from Unity AdQuality across casual and midcore titles on Android and iOS, makes the differences very visible.
AppLovin/Axon
AppLovin is the scale leader and also the auto-click leader. Across the GameBiz games, AppLovin posted CTRs as high as 91 percent on Android rewarded video and 92 percent on iOS rewarded video, with ad durations averaging over 60 seconds. iOS interstitials drove the worst churn outcomes in the dataset: D1 churn over 22 percent on one title, with the network "winning" worst performance in more than half of all categories analysed.
For playable testing, this means three things. AppLovin will give you reach faster than any other network. Its CTR will look great. And its raw CTR will overstate engagement, because a meaningful share of those clicks are template-driven, not intent-driven. Test playables on AppLovin with engagement and completion as the primary scoreboard, and treat CTR purely as a directional signal.
Unity Ads
Unity Ads sits in the middle of GameBiz's data. CTRs are healthy but not extreme (in the 40 to 70 percent range across formats), ad durations frequently exceed 60 seconds on rewarded video, and churn is moderate. Auto-click rates are present but generally lower than AppLovin or Mintegral.
iLogos calls out TikTok, AppLovin, and Unity Ads as the best places to run casual playables, and Unity's positioning between scale and signal quality is part of why. Use Unity Ads as your read network when you want a cleaner CTR signal, and pair it with AppLovin for volume.
Mintegral
Mintegral has long been the gaming-network specialist on hyper-casual and casual, and its template behaviour shows up in the data. GameBiz reports auto-click rates up to 87–90 percent on iOS rewarded video and CTRs in the 83–88 percent range, with elevated churn on some titles. On Android, Mintegral was the network with the highest churn rate on at least one analysed game.
For playables, Mintegral can produce strong install volume in casual gaming verticals, but the CTR number is unreliable as a quality signal. Trust completion rate, post-install retention, and CPI lift over the end-card. If retention holds, the network is working for the creative. If retention sinks, the creative is being installed by users who never engaged with the playable.
IronSource
IronSource (now part of Unity) tends to come out cleaner in the data: CTRs in the 22 to 81 percent range depending on format, lower auto-click rates than AppLovin or Mintegral on rewarded video, and ad durations that average around 60 to 75 seconds. GameBiz's dataset shows IronSource interstitials on iOS hitting the highest D1 churn (10.8 percent) on one game in their interstitial test, but on rewarded video IronSource's churn numbers were generally lower than AppLovin's.
For playable testing, IronSource is a useful "signal" network. The CTR is closer to true engagement than on AppLovin or Mintegral, so it makes a better A/B reference when you are comparing playable concepts. Use IronSource volume for cleaner reads and AppLovin volume for production scale.
A practical rule: do not set one CTR threshold across all four networks. Set per-network benchmarks based on your historical playable data and grade each test against its network-specific baseline.
Soft-launch playable testing under SKAN and Privacy Sandbox
The privacy environment changed how playables get tested. iLogos summarises the new reality plainly: Apple and Google do not let you track players like before, but you can still learn what works.
On iOS, SKAN postbacks are your only signal for most networks, and you have a limited number of conversion values to encode meaning into. Spend the bits on engagement events, not on click-level proxies. A typical conversion-value schema for a soft-launch playable test reserves the lower values for "install only," middle values for "tutorial complete" or "level 1 finished," and higher values for "purchase" or "session 2." That structure tells you whether the user installed because the playable hooked them, or whether they installed and bounced.
On Android, the Privacy Sandbox shifts you toward the Topics API, which exposes coarse interest categories rather than user-level identifiers. iLogos describes this as Google telling you what kind of games people like, so you match your ad to their interest. For playables, that aligns with the genre-specific guidance Liftoff and others have been pushing for years: build a different playable for puzzle audiences than for builders, and rely on Topics to route the right playable to the right surface.
A soft-launch testing rhythm that works in 2026:
Build two or three versions of the same playable, varying one element each: hook, tutorial step, end-card art, CTA copy. iLogos recommends making 2 to 3 versions of the same ad and varying colors, buttons, or gameplay.
Launch in a small set of soft-launch markets across AppLovin, Unity Ads, IronSource, and Mintegral. Keep network mix consistent across variants.
Read engagement and completion first, then SKAN/CV-encoded post-install events, then ROAS at D7 or D14. Do not call winners on day-one CTR.
Refresh every two to three weeks. iLogos's production prescription, refresh creatives every 2 to 3 weeks or with game updates, fits playables especially well, because the cost of fatigue compounds when the creative is also a product preview. When a mechanic, hook, or end-card variant proves out at this cadence, Segwise's creative generation can produce static iterations on the winning element directly inside the platform, so the next refresh cycle starts from a tested base instead of a blank brief.
Liftoff's 2025 Mobile Ad Creative Index frames the broader expectation: marketers in 2026 are working in an increasingly competitive environment where top apps and games are redefining the baseline of what ad experiences look like. That bar moves up every quarter. A soft-launch testing process that grades on the wrong metric will keep you below it.
Reading playable analytics without getting fooled
The hard part of playable testing is not running the test. It is reading the test.
Three failure patterns show up over and over.
Pattern 1: high CTR, soft retention. This is the AppLovin / Mintegral profile in the GameBiz data. The creative is being clicked, but a lot of those clicks are template-driven. The fix is not to kill the playable. The fix is to look at engagement and completion side by side with CTR. If engagement is real, the creative is doing its job and the install volume is genuine. If engagement is low and CTR is high, you are buying installs that will not stick.
Pattern 2: low CTR, strong engagement. The creative is hooking the players who reach it, but the end-card is not converting. This is a much smaller fix than killing the variant. Try a more contrasting CTA, a clearer reward, or a stronger persistent install button. iLogos's anatomy guide treats this as a default, the install button must sit on-screen throughout the ad, and it is the fix that turns the most "promising but underperforming" playables into scaling concepts.
Pattern 3: cross-network noise. The same playable looks great on Unity Ads and bad on Mintegral. Before you assume the creative is the problem, check whether the network's template is producing different click behaviour. GameBiz's note that Google AdMob's auto-click rates "look alarming" but are an artifact of the end-card overlay is the canonical example of why network-template differences need to be controlled before you compare creatives.
Reading playable analytics well requires creative-level visibility, not just campaign-level visibility. You need to see how each hook, each on-screen text variant, each CTA, and each mini-game mechanic performed across the full funnel. This is exactly where most teams get stuck. Manual tagging across hundreds of playable variants is not realistic, and most analytics platforms cannot read the inside of an HTML5 playable in the first place.
Segwise is the only platform that tags playable (interactive) ads with multimodal AI, analysing video, audio, image, and text together. For playables that means the platform can extract the mini-game mechanic, the on-screen text, the CTA copy, and the visual style as structured tags, and then map those tags to the performance metrics that actually matter for playables: completion, retention, ROAS, and CPI. With Segwise's creative analytics connected to AppLovin, Unity Ads, Mintegral, IronSource, Meta, Google, TikTok, Snapchat, YouTube, and your MMP (AppsFlyer, Adjust, Branch, or Singular), you can compare a "tap-to-merge" playable against a "tap-to-shoot" playable across networks, see which mechanic drove higher D7 ROAS, and iterate on the winning mechanic without rebuilding from scratch.
Bottom Line
CTR was built for ads that ended at the click. Playables do not end at the click. They start there. The teams that test playables like videos in 2026 will keep killing creatives that hooked players in eight seconds and scaling creatives that just rode an auto-click template to the App Store. The teams that read engagement, completion, replay, CPI lift over the end-card, and post-install retention, and do it per network rather than against a global threshold, will scale playables that compound. That is the testing framework playables actually need, and it is the testing framework Segwise's playable ad tagging was built for.
Frequently Asked Questions
Why is CTR the wrong metric for playable ads?
CTR is the wrong primary metric for playables because playables are mini-games where most of the value happens between the impression and the install, not at the click. GameBiz's November 2025 analysis of Unity AdQuality data found that the highest-CTR networks, especially AppLovin and Mintegral, frequently had the highest post-install churn and high auto-click rates that inflated the CTR number itself. iLogos and Adjust both treat playables as engagement vehicles whose value is in completion and post-install retention. Tools like Segwise tag the inside of playables (mechanics, on-screen text, CTAs) so teams can grade creatives on engagement, completion, and CPI lift over end-card, metrics that traditional dashboards built for video and static ads usually obscure.
What metrics should I use to test playable ads instead of CTR?
For playable testing, the right metrics are engagement rate (did the user interact with the playable?), completion rate (did they finish the mini-game?), replay rate, CPI lift over an end-card-only control, post-install retention (D1, D3, D7), and auto-click rate as a deflator on CTR. Adjust's Me2Zen case study is a useful benchmark: the team saw a 50 percent ROAS lift, 3x in-app purchases, and a 9 percent CPI decrease alongside their playable optimization, all install-layer outcomes that raw CTR could not have surfaced. Segwise unifies these metrics across AppLovin, Unity Ads, Mintegral, IronSource, and your MMP so you can read all of them in one view rather than hopping between dashboards.
How does playable testing differ on AppLovin vs Unity Ads vs Mintegral vs IronSource?
The four networks behave very differently on the same creative. According to GameBiz's data, AppLovin produces the highest CTR (up to 91 to 92 percent on rewarded video) but also the highest auto-click rate and post-install churn, so its CTR is unreliable as a quality signal. Unity Ads runs longer ad durations (often 60+ seconds) and lands in the middle of the data on engagement and churn. Mintegral hits very high auto-click rates (up to 87 to 90 percent on iOS) and elevated churn, which means CTR there overstates engagement. IronSource is generally cleaner on auto-click and churn, making it a good "signal" network for A/B reads. Segwise's creative analytics lets you set per-network benchmarks for these networks alongside Meta, TikTok, Google, and Snapchat, instead of comparing them against a single global CTR threshold.
How do I test playable ads under SKAN and the Android Privacy Sandbox?
Under SKAN, encode playable engagement events into your conversion values: reserve lower values for install-only, middle values for tutorial completion or level 1 finishes, and higher values for purchase or session 2. That way the SKAN postback tells you whether the user actually played, not just whether they installed. On Android, use Privacy Sandbox Topics to route different playables to different player interests, iLogos describes this as matching your ad to the kind of games people like. Refresh creative every two to three weeks. Segwise plugs into MMPs (AppsFlyer, Adjust, Branch, Singular) and ad networks to read SKAN-aware performance at the playable element level, similar to how AppsFlyer and other MMPs handle attribution.
What is the ideal length and file size for a playable ad?
iLogos recommends 20 to 40 seconds of interactive gameplay with the install button always visible, and a build size kept under 2 MB. Performance drops sharply beyond 3 MB. Time-to-fun should be under 10 seconds, and the design should be tutorial-light, demonstrating the core mechanic with a single tap or animation. These specs map onto your testing framework: longer or heavier playables tend to have lower completion rates and higher ad escape rates, regardless of CTR. Segwise's playable ad tagging captures the mechanic, on-screen text, and CTA inside each playable so you can compare these design choices against performance, in the same way other creative tagging tools handle video and static.
How often should I refresh playable creatives?
iLogos recommends refreshing playable creatives every 2 to 3 weeks or in line with game updates and seasonal themes. Playables fatigue faster than static creatives because they are also a product preview, so even small changes to mechanics, on-screen text, or end-card can extend a winning concept. Segwise's fatigue tracking watches for the spend-share decline and CTR or ROAS drop that signals fatigue setting in, and alerts you before the creative tanks budget, comparable to fatigue features in other creative analytics platforms.
Can I tag and analyse playable ads the way I tag video ads?
Most creative analytics platforms cannot. Playables are HTML5 mini-games, and reading inside them requires multimodal AI that handles interactive code, on-screen text, and visual elements together. Segwise is the only platform that tags playable (interactive) ads with multimodal AI, extracting mini-game mechanics, on-screen text, CTAs, characters, and visual styles as structured tags, then mapping each tag to install, ROAS, and retention metrics across AppLovin, Unity Ads, Mintegral, IronSource, Meta, TikTok, Google, Snapchat, YouTube, and your MMP (AppsFlyer, Adjust, Branch, Singular). That element-level visibility is what turns "this playable works" into "this mechanic, with this CTA, on this network, drove the install lift", the kind of attribution Adjust's Me2Zen case study hints at when it documents a 9 percent CPI decrease alongside playable optimization.
What's the difference between playable engagement and CTR?
CTR is the percentage of impressions that resulted in a click, including auto-clicks and accidental taps that are inflated by the network's ad template. Engagement, in the playable context, is the percentage of impressions where the user actively interacted with the mini-game beyond passive viewing. The two diverge sharply on AppLovin and Mintegral, where GameBiz data shows auto-click rates can exceed 70 to 90 percent. Engagement is closer to genuine intent. Segwise distinguishes the two by tagging the playable's interactive elements and mapping them to the post-install funnel, so engagement and CTR are both visible next to completion, retention, and ROAS, reported across AppLovin, Unity Ads, Mintegral, IronSource, Meta, TikTok, Google, Snapchat, YouTube, and your MMP (AppsFlyer, Adjust, Branch, Singular).
