MER Is Lying to You: How to Think About Marketing Efficiency
Your MER declined this quarter. Should you be worried?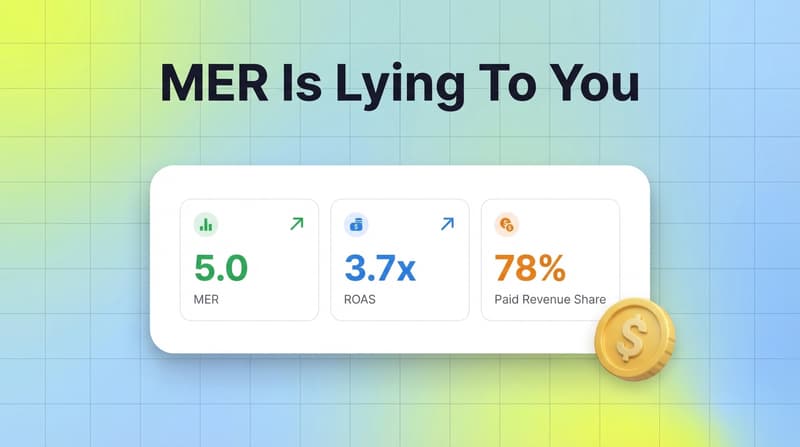
Maybe. Or maybe you just scaled your paid media and it's working exactly as it should.
Marketing Efficiency Ratio is one of those metrics that looks simple until you try to act on it. The formula is clean: total revenue divided by total marketing spend. Higher is better, or so the story goes. But a DTC brand that generates $20M with a 50/50 split between organic and paid will post a fantastic MER. That same brand at $50M, now running 78% paid, will post a worse MER -- even if their ROAS improved, their absolute profit doubled, and every dollar they added to media spend returned more than before.
That's not a failure. That's growth. But MER alone won't tell you the difference.
MER matters beyond ecommerce too. Mobile app marketers, subscription products, and gaming UA teams increasingly use MER as a top-level efficiency check, pairing it with ROAS targets to understand whether their paid acquisition mix is generating sustainable revenue at the business level. Same concept, same traps.
This post breaks down what MER actually measures, where it misleads, and what you should be optimizing for instead.
Key Takeaways
MER (Marketing Efficiency Ratio) measures total revenue divided by total marketing spend, giving a blended view across all channels including organic
A declining MER often means you're scaling paid media, not that your ads are underperforming
According to Triple Whale's 2025 benchmark data, the median MER for ecommerce brands was 41%, meaning $0.41 in spend per dollar of revenue
MER should never be used in isolation. Pair it with ROAS, contribution margin, and net contribution dollars
Optimizing to keep MER high can cause you to cut spend that was actually profitable
Creative quality directly drives paid efficiency -- and creative-level analytics are what let you improve ROAS without just slashing spend
According to Shopify's analysis, companies that adopt MER alongside channel-level metrics achieve 15-20% higher marketing ROI than peers relying on channel metrics alone
Also read Average ROAS for eCommerce in 2026: Benchmarks and Insights
What MER Actually Measures
MER tells you how much revenue the business generates for every dollar of marketing investment across all channels.
Formula: MER = Total Revenue / Total Marketing Spend
Or expressed as a percentage (common in ecommerce): MER% = Total Marketing Spend / Total Revenue
Both versions are used in the industry. Triple Whale expresses MER as a percentage (lower is better). HubSpot and Shopify express it as a multiple (higher is better). Know which version you're using before benchmarking against anyone else.
Unlike ROAS, which credits specific campaigns or channels, MER captures everything: paid social, paid search, SEO-driven organic, direct traffic, email, brand, word of mouth. It doesn't care where the revenue came from. It just compares the total stack.
That's its strength and its blind spot.
As HubSpot describes it, MER is "a blended, executive-level view of overall marketing effectiveness across all channels." That makes it useful for board reporting, annual planning, and evaluating whether marketing as a whole supports profitable growth. It does not make it useful for deciding whether to add $50K to Meta next week.
Why High MER Can Be a Bad Sign
Here's the scenario that breaks most people's mental model of MER, originally shared by a DTC CFO and circulated widely in performance marketing communities:
Year 1:
- $20M revenue
- Revenue mix: 50% organic, 50% paid
- Ad spend: $4M
- MER: 5.0 (or 20% expressed as a cost ratio)
Year 2:
- $50M revenue
- Revenue mix: 22% organic, 78% paid
- Ad spend: $10.6M
- MER: 4.7 (or 21.1%)
On the surface, MER got worse. But look at what actually happened:
ROAS improved from 2.5x to 3.7x
Net contribution dollars (Revenue minus COGS minus Ad Spend) roughly doubled
The business grew from $20M to $50M
The MER dropped because the brand bought a larger share of revenue through paid channels instead of receiving it for free through organic. The organic percentage shrank. The blended denominator got bigger relative to total revenue. But the advertising itself became more efficient.
If you optimize to keep MER high, you protect your organic percentage by limiting paid spend. You end up leaving money on the table because the incremental ROAS on that spend was profitable.
This is what Tailored Edge Marketing calls the "marginal MER" trap: the average MER looks worse even when the incremental return is positive. The fix is to track marginal MER -- incremental revenue divided by incremental spend -- not just the blended average.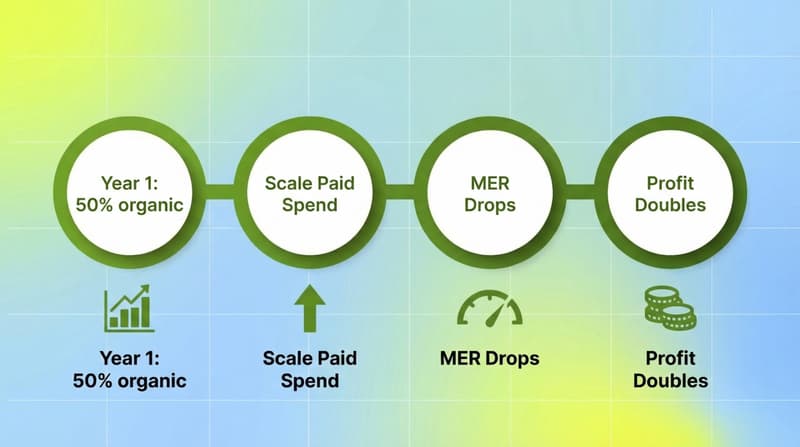
MER vs ROAS: They're Not Competing
The most common version of this debate goes: "ROAS is dead, use MER instead." Both camps are wrong.
As Nick Miller, a performance marketing practitioner at Tier 11, put it: "ROAS is a local metric. MER is a global metric."
ROAS works at the channel, campaign, and creative level. It tells you which ad sets to scale, which creative to cut, which audience to expand. But platform-reported ROAS is noisy -- it includes attribution credit that platforms claim on conversions driven by other touchpoints.
MER solves that. It doesn't touch attribution at all. It looks at the whole revenue picture and the whole spend picture. No attribution squabbles.
But MER can't tell you which channels or creatives are driving performance. According to HubSpot's analysis, "High ROAS with declining MER may indicate overspending on upper-funnel channels, while steady MER with falling ROAS may suggest organic channels are compensating for declining ad efficiency." You need both signals to understand what's happening.
The practical split:
What You Should Actually Optimize For
MER is a diagnostic, not a target. What you want to optimize is net contribution margin.
Net contribution dollars = Revenue - COGS - Ad Spend
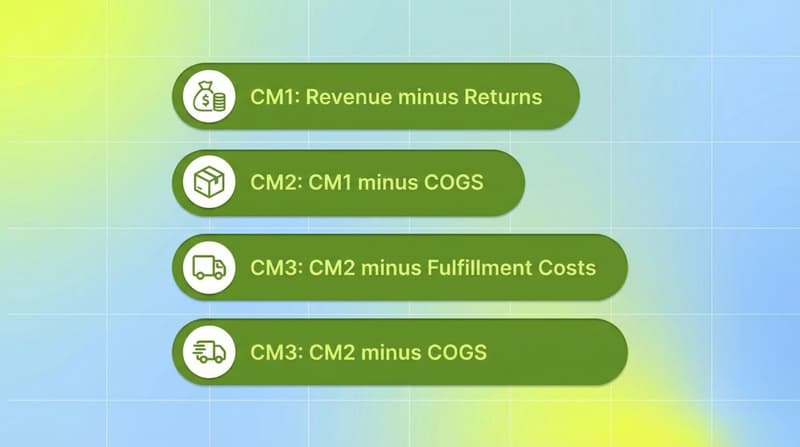
According to Saras Analytics, mature DTC brands track contribution margin at three layers:
CM1: Net sales minus returns and discounts
CM2: CM1 minus COGS
CM3: CM2 minus fulfillment, shipping, payment fees, and channel-specific costs
A campaign can hit a strong ROAS and still produce negative CM3 if fulfillment costs are high or return rates spike. That's a campaign you want to scale back regardless of what MER says.
The DTC CFO example above illustrates this perfectly: ROAS went from 2.5x to 3.7x, and net contribution dollars doubled, even as the MER ratio declined. The right call was to keep spending, not pull back to protect the ratio.
Midsummer Agency's analysis puts it plainly: "Revenue optimization creates the illusion of growth while masking fundamental financial weaknesses." Healthy DTC brands typically target contribution margin of 40-50% after marketing spend. If you're significantly below that threshold, scaling spend will amplify losses even if MER looks fine.
How to Use MER Correctly
Use MER as a guardrail, not a goal. Define a floor below which you won't operate. If your break-even MER (based on contribution margin) is 3.0, don't let it fall below 2.5 without investigation.
Tailored Edge Marketing recommends running MER weekly: "Daily MER is too noisy; monthly is too slow." Pair weekly MER with a trailing 4-8 week average to see trend and seasonality.
Define your inputs before you start tracking. The biggest source of confusion with MER is inconsistent definitions. Does your "total revenue" include returns? Is it gross or net? Does "total marketing spend" include agency fees, creative production, and tool costs, or just media spend? Decide once, document it, and never mix them. Tailored Edge Marketing distinguishes between MER-Media (just ad spend) and MER-Total (all marketing costs) for exactly this reason.
When benchmarking, be careful. Cision's analysis suggests a MER between 3-5 is generally considered strong for ecommerce, but this varies significantly by industry and margin profile. A high-margin software-adjacent DTC brand can operate at a higher MER than a low-margin consumables brand.
Finally, always track MER alongside your organic/paid revenue mix. If your organic percentage changes significantly quarter-over-quarter, your MER will shift regardless of paid performance. It's not a signal -- it's a ratio artifact.
Creative Quality Is the Hidden Lever Inside MER
MER measures the output. Creative quality determines whether your paid contribution to MER improves or erodes.
According to Meta's internal creative effectiveness research, cited by multiple independent analyses, creative quality accounts for 47% of ad performance variability. Advertisers running structured creative testing achieve 28% higher ROAS than those testing randomly.
Higher creative ROAS means each ad dollar contributes more revenue to your numerator. Better creative efficiency means you can scale spend without eroding MER -- which is exactly what the Year 2 scenario in the DTC CFO example showed.
The problem most teams run into: they're tracking ROAS at the campaign level but can't see which specific creative elements are driving performance. Research from Improvado shows that marketing teams without creative-level tracking waste 30-40% of ad spend on underperforming variants because they can't distinguish what's working inside a campaign.
This is where creative intelligence becomes directly relevant to MER. If you know which hooks, CTAs, visual styles, and formats drive the highest ROAS, you can allocate toward winning patterns and pull back from wasted spend -- improving your paid efficiency without reducing total volume.
Platforms like Segwise connect to 15+ ad networks (Meta, Google, TikTok, Snapchat, YouTube, AppLovin, Unity Ads, Mintegral, IronSource) and four MMPs (AppsFlyer, Adjust, Branch, Singular), automatically tagging creative elements using multimodal AI across video, audio, image, and text. Teams using Segwise save up to 20 hours per week on manual analysis and see up to 50% ROAS improvement by identifying winning creative patterns and catching fatigue before it tanks paid efficiency.
Better ROAS on your paid spend means better contribution to your MER -- without cutting the budget.
Conclusion
MER is a useful health metric for your marketing investment. It gives you a clean, attribution-free view of whether the total spend is generating sustainable revenue. But treating it as an optimization target leads to exactly the wrong decisions: cutting profitable spend to protect a ratio, missing the organic/paid mix shift, and ignoring the contribution margin picture underneath.
The right way to think about MER: use it as a compass, not a speedometer. Watch it weekly, understand what drives it, and pair it with contribution margin and channel-level ROAS to get the full picture.
If your paid efficiency is the variable you want to improve -- which is what actually moves MER in a healthy direction -- creative performance is where the work happens. If you want to understand which creative elements drive your best ROAS across every network and see that data without 20 hours of manual tagging, book a demo of Segwise to see what the platform surfaces in your actual ad accounts.
Frequently Asked Questions
What is a good MER for a DTC brand?
According to Triple Whale's 2025 benchmark data, the median MER (expressed as a cost ratio) for ecommerce brands is 41%, meaning $0.41 in marketing spend per dollar of revenue -- or roughly a 2.4x multiple. Shopify and industry benchmarks suggest targeting a MER multiple between 3-5 for established brands with healthy margins. Lower-margin businesses typically need stricter MER targets. The "right" MER depends entirely on your contribution margin, organic mix, and growth stage.
What's the difference between MER and ROAS?
MER measures total revenue against total marketing spend across all channels, including organic. ROAS measures revenue attributed to specific ad campaigns or channels against the spend in those channels. MER is a portfolio-level, strategic metric used for budget planning and business health. ROAS is a tactical metric used for campaign optimization and creative testing. Use ROAS to decide where to allocate spend; use MER to decide whether overall marketing investment is generating profitable growth.
Why does MER decline when I scale paid media?
When you increase paid spend, you're buying a larger share of revenue through paid channels. Your organic percentage shrinks as a proportion of total revenue. Since MER blends all revenue against all spend, paying for revenue that previously came for free dilutes the ratio. This is normal and expected when scaling. What matters is whether the incremental ROAS on that additional spend is profitable -- if it is, declining MER is fine.
What is marginal MER and why does it matter?
Marginal MER is incremental revenue divided by incremental spend for a specific budget change. It tells you whether adding the next dollar of marketing spend will generate profitable revenue, regardless of what the blended average MER shows. A brand with a 5.0 MER might have a marginal MER of 2.8 on new spend -- meaning the next incremental dollar is less efficient but still profitable. Track marginal MER before making scaling decisions.
Should I optimize for MER or contribution margin?
Contribution margin. MER is a useful indicator, but it doesn't account for COGS, fulfillment, returns, or shipping costs. A campaign can show strong ROAS and acceptable MER while still generating negative contribution margin after variable costs. Mature DTC operators track contribution margin at the CM1 (after returns), CM2 (after COGS), and CM3 (after all variable costs including marketing) levels. These layers tell you whether growth is actually profitable at the unit economics level.
How does creative quality affect MER?
Creative quality directly affects ROAS, which determines how much revenue each paid dollar generates. Better creative means higher ROAS, which means your paid spend contributes more to the revenue numerator in your MER calculation. Creative that drives fatigue -- where performance declines over weeks -- erodes ROAS and drags down paid efficiency, which pressures MER. Systematic creative testing and fatigue detection are therefore direct inputs to maintaining healthy MER over time.
What inputs should I include in the MER denominator?
This depends on what you're measuring. MER-Media includes only paid media spend. MER-Total includes paid media plus agency fees, creative production costs, tool costs, and other variable marketing expenses. Neither is more correct; both are useful. The important thing is consistency: define your inputs once, document them, and always use the same definition when comparing across time periods or against benchmarks.
