Marketing Analytics Tools 2026: Best Picks to Boost Campaign Insights
Choosing the right marketing analytics tools feels overwhelming when you already have ad spend on the line. You run many creatives, tests, and campaigns, but the numbers from different sources don’t add up, and only a small share of teams say they trust their attribution data.
Many vendors now add AI and automation to spot trends and issues faster, but the tools differ widely in what they measure and how quickly they respond. You need clear signals about which creative or placement drives value, backed by a single system that joins ad and event data, surfaces creative-level insights, flags early performance drops, and delivers useful reports without long setup or hidden charges.
In this blog, we'll walk through what these tools do, review the top options for 2025, break down how each one helps with creative and campaign insight, and close with a clear checklist you can use to run a quick pilot and decide which platform gives you the strongest, most reliable view of your performance.
What Are Marketing Analytics Tools?
Think of these tools as software that collects data from your ads, landing pages, app, and other places where people meet your brand. They pull that raw data together, clean it, and show it as simple charts and reports you can act on. Some tools are built for big-picture dashboards and data warehouses, while others focus on event-level behavior inside apps or on specific channels.
Leading examples you'll see in 2025 include platform analytics, product-event analytics, and reporting/ETL systems that connect many ad and analytics sources into a single view. Each type solves a different problem, from tracking installs and in-app events to combining ad spend and conversions into a single report.
Now that you know what these tools are, let's look at why they matter for the choices you make every day.
Why They Matter?
The goal is to stop guessing which creative, channel, or audience actually moves your numbers. These tools help you test ideas, understand which tactics work, and catch issues early, like drop-offs in a funnel or ad placements that drain budget. When your data connects end to end, choices lean on facts rather than gut instinct.
Only 18% of marketers feel very confident in their attribution data, according to a 2025 survey by Branch, meaning most teams aren’t sure their measurement truly reflects channel and creative impact.
By 2025, many platforms began using AI to surface patterns automatically, and industry changes, such as mergers and new partnerships, reshaped how identity and audience data link across systems. These shifts influence how you read campaign impact and assign credit.
Key Benefits of Using Marketing Analytics Tools
Once you know why they matter, here’s how these tools make a real difference in daily results:
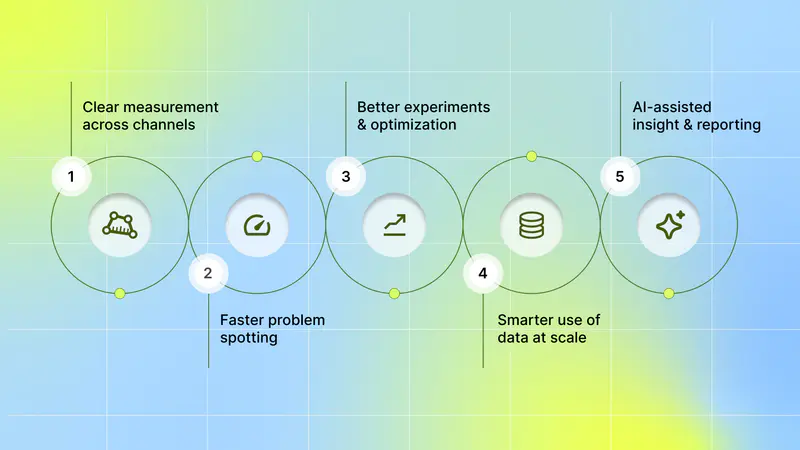
Clear measurement across channels: You can compare ad platforms, organic channels, and product behavior in one place, so you know which touchpoints drive real value.
Faster problem spotting: Dashboards and automated alerts show where performance drops, so you can quickly fix creative, targeting, or onboarding friction.
Better experiments and optimization: Event-level and cohort analysis make A/B testing and creative iterations more precise, so you learn what to scale and what to cut.
Smarter use of data at scale: For larger datasets, you can run SQL or use a warehouse-backed tool to answer complex questions (for example, lifetime value by channel) without manual spreadsheets.
AI-assisted insight and reporting: Newer tools suggest trends, anomalies, and next steps so you spend less time pulling reports and more time acting on findings.
When these benefits combine, your campaigns no longer run on guesswork. You see performance clearly, make smarter creative choices, and adapt confidently without spreadsheets or late-night reporting chaos.
Once you know the value they bring, the next question is which platforms stand out and best fit different marketing needs.
Also Read: How AI Is Revolutionizing Mobile User Acquisition in 2025
List of Top 5 Marketing Analytics Tools in 2025
When you're managing ad campaigns and tracking creative performance across multiple channels, having the right analytics platform makes all the difference. Here are five platforms that can help you turn raw marketing data into insights that actually improve your return on ad spend.
1. Segwise

Segwise is an AI-first creative analytics platform designed specifically for mobile games, subscription apps, and DTC (direct-to-consumer) brands. Built to solve the unique challenges of modern user acquisition, this platform helps you understand which creative elements drive performance without spending hours manually tagging and analyzing assets across various networks. If you're running hundreds of creatives across Meta, TikTok, Google, or other ad networks, Segwise brings it all into a single unified dashboard.
It supports custom tagging and label management, performance-based AI creative generation (auto-creating new ad variations from your winning elements), and competitor creative tracking (monitoring competitor creatives from Facebook, Google, and TikTok ad libraries). These capabilities work alongside automated tagging and cross-network metrics so you can compare your creatives, newly generated variants, and competitor ads in one place.
Key Features:
AI-powered Creative Tagging: The platform uses multimodal AI to automatically identify and tag creative elements like hook scenes, first dialogues, headlines, characters, influencer traits, CTA text, CTA dialogue, and audio cues. This works across static images, videos, and even playable ads, saving you from tedious manual work.
Custom tagging & label management: define and apply your own tags and hierarchies to match internal taxonomies and workflows.
AI creative generation: auto-generate creative variations using your actual winning creative elements, enable rapid production, and remix high-performing elements into new ads.
Cross-network ingestion, tagging & metric mapping: brings creative data in from ad networks and data sources, tags each creative, then maps those tags to campaign metrics (ROAS, CPA, IPM, LTV) and attribution data, including MMPs and custom data sources. Segwise supports integrations across 15+ networks and data sources.
Creative fatigue detection & alerting: automated monitoring that flags creative fatigue (declining creative performance) so teams can refresh assets proactively.
Competitor creative tracking & gap analysis: monitor competitor creatives, run tag-count reports to identify creative gaps, and spot emerging trends to inform your next tests.
Automatic performance tracking for generated creatives: every AI-generated creative is tagged and tracked to measure success across campaigns and networks.
Best For:
Mobile app marketers, user-acquisition teams, and performance creative teams are running large creative funnels across multiple ad networks and formats. It’s especially effective for teams that need detailed tag-level insight into ROAS, CPA, IPM, and LTV, along with automated tagging, AI-driven creative generation, and competitor benchmarking in a single workflow.
Pros:
Rapid, automated insight into which parts of creatives drive conversions.
Reduces manual tagging work and accelerates creative production and refresh cycles.
Unified, cross-network view that links creative tags to attribution and business metrics.
Cons:
The tool is most valuable when it can see many creative impressions across channels; if you run very small, narrow tests, it may be hard to get statistically useful element-level signals quickly.
For very high creative volumes or demanding throughput/SLA requirements, review ingestion limits and reporting cadence with Segwise in advance to ensure the platform capacity aligns with your workflow and campaign scale.
Pricing:
Segwise commonly offers a free trial option and then custom subscription tiers quoted after a demo, expect quote-based pricing rather than a one-page list price.
2. Google Analytics 4 (GA4)

GA4 collects event-level data from web and apps and emphasizes user journeys and machine-learned signals (predictive metrics, modeled conversions). It’s widely used because it integrates seamlessly with the ad ecosystem and is free for many use cases.
Key Features:
Event-based measurement: You define events that describe actions users take; those events power funnels and user journeys across devices. This gives you consistent behavioral tracking out of the box.
Predictive metrics & modeling: Built-in machine learning surfaces probabilities (e.g., purchase likelihood) and fills gaps when raw data is limited due to privacy constraints.
Tight ad-platform links: Native integrations with Google Ads reduce setup work for campaign-to-conversion reporting.
Best For:
Teams that need broad web-and-app event tracking with strong Google Ads links and built-in predictive signals; ideal when you want general analytics and ad-platform measurement, not creative-asset analysis.
Pros:
Powerful free tier and broad adoption make it easy to share insights across partners.
Native Google Ads connectivity streamlines campaign measurement.
Cons:
Not focused on creative element analysis: GA4 captures events and audiences, but it won’t automatically read or tag creative elements inside ad assets. If you need element-level creative signals, GA4 alone won’t deliver them.
Complexity and learning curve: New GA4 paradigms (event-first, explorations) require time to master; that slows quick tactical answers if you’re used to point-and-click creative diagnostics.
Enterprise features behind the paid tier: For unsampled, high-volume enterprise needs, you’ll likely need Analytics 360 (quote-based), which substantially raises costs.
Pricing:
GA4 Standard: Free with core event tracking, 14-month data retention, and integration with Google's ecosystem.
GA4 360: Starts at $50,000 per year (based on 2025 pricing). Includes unsampled reports, 50 million events per day, extended data retention (50 months), SLA-backed support, and advanced BigQuery integration.
3. Improvado

Improvado is a marketing data pipeline and intelligence layer that pulls data from multiple marketing sources into a single place, normalizes metrics, and delivers analysis-ready data and dashboards. Its strength is centralizing disparate ad and internal systems into a single, clean dataset for reporting.
Key Features:
Hundreds of connectors: Pulls data from dozens to hundreds of ad networks, analytics tools, and CRMs, so you don’t build dozens of custom pipelines.
Data harmonization/ETL: Normalizes naming, currency, and metric inconsistencies to ensure a single dashboard displays consistent KPIs across channels.
Pre-built dashboards & AI agents: Ready-made reporting and automated insight engines reduce manual spreadsheet work for cross-channel analysis.
Best For:
Organizations that need a single, clean marketing and CRM dataset for BI and cross-channel reporting; best when unified data pipelines matter more than creative-element analysis.
Pros:
Cuts engineering time to centralize and prepare marketing data for reporting.
Scales across multiple brands and geographies with governance features.
Cons:
Not a creative-analytics solution: Improvado centralizes and cleans data, but does not automatically extract or evaluate creative elements the way a dedicated creative analytics product does. If your priority is understanding which part of an ad drove performance, you’ll still need a separate creative analysis layer.
Custom onboarding and cost: Pricing is quote-based, and implementation typically needs professional services. This can be slow and costly for quick, tactical creative experiments.
Pricing:
Custom, demo-based pricing. Plans are quoted based on data volume, integrations, and service needs.
4. Tableau

Tableau is a visual analytics platform marketers use to turn campaign and channel data into interactive dashboards, forecasts, and shareable KPI views, powered by AI (Tableau Pulse), to surface trends and help CMOs and marketing leaders act on KPIs.
Key Features:
Tableau Pulse: AI-powered insight summaries and natural-language queries to find signals in marketing metrics.
Marketing dashboards and templates: leadership KPI dashboards, campaign activity calendars, blog, and campaign performance dashboards you can deploy and explore.
Connects many data sources: built to combine campaign, CRM, ad, web, and third-party data (Tableau Prep helps prepare large multi-source datasets).
Plug-and-play accelerators: ready-made, industry and use-case-specific dashboards that jumpstart analysis and save setup time.
Forecasting and alerts: visual analytics for trend forecasting and the ability to share insights and set data-driven alerts across teams.
Best For
Marketing leaders, analytics teams, and agencies that need cross-channel reporting, exploratory visual analysis, and shareable dashboards to align teams and measure campaign performance.
Pros:
Combines multiple sources into a single view, reducing manual data stitching.
Strong visual analytics and ready-to-use dashboard accelerators for faster time-to-insight.
Cons:
Getting the best results usually involves data prep and integration work (Tableau Prep or connectors), which adds to the setup effort in complex environments.
Not an ad-creative asset manager; it surfaces performance and behavior metrics but doesn’t replace specialized creative-analysis tools.
Pricing:
Tableau offers a free trial and multiple product editions (Tableau Cloud, Server, Desktop) with licensing-based pricing; enterprise options and purchasing details are available on the Tableau buy/pricing pages.
5. Heap

Heap captures every user interaction automatically (clicks, taps, pageviews) so you can ask new questions retroactively without shipping new events. That makes it easy to test hypotheses without having to pre-plan every metric you might need.
Key Features:
Autocapture: One snippet records interactions so you can define events later and run analyses on historical data. This saves engineering time when you want to explore unexpected signals.
Retroactive queries & session replay: Run queries on past data and replay sessions to understand user behavior without missing previously untracked actions.
AI assistant & charts: Built-in helpers speed simple analyses and chart creation when you need quick answers.
Best For:
Teams that want automatic capture of all interactions and the flexibility to ask new questions later; suited for exploratory behavioral analytics, not creative-asset tagging.
Pros:
Reduces friction to answer new questions because events are captured automatically.
Useful session-level context and retroactive analysis shorten the learning cycle.
Cons:
Potential data bloat and cost at scale: Capturing everything can balloon data volume and retention costs; higher retention or heavy session volumes usually require higher-priced plans. That can make long-term costs less predictable.
Not a creative element reader by default: It records interactions but can’t extract attributes from ad assets without an external tagging process.
Pricing:
Heap offers a free tier (with limits). Growth/Pro/Premier plans are custom-priced; example market reports show mid-five-figure annual costs for high session volumes. Contact Heap for a tailored quote.
Each tool has a specific purpose, ranging from data gathering to tracking behavior and performance. The best choice depends on your focus: understanding user actions, campaign results, or creative effects.
Seeing what each product offers is only half the task; the next piece is figuring out which one fits your goals, team structure, and data setup.
Also Read: Top Creative Analytics Tools for Successful Ad Campaigns 2025
How to Choose The Right Marketing Analytics Tool

You’ve just read what these tools do and why they matter. Now use this short, practical checklist to compare platforms and pick one that helps you move faster, cut wasted spend, and understand which creative and channel choices actually create value.
1. Scalability
Pick a platform that handles growing event volume, traffic spikes, and near-real-time needs. Cloud-native systems and streaming pipelines let you see early signals and act before problems compound.
Quick checks:
Does the vendor support streaming or near-real-time ingestion?
Can it scale automatically during traffic spikes?
Can you access raw event exports when you need deeper analysis?
Why this matters:
If reporting slows or samples data when volume rises, you miss early campaign signals and creative fatigue. Modern cloud-native analytics are built to avoid those bottlenecks.
2. Integrations
You want a single, trusted view of ad spend, installs, in-app events, and revenue. Native connectors, reliable APIs, and out-of-the-box links to major ad networks and attribution partners make that possible.
Quick checks:
Are your ad platforms and attribution providers supported out of the box?
Can the tool ingest first-party events from your app and server-side sources?
Are connectors maintained and updated by the vendor?
Why this matters:
When data lives in separate silos, numbers won’t match, and decisions will be mixed up. Strong, maintained integrations keep campaign, product, and revenue data aligned.
3. Customizability
You should be able to define the KPIs and attribution windows that match how you test and scale. Look for custom metric builders, flexible attribution settings, and editable dashboards.
Quick checks:
Can you change attribution windows and compare multiple models?
Is there a formula builder for custom metrics (for example, adjusted ROAS)?
Are dashboards easy to edit and share across teams?
Why this matters:
Off-the-shelf reports rarely match your experiments. Custom options let you measure the right things and avoid misleading defaults.
4. Ease of Use
You need clear dashboards and fast, guided workflows that let people act on insights without a long training period. Yet the tool should reveal more depth when you need it.
Quick checks:
Can someone on your team build a useful report in minutes?
Does the product offer templates for everyday campaign tasks?
Is there a demo or sandbox to test features safely?
Why this matters:
If the tool remains unused because it’s difficult to learn, its value is lost. A user-friendly product puts insights into the right hands where they can influence campaigns.
5. Implementation and Onboarding
Look at the tracking plan, SDK or server event setup, and the vendor’s onboarding package. Good vendors supply clear install guides, health checks, and help with moving historical data.
Quick checks:
Is a tracking plan provided, and is it easy to follow?
Does the vendor offer onboarding support or professional services?
How long until you have a working dashboard after install?
Why this matters:
Bad implementation produces bad data. A focused onboarding process shortens the path to trustworthy insights.
6. Cost
Compare total cost, not just sticker price. Watch for event or query fees, connector charges, storage and retention costs, and any professional services needed for setup.
Quick checks:
Is pricing based on events, seats, or queries?
Are exports, connectors, or high-volume usage charged extra?
Can the vendor estimate the expected payback from faster decisions?
Why this matters:
Transparent pricing helps you weigh cost against value. A cheaper tool that delays decisions or hides fees can end up costing more in wasted ad spend.
7. Security Safeguards
You’ll work with user signals and revenue data. Check for encryption, access controls, audit logs, and certifications. Also, ask about data residency and how the vendor supports privacy-safe measurement.
Quick checks:
Does the vendor hold SOC 2 or comparable attestations?
Is data encrypted in transit and at rest?
Can you restrict access by role and review audit logs?
Why this matters:
Security and privacy affect what measurement methods you can use and whether you can run specific tests. Pick a tool that treats data protection as standard practice.
8. Support Availability
Fast, knowledgeable help matters when tracking breaks or numbers don’t line up. Look for clear response SLAs, good documentation, and a path to escalate issues.
Quick checks:
What are support hours and response SLAs?
Is a dedicated onboarding or success contact available?
Are there health checks, alerts, and developer support for SDK issues?
Why this matters:
Quick support saves budget when campaigns are at risk. The right vendor mixes helpful docs with human backup.
Score each vendor on these eight areas during demos and pilots. Run a short pilot focused on a single campaign or creative test and check whether insights are accurate, timely, and easy to act on.
Also Read: How to Combat Creative Fatigue with AI Solutions
Conclusion
Choose platforms that make it quick and obvious which creatives, audiences, and channels actually move your key metrics. Prioritize tools that automatically tag creative elements, join creative signals with campaign KPIs across ad accounts and MMPs, and warn you early when a creative is losing effectiveness so your team can run cleaner experiments and protect ROAS without extra engineering work.
For teams focused on creative-to-performance answers, Segwise is a practical fit: its multimodal AI auto-tags images, video, audio, and playable ads and maps those tags to metrics across major ad networks.It also includes fatigue tracking and cross-network monitoring to surface declines before they hit efficiency.
Start a free trial with Segwise and see how its AI-driven creative analytics turn your ad data into clear, actionable insights that help you make smarter campaign decisions.
FAQ's
1. What should I look for in marketing analytics tools?
Look for cross-channel data stitching, creative-level tagging or support for it, real-time alerts, flexible attribution options, and easy exports or SQL access so analysts can dig deeper.
2. How do I choose between a creative analytics platform and a data pipeline/warehouse?
Pick a creative analytics platform when you need element-level answers (which image, hook, or sound works); choose a pipeline/warehouse when you need unified, BI-ready datasets. Many teams run both together.
3. Can Google Analytics 4 replace other marketing analytics tools?
GA4 is useful for event-level journeys and predictive signals. Still, it won’t auto-tag creative elements or centralize all ad connectors. Pair GA4 with a creative or ETL tool for full coverage.
4. What pricing models do marketing analytics tools use, and what extra costs should I watch for?
Expect event- or query-based pricing, seat or feature tiers, and quote-based enterprise plans; also watch connector fees, data retention/storage, exports, and onboarding or implementation charges.
5. How quickly will a marketing analytics tool improve campaign insights?
You can get basic dashboards and quick alerts in days, while accurate cross-channel attribution, LTV calculations, and deep cohort analysis usually take several weeks of setup and clean data.
