What Is Creative Analytics? A Complete Guide for 2026
Key Takeaways
Guesswork Kills: If you can't explain why a concept worked, you can't repeat it. Creative analytics replaces opinions with performance-backed clarity so your strategy becomes predictable, not accidental.
Elements Matter: Winning ads are built from winning hooks, formats, and story structures. Creative analytics helps you identify which specific elements drive engagement, conversions, and long-term value.
Patterns Scale: Instead of chasing one-off hits, you build repeatable creative frameworks. Data reveals which combinations consistently outperform, so you scale structures, not random ideas.
Engagement Signals: Metrics like Thumbstop Ratio, CTR, Video Play Rate, and Engagement Rate show where your creative breaks or wins. They help you refine hooks and storytelling before performance drops.
System Over Ads: The real goal isn't better reporting, it's a repeatable creative engine. When you unify data, map elements to results, and iterate strategically, you build a scalable system that drives consistent growth.
Updated July 2026.
Creative analytics is the structured practice of collecting and analyzing data on individual ad creative elements (hooks, visuals, dialog, CTAs, and offers) to identify which specific elements drive performance, so you can build repeatable winners instead of one-off hits. In 2026, creative quality is one of the single biggest drivers of ad effectiveness, and creative analytics is how leading teams measure it and act on it.
Do your creatives rely more on guesswork than data?
As a creative strategist, you launch new concepts every week, test multiple hooks, tweak visuals, and swap CTAs, yet performance still feels unpredictable. CPAs creep up. Winning ads burn out fast. And when someone asks why a concept worked, you don't have a clear answer.
You're not alone. A recent MAGNA Media study found that creative quality accounts for up to 56% of a campaign's impact on purchase intent, making it one of the single biggest drivers of advertising effectiveness. Yet many teams still lack a structured way to measure which creative elements actually drive that impact.
This blog covers what creative analytics really means, how it connects creative decisions to revenue outcomes, and how you can use it to build a data-driven creative strategy that produces repeatable winners instead of one-off hits.
What is Creative Analytics?
Creative analytics is the structured process of collecting and analyzing data related to your ad creatives and marketing assets. Its goal is to identify patterns and understand how specific creative elements like hooks, visuals, dialogs, and offers influence your audience. Instead of only tracking overall campaign performance, you study how each creative decision impacts results.
In the past, you probably reviewed performance in spreadsheets or jumped between ad platforms trying to compare creatives manually. You copied links from Meta Ads, checked performance in TikTok, then matched it with attribution data in your MMP or CDP. It was slow, messy, and hard to see clear patterns.
Today, creative analytics tools make it easier to analyze creative elements at scale and understand which concepts actually drive better results without relying on guesswork or endless pivot tables. As a creative strategist, this helps you build stronger concepts, refine your briefs, and create campaigns that scale predictably instead of accidentally.
Next, it's important to understand the real advantages creative analytics brings to your creative process.
Also read: Understanding the Future and Basics of Creative Analytics in Gaming Apps
5 Benefits of Using Creative Analytics
Creative analytics helps you understand why your concepts perform and how to improve them consistently. It turns creative guesswork into a structured system for building stronger, repeatable campaigns.
Here are five key benefits:
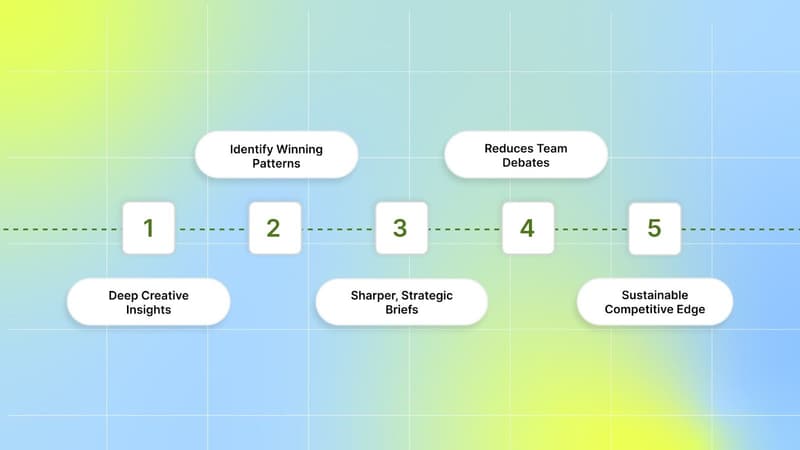
1. Unveils Deep Creative Insights
Creative analytics shows you how your audience reacts to specific elements inside your creatives, not just the ad as a whole. You can see which hooks grab attention, which storylines hold interest, and which emotional tones drive action.
For DTC brands, it could reveal which product angle drives purchases. These insights help you create concepts based on real audience behavior.
But how do you know exactly which hook, dialog, or visual element is driving performance across all your campaigns? This is where Segwise comes in.
With tag-level creative element mapping, you can see which specific creative elements drive performance. Also, you can discover patterns like "this hook appears in 80% of top-performing creatives" with complete MMP attribution integration.
2. Helps You Identify Repeatable Winning Patterns
Instead of celebrating one winning ad, you start identifying winning structures. You see patterns like "testimonial + demo" outperforming "lifestyle + emotional hook" or problem-first openings, driving stronger conversions.
This allows you to build creative frameworks that can be reused and refined. You stop chasing random hits and start designing concepts with intention.
3. Makes Your Creative Briefs Sharper and More Strategic
Without data, briefs often sound like opinions. Creative analytics gives you clarity. You can brief your team with confidence, keeping the hook style, or adjust the CTA.
Your iterations become structured, faster, and more focused. That improves creative quality and reduces wasted production time.
4. Reduces Subjective Debates Between Teams
Creative reviews can become emotional when performance drops. Creative analytics brings objectivity into the room. Instead of debating, you discuss performance patterns.
You can clearly show which concept structure lowered CPA or which angle sustained performance longer. This aligns creative and performance teams around data, not opinions.
5. Gives You a Sustainable Competitive Edge
In competitive spaces like mobile gaming and DTC e-commerce, small creative advantages can make a big difference. Creative analytics helps you identify gaps in your own strategy and uncover opportunities competitors may be missing.
When you combine data-backed insights with strong creative thinking, you build campaigns that stand out and perform consistently. Over time, this strengthens brand loyalty, improves retention, and helps you maintain a clear edge in crowded markets.
Knowing the benefits is important, but the real advantage comes from applying creative analytics in a structured way.
Also Read: 5 Best Advertising Analytics Tools for 2025
How to Use Creative Analytics to Build a Winning Creative Strategy
How you use creative analytics will vary depending on your app, product, or client portfolio. However, there are certain foundational steps you can follow to build a stronger, data-driven creative strategy.
Here are the key steps to help you turn creative data into repeatable, scalable results:
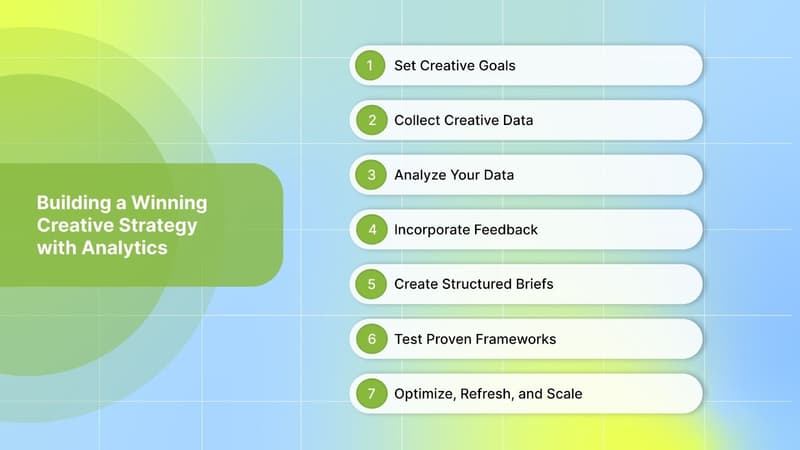
Step 1: Set Your Creative Goals
What do you want your creatives to achieve?
Before diving into performance data, define clear SMART goals specific, measurable, attainable, relevant, and time-bound. As a creative strategist, this could mean improving conversion rates, lowering CPA, and increasing engagement.
Clear goals give you direction. They help you evaluate whether your creative concepts are truly working and guide your hypothesis about which hooks, formats, or messaging angles to test next.
Step 2: Collect Creative Data
Next, gather performance data across all your paid channels.
Look at campaign data from Meta Ads, TikTok, Google, and other ad platforms. Also, analyze competitor creatives. Study what angles, visuals, and offers competitors are scaling. Identify gaps in their messaging and opportunities for differentiation.
Centralizing this data allows you to compare creatives across channels without relying on manual spreadsheets.
But how do you bring all this scattered data into one clear view without spending hours exporting reports and building pivot tables? This is where Segwise comes in.
Segwise unifies your cross-network creative performance data into a single dashboard. This means you don't need to jump between Facebook Ads Manager, Google Ads, TikTok, and your MMP dashboard. Also, you can see creative-level ROAS, CPA, LTV, and conversion rates across all sources in a single unified view.
Step 3: Analyze Your Data
Now ask yourself: what is the data actually telling you?
Go beyond top-level results. Look for patterns across creative elements and concepts. Did testimonial-style creatives outperform lifestyle ads? Did problem-first hooks drive stronger conversion rates? Did gameplay demos bring higher-quality installs?
Focus on meaningful metrics such as CTR, CPA, ROAS, LTV, and creative lifespan. Your goal is to understand why certain concepts worked, not just which ad performed best.
This is where insight begins to shape strategy.
Step 4: Brainstorm and Incorporate Feedback
Use your insights to refine your creative direction.
If urgency-based hooks performed well, explore new variations within that structure. If emotional storytelling drove stronger engagement, build more concepts around that angle. If certain formats fatigued quickly, rethink how you refresh them.
Share insights with your team. Creative analytics works best when insights are collaborative. When everyone understands what is working and why, your creative strategy becomes aligned and stronger.
Step 5: Turn Insights Into a Structured Creative Brief
Document your ideas clearly.
Outline the core concept, hook structure, key message, visual direction, and CTA. You can structure your brief like a storyboard so everyone understands how the creative flows from the first second to the final frame.
Because your brief is built on performance-backed insights, your team works with clarity instead of assumptions. This improves efficiency and creative quality.
Step 6: Test Within Proven Frameworks
Launch creative variations across your channels and monitor performance closely. Test new versions within structures that already show promise. Compare hooks, formats, emotional tones, and messaging angles across platforms like Meta and TikTok.
Use testing approaches that match your goals, whether that's value optimization, IPM-based testing for games, or structured concept testing for DTC campaigns. Testing should not feel random. It should feel like controlled experimentation inside proven frameworks.
Step 7: Optimize, Refresh, and Scale
Creative optimization is continuous. Monitor how long your concepts sustain performance. Identify when certain hooks or formats begin to fatigue. Refresh elements strategically instead of rebuilding entire campaigns from scratch.
Over time, build a library of winning creative patterns. Reuse, adapt, and evolve them across campaigns and channels. This transforms creative analytics from a reporting tool into a long-term growth engine.
When you follow this process consistently, you don't just launch ads. You build a system that produces scalable, repeatable creative wins.
To make this strategy truly effective, you need to measure the signals that reveal how your creative is actually performing
Which KPIs Should You Measure?
If you want to improve your creative strategy, you need KPIs that show how people engage with your ads, not just whether they convert. As a creative strategist, engagement metrics help you understand whether your hook, storytelling, and visuals are doing their job.
Here are the key engagement KPIs you should track:
Thumbstop Ratio: This shows whether your hook is strong enough to stop people from scrolling. If this number is low, your opening 2-3 seconds need improvement.
CTR (Click-Through Rate): This tells you whether your creative generates curiosity or intent. If people see your ad but don't click, your message or value proposition may not be compelling enough.
Video Play Rate: This shows how much of your video people are actually watching. If viewers drop off early, your pacing, storytelling, or structure may need refinement.
Average Watch Time: This helps you understand whether your content holds attention. If engagement drops mid-video, your concept might be too slow or unclear.
Engagement Rate: Engagement rate measures how actively people interact with your ad through likes, comments, shares, saves, or other platform interactions. It shows whether your creative resonates enough to spark a reaction, not just a passive view.
These KPIs help you answer important creative questions:
Is your hook strong enough to stop the scroll?
Are people interested enough to click?
Are viewers watching most of your video, or are they dropping off early?
Is your message resonating enough to engage people?
When you monitor these KPIs closely, you can fix weak hooks, adjust pacing, improve storytelling, and strengthen your creative strategy before performance drops at the conversion stage.
Even when you know which KPIs to track, putting creative analytics into practice comes with its own challenges.
Also Read: Understanding the Difference between ROAS and ROI in Marketing
3 Common Challenges in Creative Analytics
Creative analytics helps you build stronger concepts, but implementing it is not always easy. As a creative strategist, you often face operational and team challenges that slow down insight and iteration.
Here are three common challenges you are likely to encounter:
1. Reporting Becomes a Time-Consuming Process
Creative reporting can quickly turn into a monthly headache. Depending on your workflow, you may spend hours or even days pulling data from various ad platforms, organizing spreadsheets, and comparing creatives across channels.
If your data lives separately in Meta Ads, TikTok, Google, and your attribution source, consolidation becomes manual and repetitive. Instead of focusing on improving hooks or refining concepts, you're stuck copying links and building pivot tables.
For mobile games, DTC brands, and agencies running multiple campaigns, this slows down creative iteration. Time spent reporting is time not spent building better creatives.
2. Creative and Performance Teams Struggle to Align
Creative analytics is not just a numbers exercise. It requires collaboration between creative strategists, media buyers, and analysts.
The challenge? Creative teams think in concepts and storytelling. Performance teams think in metrics and optimization. When insights are buried inside complex spreadsheets, creatives may struggle to extract meaningful direction.
If reports are cluttered or overly technical, it becomes difficult to turn performance data into creative action. Clear, visual, and structured reporting is essential to help everyone understand what's working, regardless of their comfort level with data.
3. Too Much Data, Not Enough Actionable Insight
Storing data is easy. Turning it into insight is hard.
Spreadsheets and dashboards can show impressions, CTR, or ROAS, but they don't automatically tell you why a concept worked. You may spend hours scanning numbers without uncovering patterns in hooks, formats, or storytelling angles.
For creative strategists in mobile games, DTC brands, and subscription apps, the real challenge is moving from raw data to clear creative direction. Without structured analysis, you risk analysis paralysis, looking at data without knowing what to change next.
When these challenges are not addressed, creative analytics becomes overwhelming instead of empowering. But once you streamline reporting, align teams, and focus on actionable insights, it becomes a powerful driver of winning creative strategy.
These challenges don't mean creative analytics isn't valuable; they simply mean you need the right system to make it work effectively.
How Segwise Can Help Your Team Overcome Creative Analytics Challenges
Segwise is a fully agentic AI creative intelligence platform that helps you analyze, organize, and optimize your ad creatives using performance data. It unifies creative data from 15+ ad networks and 4 MMPs (AppsFlyer, Adjust, Branch, and Singular), automatically tags every creative element with multimodal AI, and connects those elements directly to business outcomes, so you can build stronger concepts, reduce guesswork, and scale what actually works. Segwise is also the only platform that tags playable (interactive) ads, which matters for mobile gaming advertisers.
Here are the key creative analytics features that help your team overcome common challenges:
1. Unified Creative Analytics Dashboard
Instead of jumping between Meta Ads, TikTok, Google, and your attribution platform, you get one unified view of your creative performance.
As a creative strategist, this means you can quickly see which concepts, formats, and angles are driving results across channels. No more manual data consolidation or endless spreadsheet reporting.
2. Tag-Level Creative Element Mapping
You can connect individual creative elements directly to performance metrics. You can instantly see which creative elements, themes, and formats drive results across all your campaigns and apps.
This helps you understand which hook structures drive results, which product angles convert for DTC brands, or which messaging attracts high-quality subscribers. Instead of blindly scaling ads, you scale winning structures.
3. Custom Dashboards and Reporting
You can build dashboards around your specific KPIs and stakeholder needs. Also, create automated reports that show how creative decisions impact ROAS across all your apps and campaigns.
Clear visual reports help everyone understand performance insights without getting lost in complex spreadsheets. This reduces cross-team friction and aligns creative and performance around shared data.
4. Native Fatigue Detection
Segwise monitors every creative across networks for continuous performance decline and spend-share drop, then alerts you before performance crashes rather than after. You catch fatigue early and refresh winning structures before budget is wasted.
By identifying winning patterns and catching fatigue early, teams save up to 20 hours per week per app or brand on manual tagging, consolidation, and reporting, and drive up to 50% ROAS improvement.
With Segwise, creative analytics becomes structured, actionable, and collaborative. Instead of spending time gathering data, you spend time building better concepts and scaling winning creative strategies with confidence.
Frequently Asked Questions
What is creative analytics?
Creative analytics is the structured practice of collecting and analyzing data on individual ad creative elements, such as hooks, visuals, dialog, CTAs, and offers, to identify which specific elements drive performance. Instead of only tracking overall campaign metrics, it connects each creative decision to outcomes like CTR, CPA, ROAS, and LTV so you can build repeatable winners.
How does creative analytics differ from traditional ad reporting?
Traditional ad reporting tells you how a campaign or an ad performed as a whole. Creative analytics goes a level deeper and tells you why, by mapping specific creative elements (a hook style, a CTA, a visual angle) to performance so you know which parts to keep, change, or scale.
Why does creative quality matter so much?
A MAGNA Media study found that creative quality accounts for up to 56% of a campaign's impact on purchase intent, making it one of the single biggest levers you control in paid media. Creative analytics is how you measure that lever and act on it.
Which KPIs should you track in creative analytics?
Track engagement signals that reveal how people interact with the creative itself: Thumbstop Ratio, CTR, Video Play Rate, Average Watch Time, and Engagement Rate. Pair these with outcome metrics like CPA, ROAS, and LTV to understand both why a concept engaged people and whether it converted.
Is creative analytics only for large brands, or can smaller teams benefit too?
Smaller teams benefit just as much. The value comes from replacing manual spreadsheet work with a structured system, which is often where lean teams lose the most time. No-code creative analytics tools let a single strategist analyze creative elements at scale without an analyst or engineering support.
How does Segwise help with creative analytics?
Segwise unifies creative data from 15+ ad networks and 4 MMPs (AppsFlyer, Adjust, Branch, and Singular), automatically tags every creative element with multimodal AI, maps those tags to performance metrics, and flags fatigue natively before performance drops. It is also the only platform that tags playable ads. Teams save up to 20 hours per week per app or brand and drive up to 50% ROAS improvement.
Conclusion
Creative analytics helps you move from guessing to knowing. Instead of launching creatives and hoping they perform, you analyze what truly drives engagement, conversions, and long-term value. You learn how to spot winning patterns, refine your briefs, track the right KPIs, and build a system that produces repeatable results.
But how do you unify creative data across platforms, connect specific elements to ROAS, and uncover winning patterns without spending hours in spreadsheets? That's where Segwise comes in.
Segwise's Creative Analytics platform brings all your cross-network performance data into one unified view. This means you don't need to jump between Facebook Ads Manager, Google Ads, TikTok, and your MMP dashboard. With tag-level creative element mapping, you can see which specific creative elements drive performance.
Also, you can build custom dashboards around your specific KPIs and stakeholder needs. And create automated reports that show how creative decisions impact ROAS across all your apps and campaigns. This means you focus on building and scaling better creatives instead of juggling reports.
So, are you ready to turn your creative data into a winning strategy? Start your free trial today and see which creative elements are truly driving your growth.
Segwise offers a 7-day free trial (with up to 14 days of historical data imported automatically, and up to 3 months for paid customers), and no-code setup connects your ad networks and MMPs in minutes.
Comments
Your comment has been submitted