5 Best Advertising Analytics Tools for 2026
You test new ads and try to grow installs every week, but the data you rely on is often slow, split across platforms, or unclear. This makes it hard to see which creative actually brings real users, and recent privacy updates have made tracking even harder.
Advertising analytics tools bring ad stats, cost data, and in-app events into one place, showing clear metrics like cost per install and return on ad spend. This reduces time spent fixing reports and gives you one clear source to work from.
A 2025 Nielsen report noted that only 32% of marketers track their media spend across both digital and offline channels, leaving many teams still making decisions based on incomplete or mismatched data.
The best tools in 2025 give quick creative performance signals, accurate cost joins, and measurement that works under new privacy rules. This helps you pause weak ads earlier and shift spend toward what actually performs.
In this blog, we'll walk through five top advertising analytics tools for 2025, show what each tool does best, and give short pros/cons so you can pick the one that helps you get faster, clearer results.
What Are Advertising Analytics Tools?
Advertising analytics tools gather ad data from different sources, join that data with performance events, and show simple, actionable results you can use. They typically take in:
Ad platform data(campaign, clicks, impressions),
Measurement partner events (installs, purchases, in-app events), and
Cost feeds (spend by network or campaign).
They turn this into clear outputs, such as ROAS, cost per acquisition (CPA), and which creative elements are working and which are not. These tools are built to reduce manual work and give numbers you can act on quickly.
Why They Matter for You
You want fast answers so you can stop low-performing creatives, reallocate spend, and brief the next test better. Good advertising analytics tools let you:
Spot winning creatives faster,
See true cost per conversion across networks,
Cut wasted ad dollars with clearer data, and
Create briefings based on real performance signals, not guesses.
Beyond day-to-day efficiency, these platforms bring several broader benefits that directly impact how well your campaigns perform.
Suggested Watch: A short walkthrough showing how Segwise highlights early signals from new ads so you can act sooner.
Core Benefits of Advertising Analytics Tools
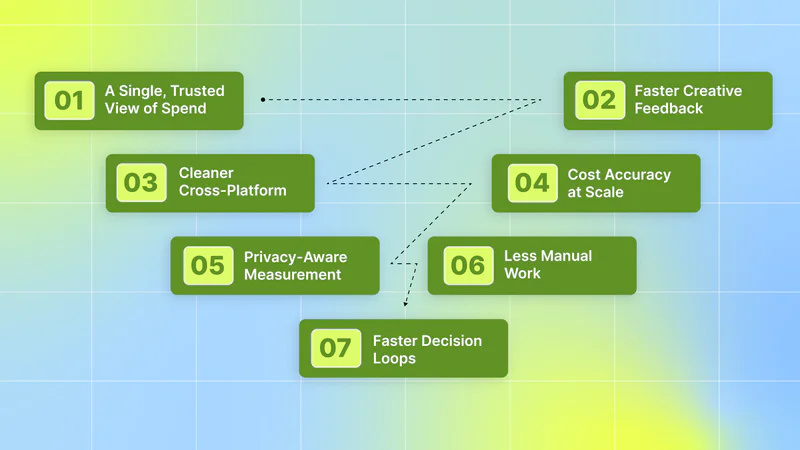
When you need to connect ad spend, creative tests, and real user value fast, the right tools give clear, action-ready signals and reduce guesswork. Here are seven core benefits these platforms deliver for those goals:
1. A single, trusted view of spend and results: You get all ad spend and outcome data in one place, so reports match across channels. That stops guesswork when you compare platform spend to installs and revenue. Tools that pull cost connectors and join them to attribution make monthly reviews and budget calls much faster.
2. Faster creative feedback, you can act on: You learn which ad images, hooks, or first seconds drive the right actions. Creative analytics links asset elements to performance, so you can spot winners and pause losers quickly. Faster signals mean you can reallocate budget before too much is wasted.
3. Cleaner cross-platform comparisons: When campaign names, creative IDs, and cost data are standardized, comparing iOS, Android, and other channels becomes straightforward. That lower-friction view helps you judge which channel delivers the cheapest retained users, not just the cheapest clicks.
4. Attribution and cost accuracy at scale: Modern tools handle many publishers and ad formats automatically. They match installs to the right touchpoints, apply fraud filters, and join accurate cost data so large budgets can be analyzed with confidence. This reduces wasted moves based on noisy or duplicated data.
5. Privacy-aware measurement for modern campaigns: New platform APIs and frameworks changed how installs and postbacks arrive on iOS. The right analytics stack blends aggregated iOS signals with other data sources so you keep measuring without exposing users. That approach keeps measurement functioning while complying with platform privacy rules.
6. Less manual work, fewer human errors: Automated pulls, standard mappings, and reusable reports cut time spent on spreadsheets and fixes. Fewer manual joins mean fewer mistakes, and your team can spend hours on tests instead of late-night data cleanup.
7. Faster decision loops and lower wasted spend: With reliable spend joins, creative signals, and clean attribution arriving sooner, you move budget away from poor performers faster. That shortens test cycles, lowers wasted spend, and speeds up the path to scalable creatives and channels.
Keep this list handy when evaluating tools or reviewing campaign reports. It helps you focus on what actually moves your metrics.
Now that you know what strong analytics tools can deliver, it’s time to look at which platforms actually provide those advantages in practice.
Also Read: Paid Ads Analytics Explained: A Creative Optimization Guide
Top 5 Marketing and Advertising Analytics Tools for 2025
With these benefits in mind, let’s look at some of the leading advertising analytics tools shaping how marketers measure and scale their ad performance in 2025. Each platform approaches analytics from a different angle; some focus on creative-level clarity, others on unified pipelines or attribution precision. Here’s how they compare:
1. Segwise

Segwise is an AI-driven creative analytics platform that automatically analyzes ad videos, images, audio, and text. It tags elements like hooks, characters, CTAs, product shots, on-screen text, and music, and links each tag to performance metrics such as installs, CTR, and ROAS.
By revealing element-level signals rather than campaign-level aggregates, Segwise helps teams identify which creative variants are working or failing days or weeks earlier than traditional attribution methods.
It also offers no-code integrations with major ad networks and Mobile Measurement Partners (AppsFlyer, Adjust, Branch, Singular, and others), allowing creative tags to appear alongside attribution and network data.
Key features:
Multimodal, automatic tagging across video, images, audio, and text (20+ standard tags plus custom tags).
Tag-to-metric mapping to help teams quantify the impact of specific creative choices on installs, cost, and engagement.
Studio/project views and unified dashboards that roll up creative analytics across apps, brands, or studios.
Fatigue detection and live creative tracking.
Pros:
Fast signals at the creative level so you can stop poor performers sooner and scale winners with more confidence.
Removes most manual tagging work with automated, consistent classification.
Cons:
Built mainly for creative analytics, you may still want a separate ETL or full-funnel attribution tool for advanced warehouse work.
Custom or high-volume integrations may require a paid plan or vendor setup support.
Connect Segwise to the same campaigns and attribution source you already use, compare element-level signals against your current reports, and measure how quickly creative patterns map to installs and cost metrics. Many teams see valuable insights within days.
Suggested Watch: A quick demo showing how Segwise flags dropping performance, so you can stop tired ads before they drain budget.
2. Improvado

Improvado is primarily a marketing data integration and ETL/ELT platform that centralizes ad, MMP, analytics, and other marketing feeds into a warehouse or BI layer. It does not advertise a built-in AI creative-tagging engine; instead, it reliably delivers normalized creative metadata and campaign-level fields into the destination where you can run creative analysis (via BI, SQL, or downstream tools).
Key features
Hundreds of native connectors that extract ad platform, MMP, analytics, and creative metadata into a single pipeline.
ETL/ELT pipelines that normalize and load marketing data into warehouses or BI tools (so creative fields can be joined with performance metrics in the data layer).
Prebuilt transformations, governance rules, and reporting templates to speed dashboarding once data is in the warehouse.
Pros
Centralizes raw creative identifiers and campaign attributes so analysts can build repeatable, custom creative reports in BigQuery/Looker/Tableau.
Cuts repeated manual exports and connector maintenance, freeing engineering time for building creative joins and models.
Cons
Not a plug-and-play creative insights product, you’ll need a BI layer, SQL, or an analytics/reporting tool to generate asset-level creative signals.
Implementation and ongoing mapping are engineering-heavy for reliable creative-level joins (naming standards and correct feeds matter).
Use Improvado when you want consolidated, normalized marketing data in a warehouse so your team (or BI layer) can produce bespoke creative-level analyses and dashboards.
3. Singular

Singular offers an explicit creative analytics product, Creative IQ, that combines automated creative tagging, asset galleries, deduplication/clustering, and creative-level ROI views to surface which visual/audio/copy elements correlate with revenue and other business KPIs.
Key features:
Creative IQ (AI-powered): pairs creative assets with performance KPIs and surfaces insights tied to installs/revenue, and ROI, not just impressions.
Automated visual/audio tagging and a standard tag set for traits like people, product shots, logos, text overlays, and audio cues.
Creative Gallery and reporting UI for side-by-side asset comparison and quick inspection of winners.
Clustering/deduplication to aggregate variants and report on a concept level rather than file-by-file noise.
Pros
Automated tags and galleries speed up the discovery of repeatable creative patterns tied to business metrics.
Cross-channel visibility lets you compare the same creative concept across networks without having to set up connections yourself.
Cons
To get robust ROI signals, you still need correct performance feeds and joins (Singular supports those flows, but data quality matters).
The suite is richer than a lightweight tagging tool, and smaller teams with simple workflows may find parts of the product more than they require.
Pick Singular (Creative IQ) when you want an integrated creative analytics product: automated tagging, concept grouping, and visual galleries with direct links to performance metrics.
4. Google Analytics 4 (GA4)

GA4 is an event-based analytics platform for web and apps; it does not provide built-in creative-level AI tagging or creative galleries. For creative analytics, you export raw GA4 events to BigQuery and join those events with ad/campaign/creative metadata (from ad platforms or your MMP), then run SQL or build dashboards to generate asset-level insights. GA4’s BigQuery export and the BigQuery Data Transfer are the documented routes for raw event access.
Key features
Event-based model across web and app that captures raw events you can export to BigQuery for custom analysis.
Native integrations with Google Ads and straightforward export paths into Google Cloud’s BigQuery for SQL joins.
Predictive metrics and standard report templates for behavioral analysis (but not asset-level creative tagging).
Pros
Cost-effective source of raw event data; BigQuery export makes it flexible for custom creative joins and models.
Works well if your analytics stack already lives in Google Cloud and you plan to build custom creative analyses using SQL/BI tools.
Cons
GA4 is a data layer rather than a creative analytics engine; you’ll need to join ad creative fields and build the analysis yourself.
Producing creative-level signals requires engineering/SQL and possibly additional data hygiene to map creative IDs across platforms.
Use GA4 + BigQuery when you want full control over raw events and are prepared to build creative-level joins and models in SQL or a BI tool.
5. Growify

Growify positions itself as an attribution and creative-monitoring product that includes creative analytics features: real-time creative monitoring, creative vs copy comparisons, and ranking tools to surface top creative elements across channels. Its product pages highlight creative monitoring and creative analytics capabilities.
Key features
Real-time creative monitoring and side-by-side comparisons of visuals and copy across platforms.
Ranking and performance tools to identify winning creatives and compare creative vs. copy performance.
Market comparison/content pages for vendor shortlisting and quick research.
Pros
Quick vendor research and easy creative comparisons for teams that want a simpler entry point into creative monitoring.
May work as a single-vendor solution for smaller advertisers who want combined attribution + creative monitoring.
Cons
Product depth varies by vendor; Growify’s comparison content is a strong point, but for heavy creative tagging or enterprise-scale analysis, you may need additional integrations or ETL.
If you need automated visual/audio AI tagging and large-scale deduplication/clustering, specialized creative-IQ tools (e.g., Singular) are more feature-complete.
Use Growify if you want quick monitoring, creative performance comparisons, or vendor shortlisting; treat it as a starting point unless you need heavy automated creative intelligence at scale.
Each platform has its own focus. Some work best for creative level insights, others for data consolidation or attribution accuracy. The right choice depends on what matters most to your team, such as faster creative signals, dependable spend tracking, or a unified view of performance. Match the tool's strengths to your campaign goals and workflows so your data drives quicker, clearer decisions.
After reviewing what each tool offers, the next step is to figure out which one best fits your setup. A structured approach helps you avoid mismatched choices and wasted effort.
How to Choose the Best Advertising Analytics Tool for Your Stack

Before jumping into specific platforms, it helps to know what really matters when picking one. Every analytics tool promises better clarity, but the best fit depends on your setup, goals, and daily challenges. Use the points below as a quick checklist to find a platform that actually works with your data flow, not against it.
Define your creative goal: Clarify what insights matter most; element-level metrics (headline, CTA, thumbnail), variant testing, creative fatigue, or cross-channel comparison. Pick a platform that measures the exact creative details you care about.
Check creative data coverage: Confirm the tool ingests creative IDs, asset metadata (file names, format, length), and asset-level performance. If it only aggregates at the campaign level, you’ll lose precision.
Ask for a sample creative insight: Request an example report like CTR by headline or play rate for the first three seconds, and see how long it takes to generate similar data after setup. Some tools work instantly after integration; others need mapping first.
Review how creative data is linked and enriched: Check how the system joins performance data to creative assets (via creative ID, file name, or tag). Ask if it supports auto-tagging, bulk edits, and visual previews (thumbnails or frames).
Compare built-in analysis features: Look for asset-level reports, variant comparisons, fatigue alerts, creative scoring, and visual galleries. Leading tools use computer vision or text recognition to automatically identify patterns in visuals.
Confirm export and audit options: Ensure you can export creative-level data (CSV, JSON, Parquet) or send it to your data warehouse. Check update frequency, data schema, and retention policy.
Assess tagging and workflow automation: See how the platform handles creative taxonomy manual tagging, automated labeling, or AI-based grouping. Ask about asset version tracking and update handling.
Match pricing to creative scale: Identify pricing drivers, assets analyzed, impressions processed, or user seats, and forecast costs based on your creative volume.
Use this checklist to keep evaluations focused on what matters: how deeply the tool analyzes creative assets, how quickly it surfaces actionable insights, and how easily your team can use and scale those insights across campaigns.
Also Read: The Most Powerful Tools for Creative Reporting
Conclusion
Start with the one question that is slowing decisions, run a short pilot on one app or campaign, and judge a tool by how quickly it gives clear answers from your own data. Measure success by how much sooner you can stop poor creatives and scale the ones that work, not by how many dashboards a vendor shows. Check connectors and export options before you buy, so setup and validation are faster. Only add more tools when each extra piece actually shortens time-to-insight or lowers the cost of making good choices.
If slow creative signals are holding you back, Segwise’s multimodal AI auto-tags elements across video, image, audio, and playables and links those tags to campaign metrics so you can see what changes performance sooner. It offers no-code connectors, fatigue tracking, and cross-network studio views; try it on your own campaigns and start a free trial.
FAQ's
1. What do advertising analytics tools actually do?
They pull ad platforms, cost feeds, and measurement events into one place and turn that data into simple metrics (CPA, ROAS, creative signals) you can act on quickly.
2. Which tool is best for fast, creative-level insights?
AI-first platforms that auto-tag visuals, audio, and text give element-level signals (which hook, shot, or CTA works) much sooner than campaign-level reports.
3. Which tool should I pick if I need a clean data pipeline to a warehouse?
ETL-first platforms and GA4 + BigQuery exports are the right fit when you want raw events and repeatable, governed pipelines for custom analysis.
4. How should a team decide which advertising analytics tool to buy?
Match the vendor to your biggest pain (creative signals vs. cost joins vs. full-funnel data), check required connectors and exports, and compare pricing for your expected volume.