Why Your Creatives (Not Audiences) Are the Real Targeting Lever in 2025

Introduction:
Creative fatigue, CPI volatility, engagement drop-offs, sound familiar? For UA managers battling the daily chaos of campaign optimization, there's a hard truth that’s emerging stronger than ever: targeting is no longer about audiences, it’s about creative variables.
If you're running campaigns for games with a core audience over 35 and still obsessing over lookalike setups or interest stacks… you might be focusing on the wrong lever.
In this blog, we’ll walk you through:
- The creative analytics mindset you should be adopting in 2025
- A real-world framework to identify what’s actually working (and why)
- The new role of formats, placements, and age relevance in creative success
- Tactical steps to scale what works without breaking your budget
The Death of Traditional Targeting (And What Replaces It)
For years, campaign success relied on slicing and dicing audiences:
Demographic filters, interests, behaviors - Facebook made it easy. But with privacy shifts (thanks, ATT) and increasing automation in ad platforms, targeting granularity is being abstracted away.
Now, platforms like Meta are nudging marketers toward broad targeting + performance-based delivery and that means your creative is your targeting.
Platforms optimize delivery based on who engages. That means if your ad resonates with 35+ males, Meta will find more like them automatically.
So, instead of fighting the algorithm, give it what it wants: high-performing, deeply relevant creatives.
The 8 Creative Metrics That Matter in 2025
To truly scale campaigns profitably, creative testing can't rely on vague feedback like "this looks good" or "this got some likes." You need quantifiable creative signals.
Here are the metrics every UA manager should obsess over:
1. CPA (Cost per Acquisition)
- The ultimate bottom-funnel indicator of ad success.
- Helps isolate which creative variant drives the cheapest user conversion.
2. CPI (Cost per Install)
- Useful for benchmarking install-level efficiency, especially on Android.
3. Outbound CTR (Click-Through Rate)
- Measures initial engagement. Are users interested enough to click?
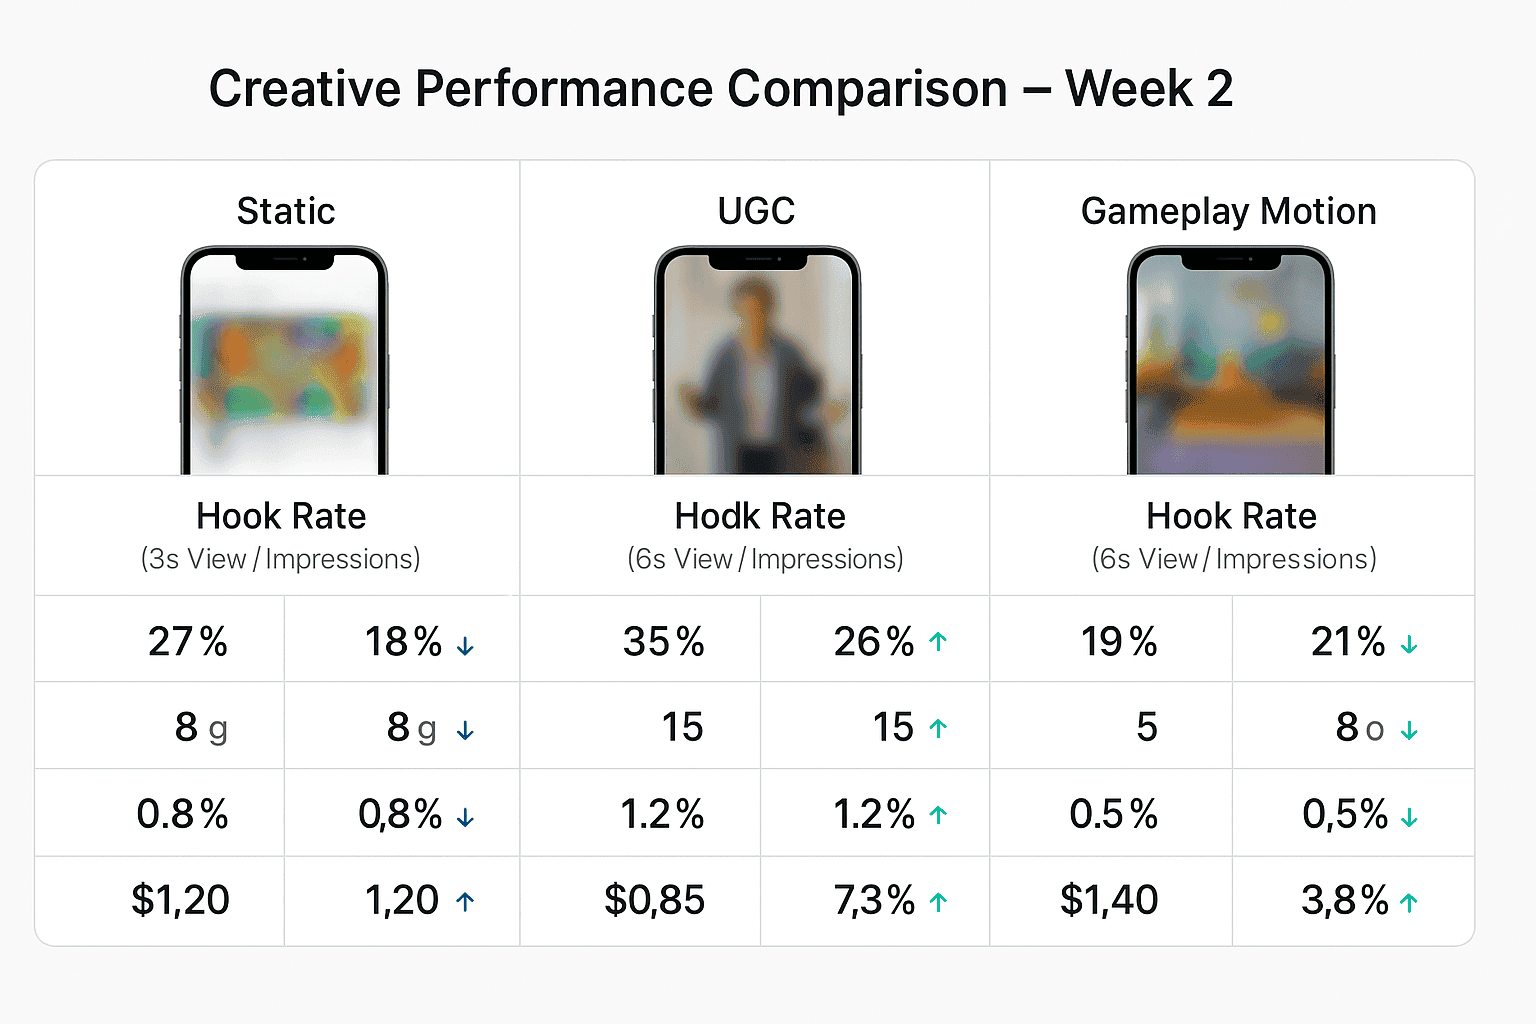
4. Hook Rate (3-sec video view / impressions)
- Indicates how well the first few seconds of your video grab attention.
5. Hold Rate (6-sec view / impressions)
- Measures mid-video engagement; strong hold rates = better storytelling.
6. Install Rate (Installs / Clicks)
- Reveals how compelling your store listing is after someone clicks.
7. IPM (Installs per Mille Impressions)
- Excellent top-level efficiency metric. Helps identify breakout creatives.
8. CVR to Target Action
- The true north of monetization: how many users actually complete your desired event (signup, level 3, purchase, etc.)
Pro Tip: Build your creative reports to track these metrics across ad variations, formats, and placements - side by side.
Finding Your "Needle in the Haystack" Creative
Let’s say you're testing 10 creatives within the same ad set (because… budget). They're mixed formats - some UGCs, static banners, motion videos.
Here’s the process to uncover the winner:
- Cluster by Concept
Group creatives by idea, not just format (e.g., “problem-solution,” “aspirational,” “raw gameplay”). - Watch the Engagement Metrics
Use hook rate, hold rate, and outbound CTR to spot what grabs attention. - Look at Downstream Conversion
Among the creatives that have strong engagement, which ones drive the best IPM or CVR to event? - Kill Quickly, Scale Fast
Pause underperformers aggressively. Funnel spend toward the breakout winners—even if it's just one creative. - Iterate with Intention
Don’t just tweak colors or CTAs. Double down on the winning variables—voiceover tone, story arc, opening frame, character choice, etc.

Formats & Placements: Where Your Audience Really Lives
If your target audience is 35+, they're probably not watching Reels. They’re in Feeds, possibly Stories. This matters because platform delivery will naturally prioritize the lowest-cost placements—unless you steer it.
Here’s what we recommend:
- Review placement-level performance weekly
- Exclude low-value placements that attract low LTV installs (like Reels or Audience Network)
- Focus budget on Feeds if that’s where your high-value users are
Example insight: In one campaign, switching spend from Reels to Feeds improved ROAS by 34% simply because the latter attracted the older, more monetizable audience.
Key Takeaway: Targeting = Creative Resonance
The marketers who win in 2025 won't be those who “hack” audiences.
They’ll be the ones who:
- Dissect creative performance with surgical precision
- Understand what storytelling elements move their users
- Use data to guide every iteration and scale decision
So next time you launch a campaign, don’t just ask: “Who am I targeting?”
Ask instead: “Which creative message is making them convert?”
Action Steps for UA Managers & Creative Leads
- Track the 8 key metrics above in your creative reports
- Test concepts before formats—story beats matter more than aspect ratios
- Review placement-level LTV, not just CTR or CPI
- Create a central dashboard where your team can see creative wins (and flops) clearly
- Use breakout winners as templates to produce 3 to 5 new iterations fast
- Bonus: Add a “creative feedback loop” with your motion team or external partners
Conclusion: Your Winning Creative Is Out There
Yes, creative testing can feel like searching for a needle in a haystack. But with the right metrics, the right mindset, and a tight feedback loop, you turn guesswork into strategy.
And when that one winning creative hits? You'll know.
It’ll dominate your spend, improve your ROAS, and unlock the next phase of profitable scale.
Stop targeting people. Start targeting perception.
📌 Ready to see how Segwise can help you analyze and scale your winning creatives faster? Book a demo →
🎯 Frequently Asked Questions (FAQ)
Q1: Should I still use lookalikes or interest-based targeting at all?
A: You can - but it's no longer your main growth lever. Meta’s algorithms have become increasingly adept at identifying your high-value users through broad targeting. Instead of manually narrowing audiences, invest more time in refining creative variations that attract the right users organically through engagement signals.
Q2: What’s the ideal number of creatives to test at once?
A: Start with 5–10 variations per concept when on a limited budget. If resources allow, aim for 15+ variations across different concepts. What matters most is testing distinct concepts rather than minor tweaks like color or text changes.
Q3: How long should I run a test before making decisions?
A: Allow 3 - 7 days depending on spend volume. Focus on early indicators like Hook Rate, Hold Rate, and IPM within the first 48–72 hours. Downstream metrics like Install-to-Event CVR should guide final scaling decisions.
Q4: How do I know if a creative has “fatigued”?
A: Watch for:
- Declining CTRs
- Rising CPIs or CPAs
- Flattened or dropping IPMs
If a previously strong creative drops in performance across multiple KPIs, it’s likely fatigued and needs fresh iterations.
Q5: Can I use one creative across all placements?
A: Technically yes, but it’s not always effective. Different placements (Feed vs. Reels vs. Stories) favor different creative lengths, hook speeds, and visual styles. Customize for the high-performing placement (usually Feed for 35+ users) and cut down or reformat for others if budget allows.
Q6: What's the best way to brief my creative team?
A: Focus your brief around:
- The core audience persona and why they care
- Top-performing past concepts (with metrics)
- Specific performance insights (e.g., “motion intro + emotional hook” works best)
- The goal metric you’re optimizing for (e.g., install, tutorial completion, purchase)
Q7: How do I scale a creative without tanking performance?
A: Once a creative hits the sweet spot (strong IPM, stable CVR, and solid ROAS), scale by:
- Creating fast-follow iterations with slight variations
- Expanding spend gradually across geos and lookalikes (if relevant)
- Avoiding rapid budget increases to prevent learning phase resets
Q8: What tools can help with creative analytics?
A: Popular tools used by top UA teams include:
- Segwise.ai for end-to-end creative tagging and performance breakdowns
- Motion (for D2C brands) for collaboration between UA and creative teams
- Looker/Data Studio dashboards for internal reporting

Comments
Your comment has been submitted