User acquisition (UA) is costly and unpredictable. Traditional early metrics, such as install counts or day-one retention, often fail to capture players' long-term value. This gap can lead to inefficient budget allocation and missed opportunities.
Predictive Lifetime Value (pLTV) addresses this challenge by analyzing early user behaviors, such as session frequency, in-app purchases, and engagement patterns, to forecast a player's potential revenue contribution over time. By using pLTV, you can make informed decisions about where to invest your UA budget, focusing on channels and strategies that attract high-value users.
Key Takeaways:
Why does pLTV matter, and how can it transform your user acquisition strategy by shifting focus from early metrics to long-term value forecasting?
Where should you implement pLTV models in your UA pipeline, across campaigns, platforms, creatives, and attribution data, for maximum impact?
What can you use pLTV for, including identifying high-value cohorts within 48 hours, reallocating budget based on predicted ROI, automating campaign decisions, and segmenting users by genre, region, and device?
What is Predictive Lifetime Value (pLTV)?
Predictive Lifetime Value (pLTV) is a method to forecast the total revenue a player will generate over their entire relationship with your game. By analyzing anonymized behavioral and spend data, pLTV models assign each new install a revenue projection, enabling you to compare acquisition sources and channels based on forecasted value.
Why pLTV Is Critical for Mobile Gaming?
Rising UA costs demand precision. Industry data shows that the global CPI for casual gaming rose to $2.95 between April 2023 and April 2024, and platform benchmarks sit at $2.5–$3.5 on iOS versus $1.5–$2.5 on Android, making undifferentiated spending unsustainable.
Revenue is highly skewed. Fewer than 2% of players (“whales”) drive the bulk of purchases, so blanket UA strategies dilute spend on cohorts unlikely to monetize.
Early cohort insights accelerate ROI. Advanced pLTV models can segment users by forecast performance within 48–72 hours of installation, enabling you to double down on high-value sources long before costs escalate.
Privacy‑aware segmentation preserves targeting. Privacy-aware segmentation aligns UA targeting with Apple’s SKAdNetwork by grouping installs into cohorts that meet SKAN’s privacy thresholds, preserving granular insights without individual-level tracking. Cohort-level pLTV modeling then utilizes SKAN’s six-bit conversion-value schema and defined postback windows (D1, D3, etc.) to predict early LTV, enabling rapid and efficient budget allocation despite IDFA deprecation. By leveraging SKAN 4.0’s hierarchical source identifiers and extended attribution windows, marketers gain richer multi-touch signals within Apple’s anonymized framework. This privacy-first approach sustains ROAS optimization and iterative campaign tuning through aggregated cohort insights, even in a post-IDFA landscape.
Dynamic reallocation cuts waste. Continuous pLTV recalibration enables you to pause spending on underperforming cohorts. Recent research indicates that top gaming titles have increased long-term LTV by up to 6% through sustained, data-driven budget adjustments.
The Cost of Ignoring pLTV
Mobile game markets are fragmented by genres with wildly different churn and spend patterns. Hyper‑casual titles may capture 27% of installs but only 11% of sessions, while action games draw smaller install shares yet generate far deeper engagement. Without pLTV insights:
Budget Misallocation: Teams optimize for low CPI or Day‑7 retention, overspending on cohorts that vanish after the first few sessions.
Reactive Tactics: Reactive tactics rely on manual budget and bid adjustments only after early metrics stabilize, often too late, resulting in delayed optimizations and wasted spend on underperforming campaigns.
Ignoring pLTV keeps UA teams locked in a cost-per-install treadmill, where rising CPIs and intense competition push budgets ever higher just to maintain install volumes, while profitability declines. By contrast, studios that embed pLTV forecasts see more predictable UA outcomes, better ROI transparency, and a sustainable growth engine, transforming UA from a reactive cost center into a strategic lever for long‑term success.
Having seen how pLTV can inform smarter spending across genres and cohorts, it’s time to dig into the methods behind the metric.
How pLTV Works: Two Methods for Mobile Marketers
You can use predictive Lifetime Value (pLTV) to enhance user acquisition by choosing between two modeling methods, based on your app's complexity and data size:
Curve‑Fitting (Simpler, Faster)
First, aggregate Daily Active Users (DAU) and revenue streams (in‑app purchases + ad income) into install‑date cohorts segmented by source, region, and OS. Ensure you exclude outliers (e.g., bot installs) and normalize for seasonality to prevent distortion in your retention estimates.
1. Retention Function Selection:
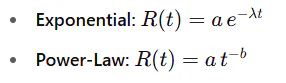
Fit your cohort’s day‑by‑day retention curve using non‑linear least squares to one of two parametric forms:
Compare model fits with Akaike Information Criterion (AIC) or Bayesian Information Criterion (BIC) to select the most parsimonious representation.
2. Integration Over Forecast Horizon:
Once you’ve estimated parameters (e.g., λ or b), analytically integrate the retention function from t=0 to your chosen horizon T (e.g., 30, 60, 90 days):
This yields the expected user days per new installation.
3. ARPDAU Computation:
For each cohort, compute:
Over the same period you used for integration.
4. pLTV Calculation:
Finally, multiply the integrated retention area by the cohort’s ARPDAU:
This gives you the cumulative revenue forecast per user over T days.
The simpler curve‑fitting approach fits a parametric retention curve, often exponential or power, over historical cohort data, integrates it across a predefined horizon, and multiplies the area under the curve by cohort‑specific ARPDAU (Average Revenue Per Daily Active User) to yield a reliable LTV forecast within minutes.
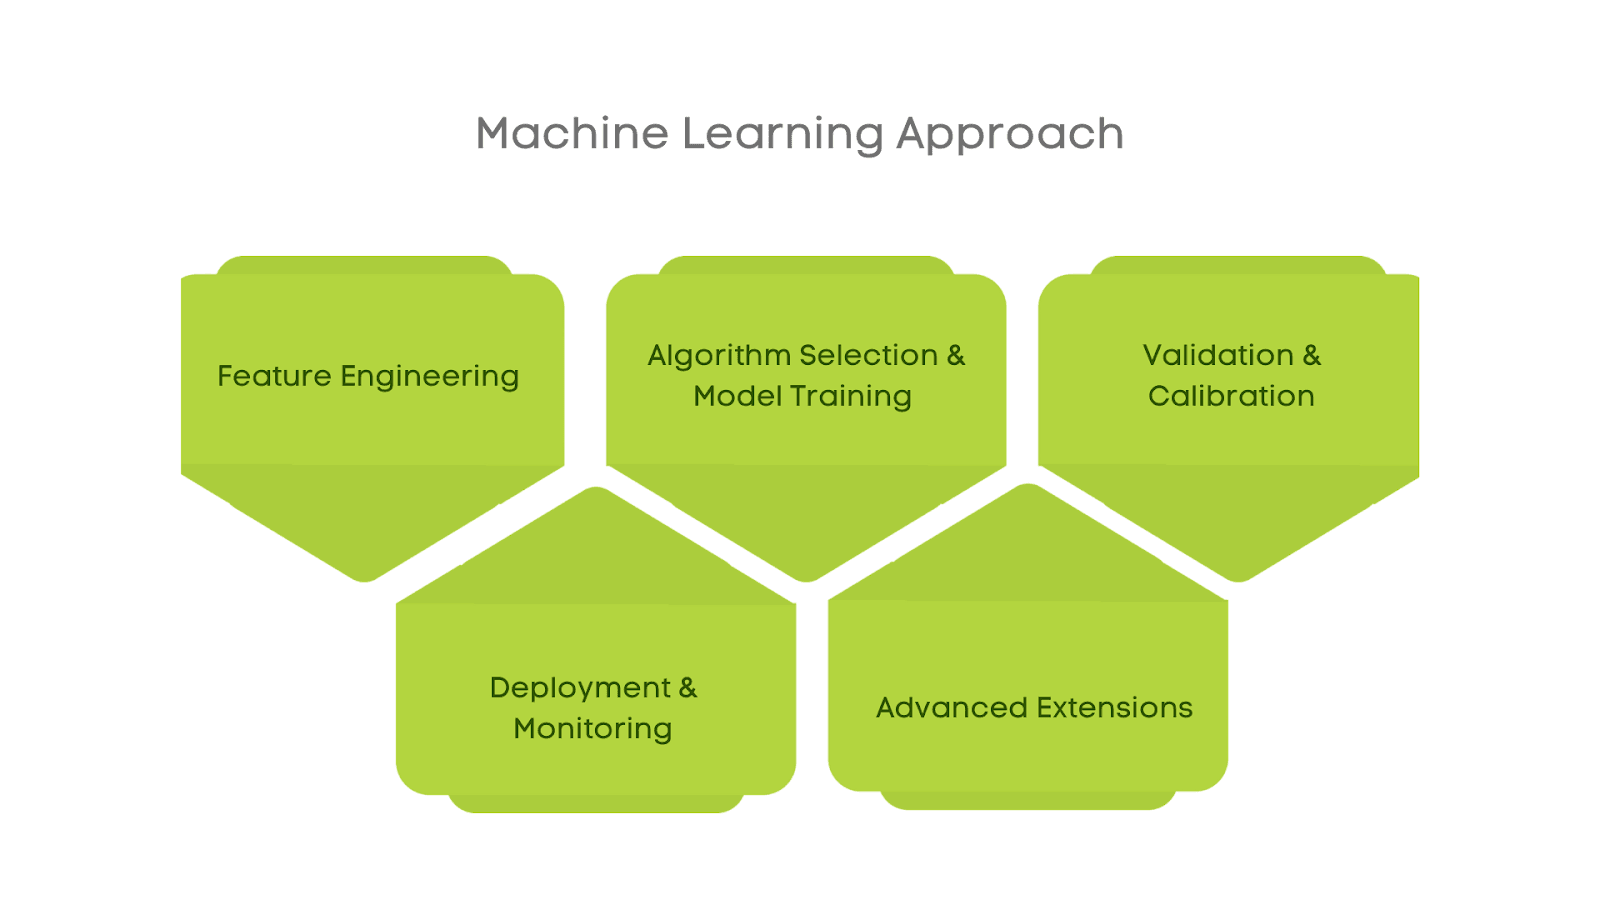
Machine Learning Approach
This method delivers dynamic, granular LTV forecasts by uncovering complex, nonlinear patterns in early user behavior:
1. Feature Engineering
Ingest a broad spectrum of early signals: first‑week purchase amounts, total session count and duration, time between sessions, tutorial completion events, ad‑exposure counts, device/OS demographics, and any custom in‑app milestones.
2. Algorithm Selection & Model Training
Train tree‑based ensembles (e.g., LightGBM, XGBoost) or feed‑forward neural nets on your feature set to predict cumulative revenue at horizon T. Use cross‑validation and hyperparameter tuning (grid or Bayesian search) to optimize depth, learning rate, and regularization.
3. Validation & Calibration
Evaluate predictive performance using metrics such as RMSE, RMSLE, and R² on hold‑out cohorts. Apply calibration techniques, such as isotonic regression or Platt scaling, if probability estimates or revenue distributions require adjustment.
4. Deployment & Monitoring
Package your trained model into your MMP pipeline or in‑house scoring service. Instrument real‑time scoring at install time to tag users with their predicted LTV. Continuously monitor for model drift by comparing predicted vs. actual LTV each cohort week and retrain on rolling windows of fresh data.
5. Advanced Extensions
Transfer Learning & Siamese Nets: Leverage cross‑domain data (e.g., prior title launches) with Siamese architectures to bootstrap new‑game forecasts.
Bayesian Deep Learning: Incorporate Monte Carlo Dropout to quantify uncertainty and flag low‑confidence LTV predictions for manual review.
Multi‑Task Learning: Jointly predict retention and revenue to exploit their shared variance and improve overall pLTV accuracy.
Alternatively, you can build a machine-learning pipeline that ingests hundreds of early-life signals (such as session counts, purchase events, and tutorial completions), trains ensemble or neural architectures, and evaluates predictive accuracy through metrics like RMSE, R², or RMSLE. Then, you can deploy, calibrate, and continuously retrain the model in production.
By choosing the curve‑fitting route, you gain speed and interpretability for stable titles; by adopting a machine‑learning pipeline, you unlock fine‑grained, dynamic forecasts suited to complex, data‑rich games.
With both modeling approaches in mind, let’s turn theory into practice and look at a real-world example of how pLTV transformed user acquisition at scale.
Case Study: Transforming UA Performance with pLTV
At Delightroom, the user acquisition (UA) team was spending over three hours manually calculating predictive lifetime value (pLTV) across multiple dimensions, channels, campaigns, creatives, country, operating system (OS), and various time intervals.
As campaign complexity scaled globally, this process slowed decision-making and limited your ability to react quickly to shifts in performance. Relying on static ROAS metrics left gaps, especially when cohorts underperformed after acquisition, despite early indicators.
Solution
To resolve this, they implemented pLTV engine powered by Bayesian curve-fitting. This model processes both first-party and mobile measurement partner (MMP) events to deliver personalized lifetime value (pLTV) forecasts up to 180 days, based on just three days of user activity.
Key advantages:
Time savings: Eliminated over three hours of manual work per analysis cycle.
Granular segmentation: Real-time pLTV and predictive ROAS (pROAS) insights segmented by channel, campaign, creative, country, and OS.
Automation-ready: Budget adjustments now occur dynamically through trigger-based logic. For instance, campaigns falling below target pLTV-to-CAC thresholds are automatically deprioritized.
The system enables them to compare acquisition costs and predicted user value in a unified dashboard. This enables near-instant visibility into campaign effectiveness and a clearer understanding of where to allocate spend for maximum return.
Recent advancements, such as transfer learning models like ADSNet, support even greater pLTV accuracy by leveraging cross-domain purchase behavior, increasing prediction lift in controlled environments by 3.4%.
Results
By replacing a manual, error-prone workflow with a fast, scalable process that lets your team focus on high-impact decisions. Beyond time savings, the improved data fidelity led to real-world performance gains. For context, comparable pLTV-driven optimization in other platforms (e.g., Pecan) has delivered:
2.7x uplift in ROAS
68% lower cost per install (CPI)
34% higher post-install monetization
The case study demonstrates the tangible benefits of pLTV, but how can you replicate this success? Let’s break down the steps to implement pLTV in your own UA strategy.
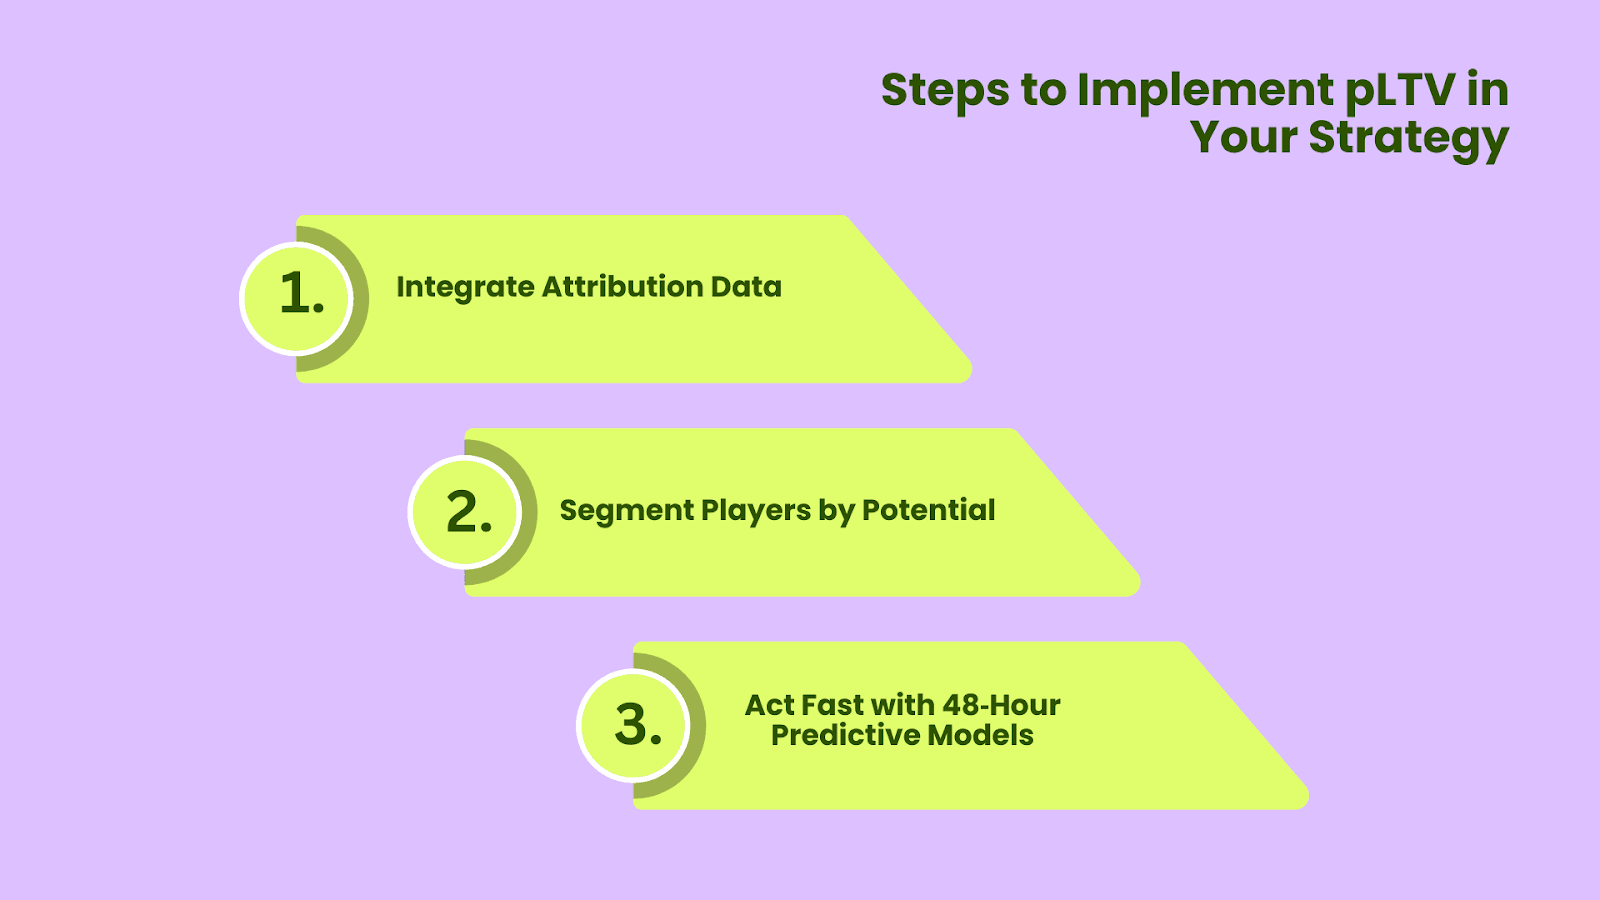
Steps to Implement pLTV in Your Strategy
To turn predictive LTV into a competitive edge, you need more than just raw data; you need a structured, action-ready approach. Here’s how to operationalize pLTV in a way that aligns with modern UA workflows and delivers results from day one:
1. Integrate Attribution Data:
To build a reliable pLTV framework, unify unbiased MMP attribution data (from platforms like AppsFlyer, Adjust, or Branch) with your first-party analytics. MMPs provide high-fidelity installation and in-app event data, while your internal sources capture granular behavioral signals, such as session starts, purchases, and user traits. Combining these ensures your pLTV model is rooted in both acquisition source accuracy and user-level engagement, enhancing predictive precision.
2. Segment Players by Potential:
Leverage early behavioral signals to cluster users into high, mid, and low-value cohorts. Prioritize Tier-1 countries such as the US, Japan, and Germany, where ARPU is consistently highest in mobile gaming. Use cohort slicing by creative, country, and OS to identify which combinations yield the strongest predicted lifetime value (LTV). Amplify this by integrating dynamic creative optimization (DCO), which aligns ad content with each segment, driving up to 7 times higher short-term ROI and 2.7 times better long-term value.
3. Act Fast with 48‑Hour Predictive Models:
Modern pLTV models can surface meaningful insights within 48 hours post-install, which is crucial for time-sensitive UA decisions. With early predictions, you can proactively identify low-value campaigns and optimize spend before inefficiencies accumulate. Platforms like Meta are advancing this trend, open-sourcing LTV modeling frameworks such as LTVision (2025), making rapid prediction accessible to more UA teams.
Once you have implemented pLTV, the next step is to leverage pLTV insights to optimize campaigns and drive stronger ROI across platforms.
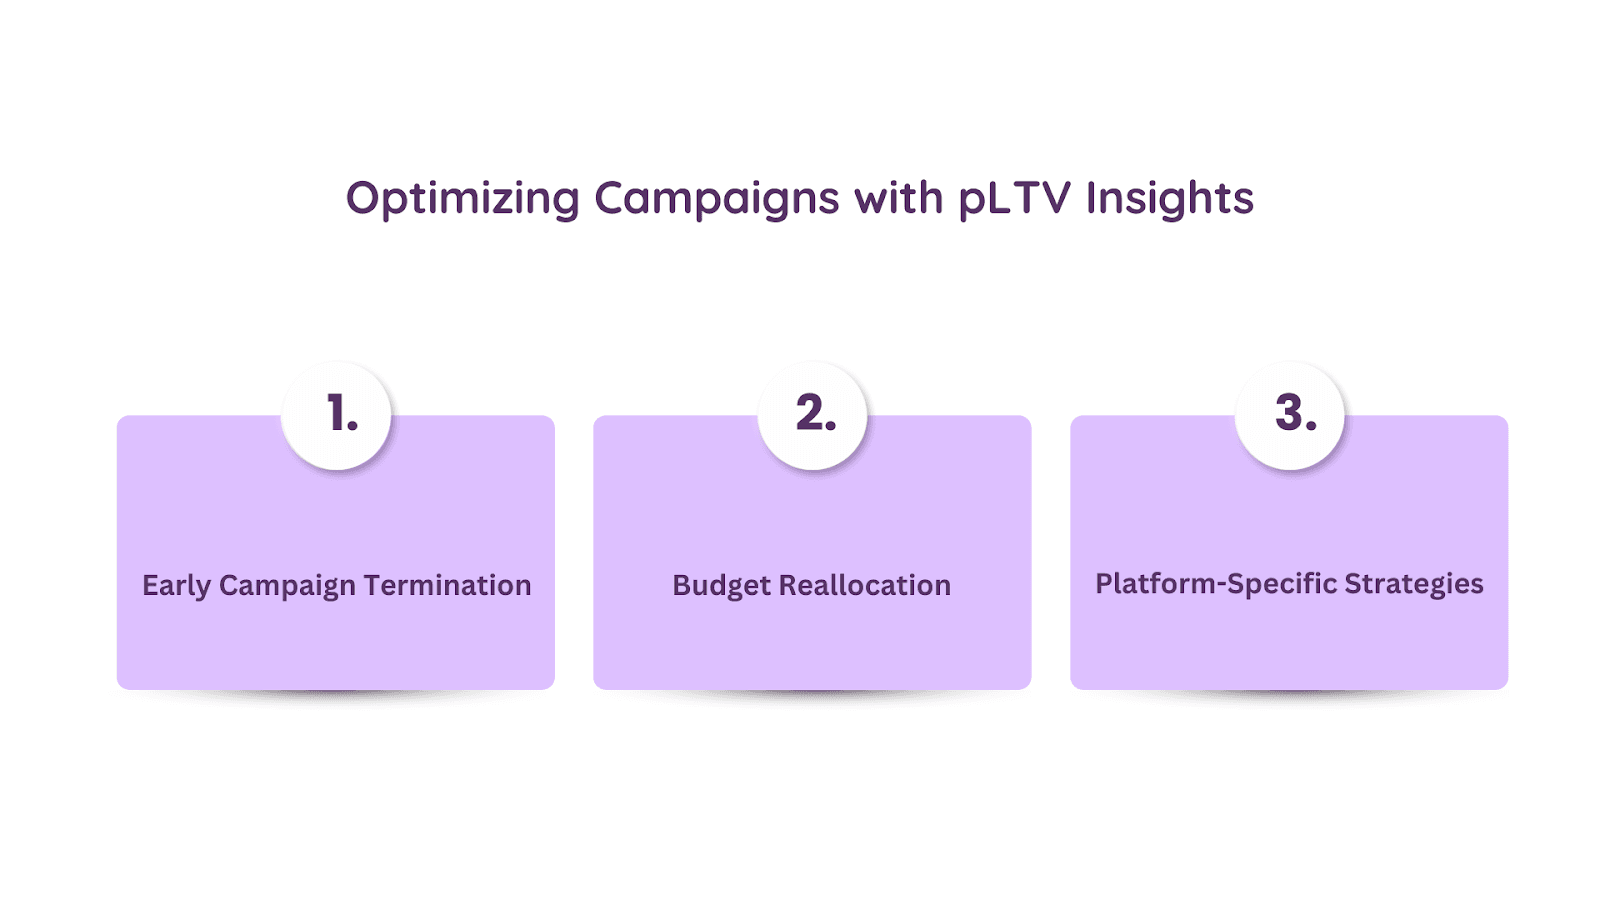
Once you have built a predictive foundation, the next step is to unlock its impact across campaign performance. These proven tactics will help you use pLTV insights to reduce waste, reallocate budget intelligently, and tailor strategies by platform to drive sustained ROI:
1. Early Campaign Termination
Utilize 48-hour pLTV insights to identify underperforming campaigns early, eliminating the need to wait 7–30 days for traditional LTV validation. Flag campaigns whose cohorts miss Day 2–3 revenue benchmarks and pause or pivot immediately, preventing budget drain.
2. Budget Reallocation
Once you’ve cut the underperformers, shift that freed‑up budget to channels and creatives showing the highest pLTV‑to‑CAC ratios. Comparing predicted user-level revenue against your acquisition cost enables you to invest confidently in areas where ROAS projections exceed your profitability threshold.
3. Platform-Specific Strategies
Device ecosystems behave differently, on iOS in Tier‑1 Western markets, mid‑core games often see a D90 ARPU of $9.69, whereas Android lags closer to $1.54. Use pLTV by OS to inform your bidding and creative playbooks: allocate more budget to iOS where predicted lifetime values are higher, or run targeted, lower-cost Android tests in emerging markets. Combine this with further segmentation by creative and geography to maximize yield across both platforms.
By integrating robust attribution data, zeroing in on your most promising cohorts, and acting on pLTV outputs within 48 hours, you’ll transform your UA approach from guesswork into precision‑driven growth.
To translate predictive lifetime value (pLTV) insights into measurable outcomes, integrate them directly into your user acquisition (UA) workflows. Prioritize early behavioral indicators to forecast user value, enabling fast, data-backed budget reallocations toward high-performing channels and creatives.
Utilize genre-specific cost-per-install (CPI) benchmarks to evaluate acquisition efficiency and ensure that spend aligns with projected returns. Run 48-hour pLTV assessments post-install to identify underperforming campaigns early and cut losses before they compound. Apply machine learning models to refine segmentation and enhance forecasting accuracy.
Embedding pLTV analytics into day-to-day decisions allows you to optimize UA strategies, boost ROI, and scale growth with confidence.
Accelerate your user acquisition strategy with Segwise. Start your 14-day free trial today, no credit card or engineering effort required.
FAQs
1. What is Predictive Lifetime Value (pLTV)?
pLTV forecasts the total revenue a user is likely to generate over time by analyzing early behaviors, such as session frequency and in-app purchases.
2. Why is pLTV important for user acquisition?
It enables marketers to allocate budgets more effectively by focusing on channels that attract high-value users, rather than relying solely on early metrics like install counts.
3. How quickly can pLTV models provide insights?
Advanced pLTV models can segment users within 48–72 hours post-install, allowing for timely campaign optimization.
4. What methods are used to calculate pLTV?
Common approaches include curve-fitting models for quick estimates and machine learning techniques for more dynamic, granular forecasts.
5. How does pLTV help in budget reallocation?
By identifying underperforming cohorts early, pLTV enables real-time budget adjustments, enhancing return on ad spend and minimizing waste.
AI agents to help you unify creative data across 15+ networks, simplify creative analytics, track fatigue and generate winning ads backed by data. Get started in less than 5 minutes with our no code integrations.