Relying solely on raw past performance metrics without feeding them into the right models can obscure early warning signs of user disengagement and lead to overspending on underperforming campaigns, missed retention opportunities, and ultimately lost revenue.
In contrast, when historical metrics are ingested by appropriately chosen predictive analytics models (from time-series forecasting to regression and classification), they become powerful signals that forecast future user behaviour, flag at-risk players early, and guide smarter acquisition spending.
Key Takeaways:
Why early user data and predictive models matter and how they help optimize marketing spend within the first 48 hours.
How identifying high-value users early improves targeting and reduces wasted acquisition budget.
What steps to take to reduce churn, including forecasting risk and personalizing retention strategies.
How behavioral segmentation can tailor in-game content and offers to drive higher conversion.
Aligning UA and monetization strategies with accurate LTV projections is key to maximizing ROI quickly.
What is Predictive Analytics (and Why It Matters)
Predictive analytics is an advanced data analysis method that combines historical data, statistical algorithms, and machine learning techniques to forecast future user behavior. By identifying patterns in past data, predictive analytics enables businesses to anticipate outcomes and make informed decisions proactively.
For instance, Rocket Studio, a Vietnamese hyper‑casual developer, used AppsFlyer’s Predict solution to convert limited 24‑hour SKAdNetwork data into projected day‑30 ROAS and ARPU metrics, then fed those predictions into Facebook Gaming’s optimization engine, driving a 6× revenue lift and a 42% boost in Day 7 ROAS. Under the hood, AppsFlyer built this predictive capability using AWS SageMaker and serverless services, cutting the time-to-production by 66%.
Key Applications & Strategic Value:
Applications
Here are some key use cases:
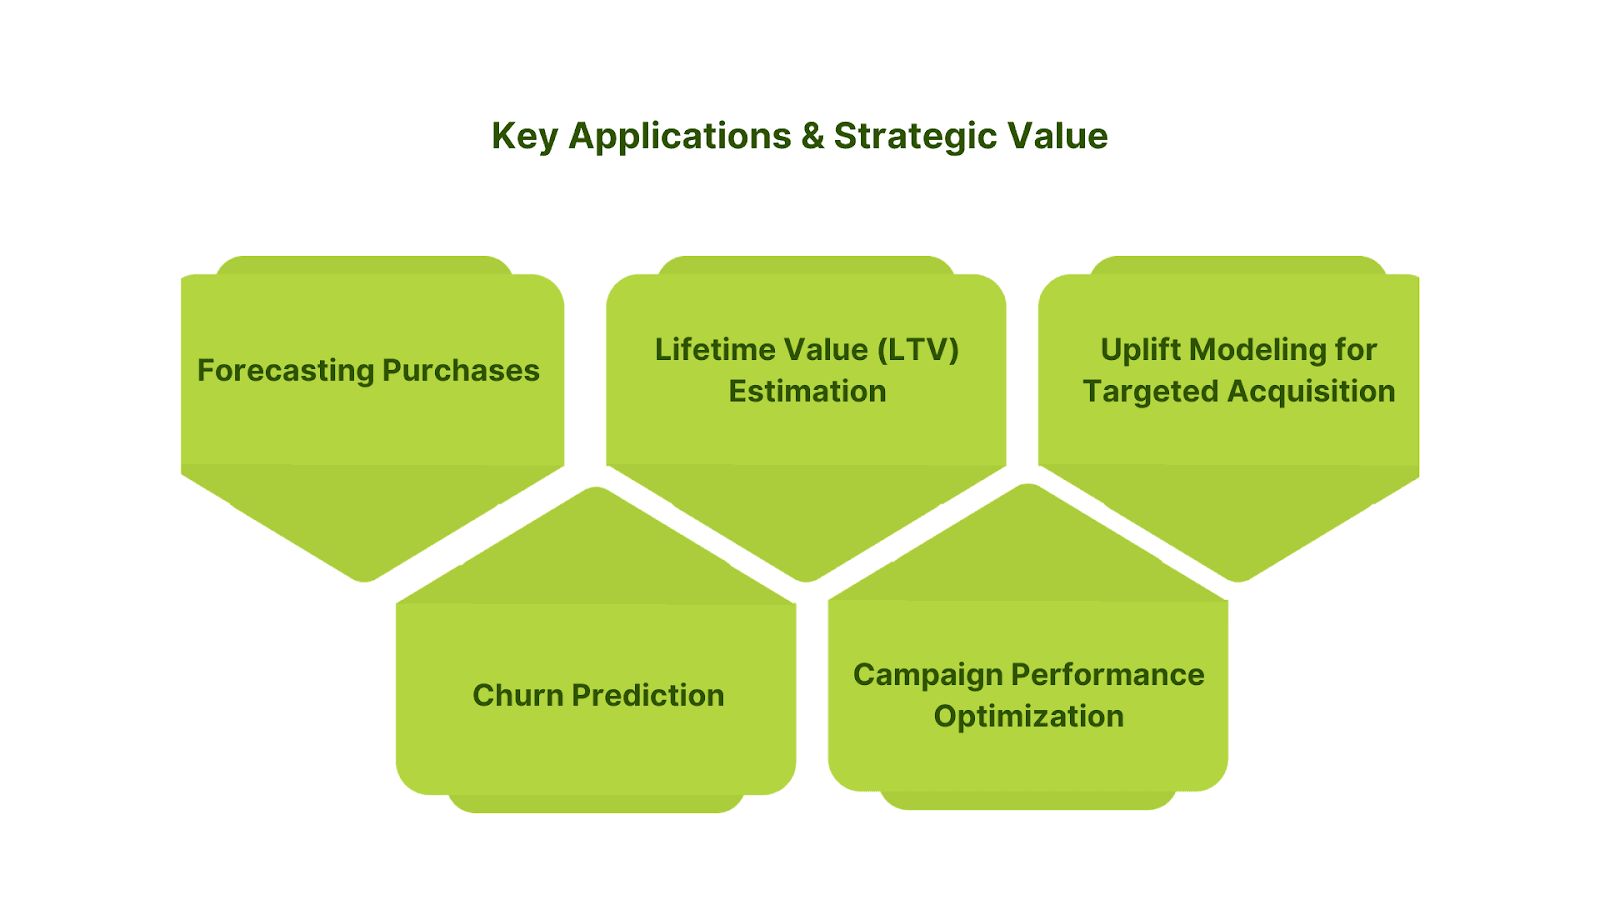
Forecasting Purchases: Forecasting translates into predicting in‑app purchase likelihood using engagement and conversion KPIs, ensuring UA budgets, bid pacing and creative rotations are timed for maximum return.
Churn Prediction: Pinpoint users at risk of leaving by examining engagement patterns, and implement targeted retention strategies to minimize churn.
Lifetime Value (LTV) Estimation: Forecast potential revenue per user to prioritize high-value customers and better allocate your marketing budget.
Campaign Performance Optimization: Estimate campaign success by analyzing audience demographics, ad placements, and historical performance to improve ROI.
Uplift Modeling & Predictive ROAS (pROAS) for Targeted Acquisition: Use uplift modeling to pinpoint persuadable users, those whose actions are incrementally influenced by marketing, and layer on predictive ROAS to forecast each segment’s return on ad spend, dynamically shifting budget toward cohorts with the highest incremental lift and true profitability.
Strategic Value
Predictive analytics enables proactive decision-making. Tailor user experiences with personalized content, adjust operational workflows, and reallocate resources more effectively, keeping you ahead of competitors by anticipating market shifts.
But how exactly do predictive models move from raw data to actionable insights? Let’s walk through the process.
How Predictive Analytics Works: From Data to Action
Predictive analytics works through these core steps:
1. Data Collection & Cleaning:
The process begins by ingesting raw event streams from SDK logs, ad-network reports, and CRM profiles, which capture installs, clicks, in-app events, and user demographics.
Raw UA data often includes duplicate install or click records, missing attributes (e.g., device IDs, OS versions), and inconsistent campaign tags that can skew analytical outcomes.
Cleaning involves deduplicating events, imputing or dropping missing values, reformatting fields, and normalizing timestamps to ensure uniformity across sources.
These transformations are typically automated using robust data pipelines, built with ETL tools or streaming frameworks, that validate, monitor, and version each step before loading it into data warehouses.
For Example,
Deduplication: Filter out duplicate installs and clicks within the attribution window by matching device IDs and event timestamps.
Missing‑Value Handling: Impute missing device or user attributes using lookup tables or drop records missing crucial fields to preserve data quality.
Campaign Naming Standardization: Parse and split campaign identifiers into channel, country, and creative‑ID fields via regex transforms to enforce consistency across ad networks.
Fraud Filtering: Exclude suspicious installs showing high‑frequency events from single IPs or anomalous session‑to‑install ratios to prevent inflated LTV forecasts.
Once cleaned and consolidated, these unified datasets feed into ML workflows where models for LTV forecasting, churn prediction, and ROI optimization are trained and deployed, powering data‑driven UA strategies in mobile gaming.
2. Model Training:
Machine learning (ML) algorithms identify patterns in historical and real‑time user behavior, such as session frequency, purchase amounts, and engagement signals, to forecast forward‑looking metrics like predictive lifetime value (pLTV) and predictive return on ad spend (pROAS).
pLTV estimates the total revenue a user is expected to generate over their entire relationship with your app or service, enabling early identification of high‑value users for targeted acquisition and retention campaigns.
pROAS uses these revenue forecasts alongside projected media costs to predict revenue per dollar of future ad spend, empowering dynamic bid optimization and budget reallocations toward the most profitable channels.
For instance, a pLTV model might predict that a new user cohort will generate $100 in lifetime revenue; when paired with a planned $20 ad spend, this yields a pROAS of 5:1 (reflects $5 earned for every $1 spent) guiding bid strategies to favor similar users well before actual revenue materializes.
3. Cohort-Based Forecasting:
Cohort-based forecasting divides users into segments based on shared characteristics such as geography, traffic source, or platform type. By analyzing these cohorts separately, you can achieve more precise predictions tailored to specific audience behaviors.
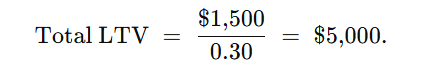
For example, suppose a cohort of U.S. users generates $1,500 in revenue during their first month of using the app. That amount represents 30% of their total lifetime value (LTV) realized in that period. Predictive analytics then extrapolates total LTV by dividing the first‑month revenue by the proportion already monetized:
This granular, formula‑driven approach empowers marketers to fine‑tune UA strategies for each audience segment.
The final step is integrating predictive insights into actionable workflows across UA campaigns, retention strategies, and monetization efforts. This enables more informed budget allocation and campaign adjustments based on projected return on investment (ROI).
With a clear understanding of how predictive analytics functions behind the scenes, let’s look at how it drives measurable improvements, starting with user acquisition.
Enhancing User Acquisition
The main challenge in user acquisition is the delay between investment and measurable returns. You launch campaigns, spend budget, and wait weeks to see if you've acquired valuable users or wasted resources. Predictive analytics bridges this gap by using early user behavior to forecast long-term outcomes, allowing for quicker, data-driven decisions:
1. Optimize Campaigns Within 48 Hours
Traditional campaign optimization often waits 7–30 days to accumulate performance data, but that delay dilutes your ability to steer results. Predictive analytics solves this by surfacing early behavioral signals and forecasting long‑term outcomes, enabling you to optimize acquisition spend within the critical first 48 hours. By leveraging predictive ROAS and predictive LTV (pLTV), you align marketing and monetization strategies at the moment each decision has maximal impact.
Android Hypercasual (ads‑only): 64 % of cumulative revenue is captured by Day 3, making ad‑driven models exceptionally powerful for high‑volume engagement games in the first 48 hours.
iOS Hybrid (Casual games): 55 % of total revenue is reached by Day 7 when combining in‑app ads and purchases, underscoring how hybrid strategies accelerate breakeven within the launch week.
Non-gaming Subscriptions: Free-trial conversions occurring between Day 3 and Day 7 account for at least 50% of Day 90 revenue, highlighting the outsized value of early conversion metrics.
By zeroing in on these early‑moment revenue curves, you can make data‑driven tweaks when they matter most, amplifying ROI and setting the stage for sustained growth.
2. High-LTV User Targeting
Not all users are created equal. Some will engage briefly and never return, while others become loyal, high-spending customers. The challenge lies in identifying these high-value users early enough to adjust your acquisition strategy. Predictive analytics makes this possible by forecasting Lifetime Value (LTV) based on early engagement patterns. By collecting data at the user level within their first 24 hours in your app, you can begin building predictive profiles that correlate early behaviors with long-term value. These profiles become increasingly accurate as you segment them by platform, country, traffic source, and optimization type. This segmentation allows you to:
Build custom acquisition strategies for different user segments.
Identify behavioral patterns that indicate higher future spending.
Target acquisition channels that consistently deliver higher-value users.
Allocate budget based on projected value rather than volume metrics.
The most sophisticated predictive models can distinguish between users who will make a single purchase and those who will become recurring spenders, enabling you to prioritize acquisition channels that deliver the latter.
3. Reduce Wasted Spend
Predictive analytics delivers substantial value by identifying underperforming user cohorts before they consume significant portions of your budget. Pixonic’s mid‑core game showed that focusing spend on top‑performing creatives drove a 33.2% uplift in Day 7 ROAS, illustrating the ROI upside of reallocating spend away from weak cohorts.
By implementing predictive models that forecast retention and revenue metrics, you can:
Identify the bottom-performing campaigns within days rather than weeks.
Terminate or significantly reduce spending on unpromising cohorts.
Establish clear performance thresholds for automatic campaign pausing.
Continuously refine your targeting criteria based on predictive insights.
This approach is particularly valuable for non-gaming apps on Android, where studies show potential monthly savings exceeding $280,000 for advertisers who typically make decisions on day 26. For iOS gaming apps, where CPIs are typically higher, early termination of underperforming campaigns could save between $20,000 and $69,000 monthly.
4. CPI Bidding with Predicted LTV
Traditional CPI (Cost Per Install) bidding treats all installations equally, regardless of the user's potential value. Predictive analytics enables a more sophisticated approach: dynamic bidding based on predicted user value across different segments. By calculating projected LTV for users from specific sources, countries, and acquisition channels, you can calibrate your CPI bids to maximize ROI.
To implement this strategy effectively:
Build payment profiles based on at least 1,000 installations and 75+ paying users with 7+ days of usage.
Segment these profiles by platform, country, traffic source, and optimization type.
Calculate multipliers that predict full LTV based on the early revenue indicators
Adjust your maximum CPI bids according to these predicted values.
This approach prevents situations where you might underbid for high-value users (missing acquisition opportunities) or overbid for low-value users (wasting budget). For example, if users from a specific channel and country demonstrate 3x higher predicted LTV, you can proportionally increase your CPI bid while maintaining profitability.
Once you've optimized acquisition with smarter spending, the next challenge is keeping those users engaged. That’s where predictive analytics makes an even deeper impact through retention strategies.
Retention & Engagement: Keeping Players in the Game
Predictive analytics offers powerful solutions to identify at-risk players before they churn and create personalized experiences that keep them engaged for longer:
1. Churn Prediction: Identifying At-Risk Users
By analyzing early activity metrics such as session frequency, session length, progression rate, and social interactions, you can pinpoint players who show disengagement signals within their first few days.
For example, Candy Crush Saga, which has amassed over 3.6 billion downloads, uses AI‑driven predictive analytics to flag new players whose session frequency and progression plateau as high‑risk. The UA team feeds these risk scores into a real-time dashboard, monitoring Day 1–7 churn predictions to automatically trigger retargeting campaigns across social media and in-app push notifications. High‑risk players then receive personalized incentives, such as free boosters or extra lives, within 24 hours to re‑engage them before they churn, enabling UA teams to optimize ad spend and maximize retention.
2. Segmentation for Personalization
Effective player segmentation is fundamental to creating personalized experiences. Predictive analytics helps you move beyond basic demographic segmentation to behavior-based groupings that reflect how users actually interact with your game:
Social players: Users who primarily engage with community features.
Spenders: Segmented by spending patterns and potential LTV.
Competitive players: Those motivated by leaderboards and achievements.
Casual players: Users with sporadic, shorter gameplay sessions.
Predictive analytics enables you to deliver dynamically personalized content that resonates with individual players. By analyzing past behavior patterns, you can predict which game elements will most appeal to specific users:
Playrix, the studio behind Gardenscapes and Homescapes, harnesses predictive analytics to craft personalized player experiences. By analyzing gameplay data, spending habits, and engagement patterns, they tailor content to individual preferences. For instance, puzzle enthusiasts receive more challenging levels, while narrative-driven players encounter richer storylines. This approach has led to improved player retention and satisfaction.
Now that you’ve built a loyal user base, the final step is maximizing revenue from your most valuable players while keeping the experience rewarding for everyone.
Monetization & LTV: Maximizing Revenue
Predictive analytics transforms monetization strategies by allowing you to forecast player value, identify high-potential spenders, and optimize promotional offerings for maximum impact.
1. LTV Forecasting: Predicting Long-Term Value
LTV (Lifetime Value) forecasting represents one of the most powerful applications of predictive analytics in mobile gaming. By analyzing early user behaviors, you can project how much revenue different player cohorts will generate over their lifetime.
The process typically involves:
Collecting user-level data during their first days in your game.
Building payment profiles based on platform, country, traffic source, and optimization type.
Extrapolating these profiles to predict long-term spending patterns.
Continuously recalibrating predictions as more data becomes available.
With accurate LTV forecasts, you can optimize your acquisition strategy by ensuring that Cost Per Acquisition (CPA) remains lower than predicted LTV, thereby guaranteeing positive ROI on marketing spend.
2. Early Identification of High-Spenders:
Predictive analytics allows you to identify potential "whales" (high-spending players) based on their behavior during the first few days of gameplay. By analyzing indicators such as progression speed, optional purchases, engagement with premium features, and early spending patterns, you can predict which users have high spending potential.
Games like Genshin Impact utilize early behavioral indicators such as rapid progression, initial in-app purchases, and frequent engagement with premium content to forecast a player's potential lifetime value. By identifying these patterns early, predictive models can tailor in-game offers and promotions to retain these high-spending players, who, despite constituting only about 1–2% of the user base, often contribute to over half of the game's revenue.
3. Optimized Promotional Strategies
Uplift modeling, a specialized form of predictive analytics, allows you to test and implement promotions with the highest impact on revenue and retention. Rather than offering the same promotions to all users, you can use predictive models to determine:
Which players will respond positively to which types of offers?
The optimal discount level for maximizing conversion without sacrificing revenue.
The ideal timing for different promotional offers.
Which offers will drive additional purchases versus cannibalizing planned purchases?
For example, Candy Crush Saga by King effectively uses uplift modeling to optimize in-app promotions and drive player engagement. For instance, King identifies users who actively participate in seasonal events but do not make purchases. Targeted exclusive in-game offers tied to these events are then deployed, which helps increase both acquisition and retention without cannibalizing planned purchases. Also Read: How Early Monetization Boosts User Acquisition in Mobile Games
Conclusion
Predictive analytics transforms mobile game marketing by turning early behavioral signals into strategic foresight. Rather than reacting to lagging performance indicators, developers can now anticipate churn, identify high-value users, and optimize acquisition spend within days, not weeks.
As shown through examples from studios like Rocket Studio and King, leveraging models like predictive LTV, churn forecasting, and uplift modeling allows teams to target more accurately, personalize at scale, and reduce wasted spend. The result is a smarter, faster feedback loop that improves ROI across the entire player lifecycle, from acquisition to monetization.
Boost your user acquisition efforts and drive meaningful campaign results with Segwise. Start your 14-day free trial today.
FAQs:
What is predictive analytics, and how does it help mobile game marketing? It uses historical behavior and machine learning to forecast user value, churn, and engagement, driving better targeting and ROI.
How soon can predictive models provide actionable insights? Within 24–48 hours of install, helping optimize spend before significant budget is wasted.
How does predictive LTV improve user acquisition strategy? It allows dynamic CPI bidding based on expected user value, increasing efficiency and profitability.
Can predictive analytics reduce churn? Yes, by flagging at-risk users early and enabling personalized interventions that retain players.
What’s the ROI impact of using predictive analytics? Smarter targeting, reduced waste, and increased retention lead to higher Day 7 ROAS and long-term revenue gains.