FIFA World Cup Mobile App Trends: What 2022 Data Means for UA-Teams
The FIFA World Cup 2026 opens on June 11 with an estimated 6 billion people expected to engage across broadcast, streaming, and second screens. For mobile app marketers, the 2022 tournament showed that the largest install and session lifts cluster around opening week and national-team match days, not the final. Acting on that pattern requires creative responsiveness in days, not weeks, which is where creative analytics platforms like Segwise earn their keep during compressed event windows.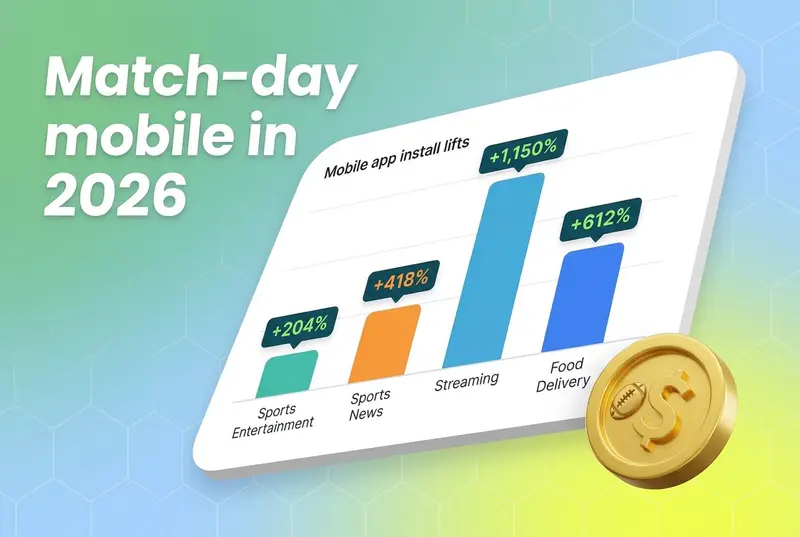
The 2026 tournament is the first hosted by three nations (U.S., Canada, Mexico), the first to feature 48 teams and 104 matches, and the first to run 39 days. It also lands on the largest mobile second-screen audience in history. eMarketer projects 216.8 million U.S. adults will use a smartphone as a second screen this year, or 80.6% of the population. Each of those phones is an attention surface your creative is competing for.
Match-day demand reorganises mobile behaviour faster than almost any other recurring event. People check live scores mid-game, stream on a phone when the TV is taken, place bets between plays, manage fantasy rosters, order food at half time, and react to highlights before replays finish. For app marketers running paid acquisition during the tournament, the question is not whether engagement will spike, but where, when, and for how long.
This piece walks through what the 2022 data actually showed, what it means for 2026 planning, and how teams can stay ahead of fatigue and audience drift across a compressed event window.
Also read How to Set Up AppLovin or Axon Ads: A 2026 Playbook
Key takeaways
The 2026 FIFA World Cup is projected to reach 6 billion people globally, a 20% increase over Qatar 2022, per FIFA's tournament outlook.
Sports entertainment and sports news installs ran 131% to 204% above baseline through the first week of the 2022 tournament, with the single largest spike on November 22, according to Adjust and Sensor Tower data.
Engagement was concentrated around national-team activity. France's opening match pushed sports entertainment installs up 406% and sports news installs up 418% in Western markets, per Adjust's 2022 analysis.
Non-participating markets still produced massive demand. Mainland China saw iOS sports entertainment install growth above 1,150% during the first matchday window, per the same dataset.
Around 60% of fans use a second screen during matches, per Odeeo's 2026 second-screen analysis, and 51% of those use social media while watching, per Statista's second-screen data.
The 2026 tournament is expected to add an incremental $10.5 billion to global ad spend, a 1.1% lift after inflation.
On Meta and TikTok, creative concepts decay roughly twice as fast as they did pre-2024, which compresses fatigue cycles inside a 39-day event window.
What 2022 actually showed: engagement patterns by category
The 2022 tournament was the cleanest read mobile marketers have on how mobile behaviour reorganises around the World Cup. Three patterns held up across markets.
Opening week beat the final
Sports entertainment and sports news installs stayed well above the pre-tournament baseline for the first seven days. Adjust's analysis put daily spikes between 131% and 204% above the 14-day pre-tournament average. The single largest day was November 22, when sports entertainment installs hit 189% and sports news installs hit 204%. That day stacked three high-stakes matches (Argentina vs. Saudi Arabia, France vs. Australia, Mexico vs. Poland) into one calendar slot.
Streaming followed the same shape. Streaming installs jumped 46% globally on opening day vs. the November 2022 average and ran 41% above baseline through week one, per the same data.
By the time the quarter-finals rolled around on December 9 and 10, sports entertainment and sports news installs were still up, but only 30% to 41% above baseline. The funnel had narrowed.
For 2026, this matters because it inverts the default creative plan. Most campaigns are still built around the final. The 2022 read says the bigger opportunity is the front of the bracket.
National-team activity moved the numbers most
Country-level engagement clustered around national-team match days. Adjust reports that France's opening match against Australia pushed sports entertainment installs up 406% and sports news installs up 418%, the largest single spike in any Western market. Argentina was 313% above baseline in sports entertainment and 288% in sports news the day before its first match.
Brazil reached 273% in sports entertainment and 225% in sports news on November 22. Two days later, during Brazil vs. Serbia, those numbers climbed another 248% and 188%, respectively.
The U.S. read is the one to study for 2026. Sports entertainment installs rose 223% and sports news installs climbed 203% during the U.S. opening match against Wales on November 21, a meaningful lift for a market where football competes with the NFL, NBA, and college sports calendars. Even with the U.S. out of the bracket, sports entertainment installs spiked 107% during the final itself.
Eliminations also produced predictable retreats. Brazil's loss to Croatia dropped sports entertainment downloads 9% and sports news installs 29% the next day. Germany's elimination pushed sports news installs down 23%. England's quarter-final exit triggered a full week where sports entertainment installs ran from negative 44% to negative 67%.
App categories followed different match-day patterns
Sports games moved less aggressively than news and streaming, but more steadily. Global installs rose 18% on opening day and averaged 9% above baseline in week one, with EMEA peaking at 39% on November 26 and North America at 33% during U.S. vs. England, per Adjust.
Betting and gambling apps saw installs up 8% globally on opening day, with most activity in EMEA (29% installs, 15% sessions on November 22). Food delivery installs and sessions rose 15% and 10% on opening day, with EMEA showing 39% install lifts on multi-fixture days. Shopping moved least globally, but LATAM saw a 61% install spike on November 22 and North America saw 33% installs and 40% sessions on November 25 during U.S. vs. England.
The takeaway is that the category mix matters as much as the calendar. Food delivery and shopping responded to match scheduling. Streaming and news responded to national-team narratives.
What this means for 2026 planning
Mobile behaviour reorganises around national-team activity and match schedules. For app marketers, that is the working assumption to build the next six weeks around.
A few practical implications:
Front-load creative and budget against opening-week match days, not the final. The 2022 data is clear that the largest install windows come early. With 48 teams in 2026 vs. 32 in 2022, the opening phase will run longer and stack more matches per day. Plan creative refreshes around the matchday calendar, not the bracket position.
Build creative variants per market and per national-team narrative. The same matchday produced wildly different responses depending on who was playing. Argentina, France, and Brazil drove three-figure spikes in their home and diaspora markets. The U.S. drove a 223% lift in its own market. Generic World Cup creative will underperform creative tied to specific teams and storylines.
Plan for elimination dropoffs. When a national team is knocked out, related app categories drop fast. Brazil's exit cut sports news installs by 29% the next day. Have a non-team-specific creative inventory ready to absorb spend when knockouts happen, and watch sessions, not just installs, as the early signal of audience interest fading.
Treat non-participating markets as a legitimate growth window. Mainland China saw iOS sports entertainment install growth above 1,150% across the November 22–24 window, per Adjust and Sensor Tower data, with no national team in the tournament. Italy went the other way: sports entertainment installs fell 35% with no team competing, but food delivery still rose 11% over the period and 63% on December 3. Demand is not a function of qualification alone.
The creative-velocity problem inside a 39-day window
The 2022 data tells you when engagement spikes. It does not tell you what to do when your top creative burns out by day 10 of a 39-day event.
Creative decay has accelerated. Reporting from Five Nine Strategy shows that Meta's Andromeda ranking weights creative signals harder, compressing a typical concept's lifespan from six weeks to two or three. Inside a tournament window, that means the creative you launched for the group stage is fatigued before the round of 16. The audience tires of the underlying pattern (the hook style, the visual treatment, the on-screen narrative) faster than they tire of the specific ad.
The teams that turn World Cup attention into installs are the ones that can do three things in days, not weeks:
Detect creative fatigue early. Track CTR week-over-week, frequency past 2.5, CPM creep, and completion-rate softening. When three of four trigger, the creative is fatiguing, per Triple Whale's fatigue framework.
Identify which elements are driving performance. Hook style, character, language, CTA copy, music, scene composition. The signal is at the element level, not the asset level.
Iterate on winning elements at production speed. New variants on the same proven hook or visual treatment, ready to ship within the matchday calendar.
This is a creative analytics problem, not a media-buying one. Bid optimisation and audience targeting are largely in the platform's hands now. The variable still under your control is the creative.
Second-screen behaviour reshapes the creative brief
Second-screen usage during the World Cup is now the rule, not the exception. Odeeo's analysis puts second-screen use at around 60% of fans during matches. Statista's data shows 51% of second-screen users are on social media during matches. For mobile-first markets and younger audiences, the phone is effectively the primary engagement layer.
What that means for the brief:
Sound-off creative still wins on second screens. The user is half-watching a match. Captions, on-screen text, and visual storytelling drive comprehension. Voiceover-only creative gets skipped.
First 1.5 seconds matter more than usual. Attention is split. Hook rate is the earliest health signal. Aim for 30% or higher on Meta, 33% on TikTok, per Benly's 2026 benchmarks.
Real-time context lifts relevance. Creative tied to a specific match, score, or moment outperforms generic event creative, per WARC's tentpole analysis.
The teams equipped to do this have unified visibility across ad networks and the ability to identify which creative elements are working in real time. Segwise's Creative Strategy Agent maps every tagged element (hook, character, CTA, audio cue, visual style) to performance metrics across all connected networks and MMPs (AppsFlyer, Adjust, Branch, Singular), so the next creative iteration is grounded in what just worked, not what worked last quarter.
Measurement: what to instrument before kickoff
A few measurement basics worth locking down before June 11.
Set baselines. Get a clean read on installs, sessions, CPI, CTR, completion rate, and ROAS for the 14 days pre-tournament. Without a baseline, lift numbers are noise.
Track at the creative-element level, not just creative-asset level. Two ads with the same hook style are not independent. If one fatigues, the other is on the same curve. Tag-level reporting catches this.
Watch sessions alongside installs. Installs are a peak-attention signal. Sessions are the indicator of sustained engagement and post-install value. The 2022 data shows sessions softening before installs in several markets, per Adjust.
Instrument by market and by national-team activity. A global aggregate hides everything that matters in this event. Country-level reporting is the working unit.
Plan post-elimination creative inventory. When teams drop out, the spend has to go somewhere. Have non-team-tied creative ready by group-stage close.
Conclusion
The 2022 FIFA World Cup taught app marketers that mobile behaviour reorganises fast around live global events, that the biggest install windows come earlier than most campaigns plan for, and that national-team narratives drive country-level spikes most playbooks underestimate. The 2026 tournament will amplify all three patterns with a longer schedule, more matches, and a record second-screen audience.
The brands most likely to convert the attention are not the ones spending the most. They are the ones that can read which creative elements are working in real time, refresh production against the matchday calendar, and shift inventory between teams and markets as the bracket evolves. That responsiveness depends on creative-level visibility across every connected ad network and MMP, with fatigue detection running on a creative-tagging foundation rather than on lagging ROAS signals.
If you are preparing measurement and creative workflows for the next six weeks, Segwise brings creative analytics, automated tagging, fatigue detection, and AI-driven creative generation into one platform, with integrations to Meta, Google, TikTok, Snapchat, YouTube, AppLovin, Unity Ads, Mintegral, IronSource, AppsFlyer, Adjust, Branch, and Singular.
Frequently asked questions
What were the biggest mobile app install spikes during the 2022 FIFA World Cup?
The largest spikes came on November 22, the second day of the tournament, when sports entertainment installs hit 189% above baseline and sports news installs hit 204%, per Adjust and Sensor Tower data. France's opening match drove sports news installs up 418% in Western markets, the highest single spike. Mainland China saw iOS sports entertainment install growth above 1,150% on the same date despite no national team in the tournament.
What does the 2022 World Cup data mean for app marketers planning 2026?
It means three things. First, the biggest install windows come in opening week, not the final. Second, national-team activity drives country-level spikes that often exceed 200% above baseline. Third, eliminations cause sharp dropoffs in related app categories, so non-team-tied creative inventory needs to be ready. Tools like Segwise help teams identify which creative elements are working in each market in real time, so iteration matches the matchday calendar.
How should app marketers handle creative fatigue during a 39-day tournament?
Track four signals together: CTR week-over-week, frequency past 2.5, CPM creep, and completion-rate softening. When three trigger, the creative is fatiguing. With Meta's Andromeda compressing creative lifespans to two or three weeks, fatigue cycles fall well inside the 39-day window. Segwise's fatigue tracking monitors these signals across Meta, Google, TikTok, Snapchat, YouTube, AppLovin, Unity Ads, Mintegral, and IronSource, with custom thresholds and Slack alerts.
What is the difference between sports entertainment and sports news installs during the World Cup?
Sports entertainment apps (streaming, live scores, fantasy) and sports news apps (match coverage, commentary, results) both spike around match days, but on slightly different curves. Sports news installs respond more sharply to opening matches and major fixtures, while sports entertainment installs sustain higher elevation across the opening week. Adjust's 2022 data showed sports news installs peaking at 204% above baseline on November 22, with sports entertainment installs at 189% on the same day.
Why do non-participating markets still generate massive World Cup app demand?
Tournament interest extends well beyond markets with qualifying teams. Mainland China recorded iOS sports entertainment install growth above 1,150% on November 22, 2022, with no national team competing, per Adjust and Sensor Tower data. Italy went the other way, with sports entertainment installs down 35% overall, but food delivery installs still rose 11% across the tournament and 63% on a single knockout-stage day. Match-driven behaviour shifts (food, streaming, social) operate independently of national-team participation.
How much will the 2026 FIFA World Cup add to global ad spend?
WARC projects the 2026 tournament will add $10.5 billion in incremental global ad spend, a 1.1% lift after inflation. Mobile is expected to capture a meaningful share given an estimated 6 billion people engaging across screens and 80.6% smartphone second-screen penetration in the U.S., per eMarketer.
What app categories see the biggest engagement lift during the World Cup?
Sports entertainment, sports news, and video streaming see the largest install spikes during opening week and national-team matches. Sports games, betting, food delivery, and shopping see smaller but more sustained lifts tied to match scheduling. EMEA tends to lead in betting and food delivery response, LATAM leads in shopping spikes around home-nation matches, and APAC shows the sharpest streaming surges during Asian-team fixtures, per Adjust's 2022 analysis.
How should I plan ad creative for second-screen World Cup viewing?
Plan for sound-off comprehension, fast hooks, and real-time context. Around 60% of fans use a second screen during matches, per Odeeo, and 51% are on social media, per Statista. Captions, on-screen text, and visual storytelling drive comprehension. Target hook rates above 30% on Meta and 33% on TikTok, per Benly's 2026 benchmarks. Tying creative to specific matches, scores, or moments outperforms generic event creative.
