
Your CPI rises when one of three numbers moves: the price of impressions (CPM), the share of viewers who tap (CTR), or the share of tappers who install (install rate). Compare the last 7 days with your 28-day baseline, per network and platform, find the number that moved, and fix that one first.
When CTR is the number that moved, the fix is usually creative, but which part of the ad to change is rarely obvious. Segwise is an AI creative analytics and creative generation platform that tags each hook, scene, mechanic and end card in your game ads, including playables, and maps them to CPI and IPM on every network you run, so you can see which elements earn cheaper installs and get a fatigue alert before CPI rises.
Most advice on lowering CPI is a list of creative tips. Tips help, but only if creative is the problem. A CPI rise caused by a broken postback, a Q4 auction or a shift in network mix will not move when you ship a new hook. This guide starts with the diagnosis, then gives the fix for each of the seven usual causes, using the ad networks' own documentation. For the wider picture of where AI fits in game UA, see our 2026 mobile game marketing playbook.
TL;DR
- If CTR fell on ads that have run for weeks: creative fatigue. Launch a clearly different concept and keep the old ad running while the new one learns.
- If CPM rose on every network at once: seasonality or auction pressure. Hold your targets, compare year on year, and save fresh creative for the cheaper weeks after Christmas.
- If clicks held but installs fell: your store page or the match between ad and store page. Test the page, and send ad traffic to a custom page that shows what the ad promised.
- If blended CPI rose but each network looks flat: your spend mix shifted toward pricier networks, platforms or countries.
- If installs dropped in your MMP but not in the network, or the other way round: check tracking before you change anything else.
- If you only care about the cheapest install: don't. Judge every fix on cost per retained player or early ROAS, not CPI alone.
What makes up CPI? The formula that tells you where to look
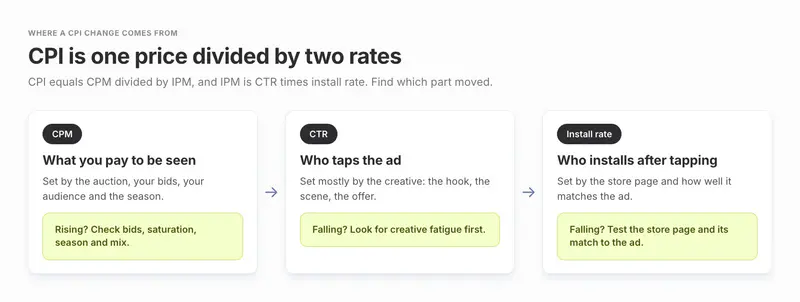
Cost per install (CPI) is spend divided by installs. That number alone can't tell you why it changed, so break it into the three numbers that produce it:
- CPM: what you pay for 1,000 impressions. Set by the auction, your bids, your audience and the season.
- CTR (click-through rate): the share of people who see the ad and tap it. Mostly set by the creative.
- Install rate: the share of people who tap and then install. Mostly set by the store page and by how well it matches the ad.
Multiply CTR by install rate and by 1,000 and you get IPM, installs per 1,000 impressions. CPI is then simply CPM divided by IPM.
Here is what that means in money. These numbers are an illustration, not a benchmark:
| Scenario | CPM | CTR | Install rate | IPM | CPI |
|---|---|---|---|---|---|
| Starting point | $12.00 | 1.0% | 25% | 2.5 | $4.80 |
| Creative fatigue: CTR falls a fifth | $12.00 | 0.8% | 25% | 2.0 | $6.00 |
| Auction pressure: CPM rises 15% | $13.80 | 1.0% | 25% | 2.5 | $5.52 |
| Store page problem: install rate falls a fifth | $12.00 | 1.0% | 20% | 2.0 | $6.00 |
Two lessons come out of this table. First, a 20% drop in CTR raises CPI by 25%, not 20%, because the change sits underneath a division. Second, very different problems can produce the same CPI. Fatigue and a broken store page both land on $6.00 here, but the fixes have nothing in common. That is why you diagnose before you act.
How to find out why your CPI is going up, in five steps
Work through these in order. Each step rules out a cause that would make the later steps misleading.
Step 1: Check tracking first
Compare installs in your MMP (AppsFlyer, Adjust, Branch, Singular or Kochava) with installs in each network's own reporting for the same days. If one source dropped and the other did not, you have a measurement problem, not a cost problem. Also check whether an SDK release, a changed attribution window or a new postback setup went live around the time CPI jumped.
Step 2: Split the blended number
Break CPI out by network, platform (iOS and Android) and country tier. If each slice is flat and only the blend rose, your spend mix changed.
Step 3: Find the number that moved
For the slice that got worse, compare CPM, CTR and install rate for the last 7 days with the previous 28. Usually one of the three explains most of the change.
Step 4: Check what you changed
Look for bid or budget edits, new ad sets or new targets in the same window. On Meta, editing during the learning phase resets learning, and ad sets in learning "usually have a higher CPA".
Step 5: Check the calendar
If the rise hit every network in the same week of November or December, compare with the same weeks last year before you call it a problem.

Which number moved, and what it points to
Once you know which number moved, this table points to the likely cause:
| What you see | Likely cause | First check | First fix |
|---|---|---|---|
| CTR falling on older ads, impressions per person rising | Creative fatigue | Meta delivery status, Google asset labels, ad age | New, clearly different concept |
| CPM rising in one network, reach flat | Audience saturation | Frequency, overlapping ad sets | Broaden audience, combine ad sets |
| CPM or CPI rising right after an edit | Bids and learning | Last significant edit, bid target history | Smaller changes, wait for enough conversions |
| CPM rising on every network at once | Seasonality | Same weeks last year | Hold targets, plan for the cheaper weeks |
| CTR steady, install rate falling | Store page conversion | Store listing changes, rating, ad to store match | Store page tests, custom product pages |
| Blended CPI up, each channel flat | Network and geo mix | Spend share by network, platform, country | Rebalance budget by retained-player cost |
| MMP and network installs disagree | Tracking change | SDK, postbacks, attribution settings | Fix measurement before optimising |
The seven causes of rising CPI, and how to fix each one
1. Creative fatigue
Fatigue is worth ruling out early whenever the same few ads have carried your spend for weeks. Meta defines it plainly: creative fatigue happens when "an audience has seen the same creative too many times", which can lead to a higher cost per result.
How to spot it. CTR and IPM slide on ads that have been live for weeks, while newer ads hold up. The networks will often tell you directly:
- Meta shows a "Creative limited" status when an ad's cost per result is above your past ads but under twice as much, and "Creative fatigue" once it reaches twice as much. This only works for ad sets with one creative, so many game advertisers will not see it.
- Google App campaigns label each asset in the asset report, from "Low" to "Best". Google's advice is to replace assets ranked "Low" when you have used all your slots, and to "do so gradually to minimize performance fluctuations."
- Unity'sAttention status is not a fatigue signal. It means a creative pack "seems to be accumulating impressions quite slowly", and Unity says this "is not necessarily negative". So on Unity, watch IPM and CPI for each creative pack over time yourself.
How to fix it.
- Launch a concept that is clearly new, not a recolour. Meta's own guidance is to use an image or video that is "materially different from the original creative" and notes that keeping the original running may get you more results.
- Refresh winners in small steps as well. Unity's guide to preventing creative fatigue recommends "incremental modifications" to top performers and adding new creatives every 3 days until you reach 30.
- Fill every format slot. Google allows up to 10 text, 20 image and 20 video assets per ad group in App campaigns, plus 20 HTML5 or playable assets for mobile game marketers, and recommends using all the slots. AppLovin tells advertisers to mix video, playable and static assets. On Mintegral, build each creative set with a video, an image and a playable together, since the Playturbo guide to Mintegral creatives counts that combination as one ad.
For the full playbook on spotting and managing fatigue, see our guide to creative fatigue.
Catch fatigue on every network: Segwise lets you set your own fatigue rule and get an email or Slack alert when an ad crosses it, on AppLovin, Unity, Meta and the other networks you run. Start a free trial.
2. Audience saturation
Saturation looks like fatigue but sits in the audience rather than the ad. The network has already shown your ads to the cheapest people who are likely to install, and the next group costs more. Meta says this outright in its guide to performance fluctuations: the system "seeks the highest volume opportunities first", and when those lower-cost opportunities run out it may move on to more expensive ones.
You also compete with yourself. When several of your ad sets target overlapping people, Meta lets only your highest-value ad into each auction. Meta's page on auction overlap warns that this can stop an ad set from spending its budget or leaving the learning phase.
What to do. Broaden targeting instead of stacking narrow ad sets, combine similar ad sets, and add new countries or platforms. New creative concepts help here too, because a different hook reaches a different group of players inside the same broad audience.
3. Bids, budgets and the learning phase
Before blaming the market, check your own recent changes. Meta says significant edits send an ad set back into learning, where it usually has a higher CPA, and Google says App campaigns need to collect data again whenever you give them new guidance on your goals.
The networks publish their own thresholds:
| Network | What its documentation says |
|---|---|
| Meta | An ad set leaves learning after about 50 results in the week after its last significant edit. Frequent budget changes can restart learning. |
| Google App campaigns | Set a daily budget of at least 50 times your target CPI. Avoid changing budget or target CPI by more than 20%, and wait for at least 100 conversions before the next bid change. |
| AppLovin (Axon) | Budget for at least 15 to 20 conversions a day. Unrealistic goals "may prevent the campaign from spending or scaling effectively." |
| Unity | For automated CPI bidding, use at least a $50 daily cap, a $500 budget and a one-week run, with a separate campaign for each country tier. |
The sources are Meta's learning phase page, Google's App campaign tips and bid change guide, AppLovin's scaling guide and Unity's CPI bidding best practices.
Google also warns that in the first few days, or even weeks, of a campaign "the CPI may be inflated." So a new campaign with a high CPI is often just young.
One more trap: if you moved a campaign from install optimisation to an in-app event or ROAS goal, a higher CPI is expected. The network is now paying more for fewer, better players. Judge that change on cost per payer or ROAS.
The fix. Make bid and budget changes in steps of 20% or less, leave a few days between them, and stop splitting budget across so many ad sets that none of them reach the conversion volume the network needs.
4. Seasonality
Some weeks cost more for everyone. Liftoff's analysis of the post-holiday period says the holiday season "sees higher acquisition and reengagement costs across nearly every vertical." The weeks after Christmas then bring lower costs and more inventory. In Liftoff's data, puzzle game CPMs had fallen to nearly half their December high by mid-January.
What to do instead. Don't fight the season with bid cuts that starve learning. Compare with the same weeks last year, accept a higher CPI on your proven campaigns, and save new launches and big creative tests for late December and January, when the same budget buys more.
5. Store page conversion
If CTR held and installs fell, the problem is between the tap and the install. Common causes are a new icon or screenshot set, a drop in rating, a competitor ranking above you in search, or an ad that promises something the store page doesn't show.
Both stores give you tools to fix this:
- Apple lets you run product page optimization tests with up to three alternate versions of your icon, screenshots and app previews, for up to 90 days. It also lets you publish up to 70 custom product pages, each with its own URL. Apple reports that developers see a 2.5 percentage point lift in conversion on average when they send people to a custom product page, against a 1.6% average on default pages.
- Google Play offers store listing experiments for your icon, feature graphic and screenshots, and up to 50 custom store listings, which you can show to users arriving from a specific Google Ads campaign.
How to fix the page. Match the store page to the ad. If your best-performing ad for a racing game shows drifting through a neon city, the first screenshot on the page that ad sends people to should show the same thing.
6. Network, platform and country mix
Blended CPI can rise even when no single channel gets more expensive. Here is a simple example, with made-up numbers:
| Network A spend | Network A CPI | Network B spend | Network B CPI | Total installs | Blended CPI | |
|---|---|---|---|---|---|---|
| Month 1 | $60,000 | $2.00 | $40,000 | $4.00 | 40,000 | $2.50 |
| Month 2 | $40,000 | $2.00 | $60,000 | $4.00 | 35,000 | $2.86 |
Neither network changed price, yet blended CPI rose 14% because budget moved toward the pricier one. The same thing happens when spend moves from Android to iOS, or from cheaper countries to the US. Platform differences are large: Liftoff's 2025 casual games report says simulation, action and racing games see about 10 times higher CPIs on iOS than on Android.
How to correct for it. Report CPI by network, platform and country tier every week, never only as a blend. Unity's advice to run a separate campaign for each country tier applies to every network. Then decide where the next dollar goes based on what each retained player costs, not on which slice has the lowest CPI.
7. Tracking and attribution changes
Sometimes CPI didn't really go up. Your measurement changed. On iOS, SKAdNetwork postbacks arrive after a random delay, which Adjust's guide to how SKAdNetwork 4 works puts at 24 to 48 hours for the first postback. Small campaigns also fall into lower privacy tiers that return less detail. So the last two days on iOS usually look worse than they will once data settles.
Broken tracking can also hurt real performance. AppLovin's documentation says advertisers should pass all installs and opens to the network, and that "it has a negative effect on future campaigns if AppLovin does not receive conversions on impressions and clicks." A network that stops seeing installs stops learning who your players are.
What to check. Leave a two-day buffer before judging iOS results. After every SDK release or MMP change, compare MMP and network install counts. If they suddenly drift apart, fix the setup before you touch bids or creative.
What is a good CPI for mobile games in 2026?
There is no single good CPI. It depends on genre, platform and country. Liftoff's data for casual games from February 2024 to February 2025, as charted by Statista, put the average iOS CPI at $1.41 against an overall Android average of 14 cents, with the widest platform gap in casino games.
Use benchmarks to sense-check a market you are about to enter. Use your own trend to judge whether things are getting worse. For CPI, IPM and ROAS ranges by network and country, see our CPI, IPM and ROAS benchmarks and mobile game ROAS benchmarks by country and ad network.
How do you lower CPI without hurting player quality?
Cheap installs are easy to buy and expensive to keep. A misleading ad, a broad country push or a low-quality placement can cut CPI while filling your game with players who leave on day one.
The fix is to judge every change on cost per retained player: CPI divided by your D7 retention rate. Again, an illustration:
| Option | CPI | D7 retention | Cost per D7 retained player |
|---|---|---|---|
| Cheaper installs | $2.00 | 10% | $20.00 |
| Pricier installs | $2.50 | 15% | $16.67 |
The pricier option is the better buy. If your game earns most of its money from purchases, use D7 ROAS or cost per payer instead. For ad-funded games, use early ad revenue per player.
Three rules keep quality intact while you push CPI down:
- Show the real game. An ad that fakes the gameplay can win on CTR and lose on retention and reviews.
- Optimise for the event you value. Most networks will bid on an in-app event or ROAS goal instead of the install. Your CPI goes up, but your players are worth more.
- Cut placements and countries on retained-player cost. A placement can look cheap on CPI and still be the worst buy in the account.
How can game studios acquire more players without increasing ad spend?
With a fixed budget, installs equal spend divided by CPI. A $50,000 month at a $2.50 CPI buys 20,000 installs. Bring CPI to $2.00 and the same budget buys 25,000, a quarter more players for the same money.
The levers that do this without new spend are the ones that raise IPM or install rate:
- Better creative. A stronger hook lifts CTR, which lifts IPM directly.
- Better store pages. Custom product pages and custom store listings raise install rate for the traffic you already pay for.
- Localisation. AppLovin recommends translated ads or local subtitles for non-English countries "for better conversion rates."
- Smarter mix. Move budget from the slices where retained players cost most to where they cost least.
- Timing. Shift test budget into the cheaper weeks after the holidays.
A decision rule: which fix comes first?
These thresholds are rules of thumb from how the networks describe learning and fatigue. They are not platform rules, so tune them to your own volume.
| If this is true | Do this first |
|---|---|
| CPI is up less than 10% week on week, and you made an edit in the last 7 days | Wait. You are probably still in learning. |
| Meta shows "Creative fatigue" (cost per result at least twice your past ads) | Replace the creative now with a clearly new concept. |
| CTR is down 15% or more on ads older than 3 weeks, and newer ads are holding | Creative refresh before any bid change. |
| CPM is up on 3 or more networks together in November or December | Seasonality. Hold targets and compare year on year. |
| Install rate is down 10% or more on every network at once | Store page. Check recent listing changes and ratings. |
| Blended CPI is up, but each network and platform is within 5% of last month | Mix. Rebalance toward the cheapest retained players. |
| MMP and network install counts suddenly differ by more than they usually do | Tracking. Fix it before anything else. |
If two rows are true, fix tracking first, then creative, then bids. Tracking problems poison every other number, and creative is usually the cheapest lever to pull.
What tools help reduce CPI for mobile games?
You probably have most of what you need already. Here is what each type of tool does for CPI:
| Job | Tools | What they tell you |
|---|---|---|
| Spot fatigue and learning issues inside one network | Meta delivery statuses, Google App campaign asset labels | Which ads Meta flags as fatigued, and which assets Google ranks as Low |
| Measure player quality across networks | Your MMP: AppsFlyer, Adjust, Branch, Singular or Kochava | Installs, retention and revenue by network, campaign and creative |
| Tag creative elements inside your MMP | MMP creative add-ons such as AppsFlyer Creative Optimization and Singular Creative IQ | AI tags for video and image ads, tied to that MMP's performance data |
| Raise store install rate | Apple product page optimization and custom product pages, Google Play store listing experiments and custom store listings | Which icon, screenshots and page version convert best |
| Tag every format across any MMP, get fatigue alerts and build replacements | A creative analytics and generation platform such as Segwise | Which hooks, scenes, mechanics and end cards earn the lowest CPI, including inside playables, which ads are fatiguing, and new variants built from your winners |
MMP creative add-ons: AppsFlyer Creative Optimization and Singular Creative IQ
Network tools only see their own network. Your MMP sees every network, and AppsFlyer and Singular sell creative add-ons that tag what is inside an ad. AppsFlyer Creative Optimization breaks creatives into "scenes, text, visuals, and audio components", and Singular Creative IQ has "17 out-of-the-box AI tags" for video and image ads. Both are sold as separate packages on top of the MMP. AppsFlyer's runs on AppsFlyer attribution data, and Singular notes that customers who use it only for analytics may not see ROI per creative.
When an MMP add-on is enough, and when to add a creative platform
When an MMP add-on is enough: you already measure with AppsFlyer or Singular, your spend is mostly video and static ads, and your team mainly needs to see which elements perform. When a separate creative platform is worth adding: you use another MMP (or none), playables carry real spend, or you want new ads generated from your winners in the same tool. Neither add-on documents AI tagging inside playables or generating new ads. Segwise plays and tags playables, works with any of the five MMPs or none, and its Creative Generation Agent builds new variants from the elements that win.
Where Segwise helps lower CPI: the creative side
Segwise works on the creative causes above: fatigue, weak hooks and the shortage of fresh ads. It connects to the networks games actually buy on, including AppLovin (Axon), Unity, Mintegral, Moloco, Meta, Google Ads and TikTok, plus any of five MMPs (AppsFlyer, Adjust, Branch, Singular and Kochava), and an MMP is optional. Setup is no-code: some networks sign in with OAuth, while AppLovin, Mintegral, Unity and Moloco ask you to paste an API key from the network's dashboard. Here is how it helps on CPI.
Element-level analysis across networks
Segwise's AI watches, listens to and plays every ad, including playables, and tags each element: the hook, the opening scene, the core mechanic, the end card, the CTA. It then maps each tag to CPI, IPM, CTR and ROAS across every connected network. So instead of knowing only that one ad is cheap on Unity, you can see whether a type of hook, such as a near-miss moment or a logo-first intro, earns cheaper installs across every network you run.

Fatigue alerts before CPI climbs
You set the rule in Fatigue Tracking, for example a 20% ROAS decline over 7 days, and Segwise watches every creative on every network. When an ad crosses it, you get an email or Slack alert, per network or across all of them.

Tip: When an alert fires, check the other networks before you kill the ad. A concept that is tired on one network can still be fresh on another, so refresh it where it is fading and let it keep running where it works.
Pre-flight scoring before you spend
Upload up to 10 new images or short videos to Pre-flight Testing and Segwise scores each one out of 100 against the ads already winning in your account. You get a run-or-hold verdict with reasons, plus a check of which network placements each file fits. It does not fix a weak draft for you, and it needs at least one connected ad network to compare against.

New ad variants from your winners
The Creative Generation Agent lets you make statics and videos up to 30 seconds, including AI UGC-style ads, from your own winning patterns, for your team to review and edit. Playables are built as a managed service, where the Segwise team finishes and delivers each one. For more on how this works, read our guide to generating ads from your winning patterns.
You can use each agent on its own, or do it all in one place by chatting with the Segwise agent: ask how your ads are performing, see what competitors are running, and make new ads from your winners.
In customer-reported results, WGT cut its early concept-to-test cycle from 2 to 3 weeks to 2 to 3 days, and Whow Games produces four static variants per concept across every channel in a few hours.
What Segwise doesn't do for CPI
It doesn't change your bids, fix your store page or repair your tracking. Its competitor tracking reads the Meta (Facebook and Instagram), TikTok, LinkedIn and Google ad libraries. If your CPI problem is mix, seasonality or measurement, the steps earlier in this guide are where to start.
Segwise starts at $499/month for advertisers spending up to $250K/month, with a special 50% discount for startups spending under $50K/month, and includes a 7-day free trial. The trial imports 14 days of history, and paid plans import 3 months.
How to start lowering your CPI this week
Your CPI rises when CPM, CTR or install rate moves, so the real work is finding which one. Rule out tracking first, split the blended figure by network, platform and country, and fix only the number that moved. When creative is the cause, ship a clearly different concept and leave the old ad running while the new one learns. Judge every fix on cost per retained player rather than CPI alone, and begin by comparing your last 7 days with your 28-day baseline.