
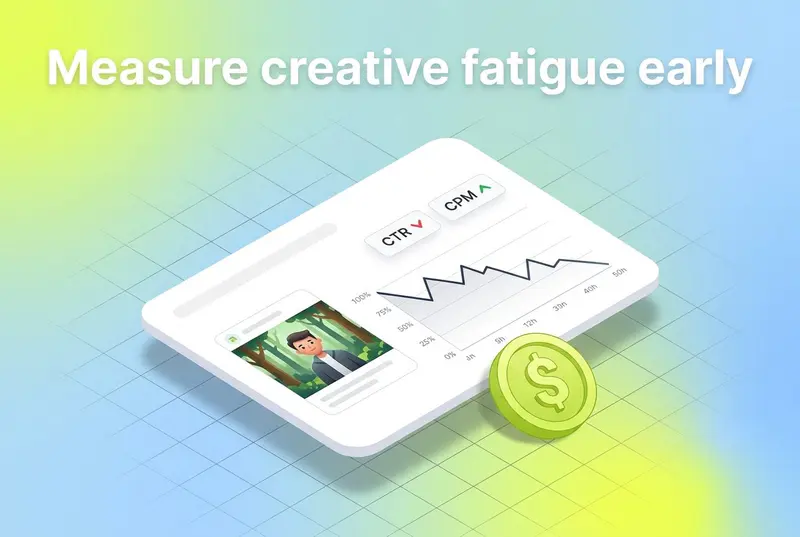
Segwise is an AI creative-analytics platform that auto-tags every ad element across 15+ networks and flags creative fatigue automatically, so you catch a fading creative before it burns budget.
To measure ad fatigue, track three things per creative over a rolling 7-day window against its own 30-day baseline: an attention metric (CTR or hook rate), a cost metric (CPM), and frequency. Creative fatigue is confirmed when you see two or more consecutive days of decline across two or more of those metrics, typically a CTR drop of 15% or more, a CPM rise above roughly 18%, and frequency climbing past 2.5 on cold audiences. The reliable way to do this at scale is automated fatigue detection with thresholds you set yourself, which is what Segwise does across every network you run.
That is the short answer. The rest of this guide turns it into a workflow you can actually run: which metrics to watch, the thresholds and formulas that flag decline early, and how to monitor all of it across hundreds of creatives without living in a spreadsheet.
Most teams find out a creative has fatigued the same way: ROAS drops, someone notices, and the post-mortem starts. By then the budget is already gone. The whole point of measuring fatigue is to catch the decline in the leading indicators, attention and cost, days before it shows up in revenue. So this is less about defining fatigue and more about measuring it precisely enough to act early.
Key takeaways
- Measure fatigue per creative on a rolling 7-day window compared to that creative's own 30-day baseline, not against account-wide averages.
- Watch three signal types together: attention (CTR, hook rate), cost (CPM, CPA), and exposure (frequency). One metric in isolation lies.
- Common industry thresholds for action are a CTR decline of 15% or more week over week, a CPM rise above 18% over two weeks, and frequency climbing past 2.5 on cold audiences.
- A simple decay score weights each metric's decline into one number between 0 and 1, so you can rank every creative by how fatigued it is.
- Creatives fatigue faster than they used to. Concepts that lasted six weeks now burn through an audience in two or three under newer Meta ranking systems.
- Manual measurement does not scale past a few hundred creatives. Segwise runs automated fatigue detection with custom thresholds across all your platforms and alerts you before performance crashes.
What you are actually measuring
Creative fatigue is the gradual decline in a creative's performance as your audience sees it too many times. The ad has not changed. The audience has stopped responding. Your job when measuring it is to separate that signal from normal day-to-day noise and from problems that look like fatigue but are not, like a landing page break or a tracking issue.
Three things make fatigue measurable:
- It shows up first in attention metrics, then in cost, then in conversion and revenue. Attention leads because the audience disengages before the auction reprices your ad and well before the install or purchase numbers move.
- It is gradual and directional, not a one-day blip. A single bad day is variance. A sustained multi-day slide across more than one metric is fatigue.
- It is relative to the creative's own history. A 1.2% CTR is healthy for one creative and a crisis for another. You measure each creative against its own baseline, never against an account average.
That last point is where most measurement goes wrong. Account-wide ROAS or a blended CTR hides everything. The fatigue is happening inside the average, to specific creatives, and the average smooths it out until it is too late.
The metrics that signal fatigue
You are reading three families of metrics together. Each one catches fatigue at a different stage.
Attention metrics (the earliest signal)
- CTR is the workhorse. It moves first because clicking is the audience's most direct vote on whether the creative still earns interest. A falling CTR with everything else held constant is the cleanest early fatigue signal you have.
- Hook rate (the share of impressions still watching after 3 seconds) is the video equivalent and even earlier. When people who used to watch start scrolling past, hook rate drops before CTR does.
- Hold rate or completion rate tells you whether the creative keeps the attention it earns. A hook rate that holds steady while hold rate slides means the opening still works but the body has gone stale.
Cost metrics (the auction's verdict)
- CPM rises when the platform's ranking system decides your creative is less relevant to the people it is showing. A CPM increase above 18% over a two-week window, with no audience or placement change, is a meaningful fatigue signal. A sudden 50 to 100% CPM jump while CTR stays flat usually means an algorithmic relevance penalty.
- CPA and CPI rise as the same spend buys fewer outcomes. These are lagging but they are the ones that hurt, so they confirm what the leading metrics predicted.
Exposure metrics (the cause)
- Frequency is the root cause, so it is both a predictor and an explanation. On Meta prospecting, performance tends to decline once frequency passes 2.5 on cold audiences, and falls off sharply past 4. Retargeting tolerates more because intent already exists. Frequency on its own does not prove fatigue, but rising frequency alongside falling CTR is close to a confirmation.
- Spend-share drop is a useful tell inside a campaign. When a creative loses more than 20% of its budget share without any manual change, the platform's own optimization has already decided it is fatiguing.
The rule across all three: no single metric is proof. CTR can dip for a hundred reasons. Frequency can climb on a small audience without fatigue. What confirms fatigue is correlated decline, two or more of these moving the wrong way at the same time over several days.

Thresholds: when a dip becomes fatigue
Thresholds turn vague decline into a decision. The numbers below are common industry norms, not platform guarantees, and you should tune them to your own data. They are a sane starting point, not gospel.
A widely used tiered framework from Triple Whale sorts creatives into three actions:
- Watch: 10 to 15% decline in one or two metrics, still above the 30-day baseline. Keep running, prep a backup.
- Refresh: 20 to 30% decline across two or more metrics, now below baseline. Cut spend roughly in half and ship a variation.
- Replace: CTR down 40% or more, costs roughly doubled. The creative is done. Kill it.
The window matters as much as the percentage. A practical default is to flag any creative with two or more consecutive decline days across two or more metrics in a 7-day window, measured against its 30-day baseline. The consecutive-day rule filters out single-day noise, and the two-metric rule filters out false alarms from any one number.
One caveat worth building in: newer ranking systems compress these timelines. Concepts that used to last six weeks now burn through their audience in two or three, so a threshold tuned to last year's decay speed will fire too late this year. Re-baseline your thresholds every quarter.
A simple formula for a fatigue score
Tiers are easy to read but coarse. If you want to rank every creative by how fatigued it is, compute a single decay score.
The approach, adapted from a decay-rate method James Williams outlined on Medium, works like this:
- For each metric, compute a decay ratio of current value to baseline value. If baseline CTR was 2.0% and current is 1.4%, the ratio is 0.70, a 30% decline. For cost metrics where higher is worse, invert it: baseline CPM $15, current $20, ratio 0.75.
- Weight each ratio by how predictive it is. A reasonable starting split is CTR 30%, conversion rate 30%, CPM 20%, CPA 20%.
- Multiply each ratio by its weight and sum them into a composite score between 0 and 1.
Then read the score:
- Above 0.85: healthy, keep scaling.
- 0.70 to 0.85: early fatigue, prep a replacement now.
- Below 0.70: active fatigue, refresh or replace.
The formula is not magic. It just forces you to look at several metrics at once, weighted by what actually predicts decline, instead of reacting to whichever number you happened to glance at. Tune the weights to your own historical data over time.

How to measure fatigue across every creative
The math above is simple for one creative. The problem is you do not have one creative. You have hundreds, across Meta, TikTok, Google, and more, each reporting metrics differently, each on its own baseline. Measuring fatigue by hand means pulling exports from every network, normalizing the metrics, building baselines, computing decay, and doing it again tomorrow. That is where fatigue measurement quietly dies. Most teams set it up once, then stop.
This is the gap automated fatigue detection closes. Segwise monitors every creative across all your platforms for the exact patterns described above, continuous performance decline and spend-share drop, and flags fatigue before performance tanks rather than after. It works because it is built on unified data: Segwise connects to 15+ ad networks including Meta, Google, TikTok, Snapchat, YouTube, AppLovin, Unity Ads, Mintegral, and IronSource, alongside MMPs AppsFlyer, Adjust, Branch, and Singular, so the baselines and decay calculations run on one consistent dataset instead of a pile of mismatched exports.
The part that matters most for measurement is that the thresholds are yours. Segwise lets you configure custom fatigue criteria around your own business logic, for example a 20% ROAS decline over 7 days, rather than forcing a generic rule on every account. The early warning system then alerts you by email or Slack the moment a creative crosses your line, so you catch decline early enough to act. Because the same multimodal AI tags every creative element, you can also see fatigue by element, which hook styles or formats are decaying fastest across the account, not just which individual ads.
Putting it into a workflow
Here is a measurement routine you can run weekly without it eating your week.
- Set baselines per creative. Use a 30-day rolling average for CTR, CPM, frequency, and your real outcome metric (ROAS or CPI through your MMP). Each creative is measured against itself.
- Define your thresholds. Start from the tiers above, then tune them to your decay speed. Write them down so the rule is the same every week.
- Score on a rolling 7-day window. Compute decline versus baseline. Flag anything with two-plus consecutive decline days across two-plus metrics, or a decay score under 0.85.
- Confirm it is fatigue, not a fault. Before you cut, rule out a broken landing page, a tracking gap, or a seasonal dip that hit the whole account. Fatigue is creative-specific.
- Act by tier and feed it back. Watch, refresh, or replace. Then note which elements fatigued, so your next brief avoids repeating them.
The only hard part is doing steps one and three for hundreds of creatives every week. That is the part to automate.
Conclusion
Measuring creative fatigue comes down to one discipline: track attention, cost, and exposure per creative, against each creative's own baseline, on a rolling window, and act when two or more move the wrong way together. The thresholds and the decay formula are just ways to make that judgment consistent instead of vibes-based. Get the measurement right and you stop discovering fatigue in the ROAS report, which is the most expensive place to discover it.
The reason most teams never measure fatigue properly is not that the metrics are hard. It is that doing it across every creative and every network by hand does not scale, so it gets abandoned. That is exactly what automated detection is for. If you want fatigue measured continuously against thresholds you control, Segwise unifies your creative data across 15+ networks and MMPs, runs fatigue detection on your custom criteria, and alerts you early, helping teams cut wasted spend and improve ROAS by up to 50%. For the bigger picture on causes and fixes, start with our ad creative fatigue guide and the primer on what ad creative fatigue is.
Frequently asked questions
How do you measure ad creative fatigue?
Measure it per creative on a rolling 7-day window against that creative's own 30-day baseline, tracking three signal types together: attention (CTR or hook rate), cost (CPM and CPA), and exposure (frequency). Fatigue is confirmed when two or more of those metrics decline together over two or more consecutive days, rather than any single number dipping once. Platforms like Segwise automate this by monitoring every creative across all networks against custom thresholds you set and alerting you when one crosses the line.
What is a good frequency threshold for creative fatigue?
As an industry norm, performance on cold prospecting audiences tends to start declining once weekly frequency passes 2.5 and falls off sharply past 4. Retargeting audiences tolerate higher frequency, often 4 to 6, because intent is already established. Treat these as starting points, not fixed rules, and tune them to your own audience size and decay speed, since frequency alone does not prove fatigue without a matching drop in attention metrics.
What CTR drop indicates creative fatigue?
A week-over-week CTR decline of 10 to 15% warrants attention, a 20 to 30% drop across multiple metrics usually means it is time to refresh, and a 40%-plus drop with roughly doubled costs means replace. Always read CTR alongside CPM and frequency, because a CTR dip on its own can come from many causes unrelated to fatigue.
How is creative fatigue different from a normal performance dip?
A normal dip is a one-day blip driven by variance, a weekend, or an external event that affects the whole account. Fatigue is gradual, sustained over several days, specific to individual creatives, and visible across more than one metric at once. The practical test is the consecutive-day, multi-metric rule: if a single creative shows two or more decline days across two or more metrics versus its baseline, it is fatigue, not noise.
Can you measure creative fatigue automatically?
Yes, and at any real scale you have to. Manual measurement breaks down past a few hundred creatives because each network reports differently and baselines must be recomputed daily. Segwise runs automated fatigue detection across 15+ ad networks and MMPs, monitoring every creative for continuous decline and spend-share drop against custom fatigue criteria you configure, then alerting you by email or Slack before performance crashes.
How often should I check for creative fatigue?
Set up continuous monitoring and review flagged creatives weekly. Fatigue develops over days, not hours, so daily firefighting is unnecessary, but waiting a full month lets winners decay unnoticed. A weekly review of automatically flagged creatives, backed by alerts that fire the moment a threshold is crossed, catches decline early without turning measurement into a daily chore.