Creative Tag Analytics Framework: Variables That Drove ROAS to 3.1x (2026)
A creative tag analytics framework reads ad performance at the element level instead of the ad level. It breaks every creative into 30 measurable variables, from hook format and hook duration to CTA and audio, then maps each one to the metric it actually moves. For performance marketers, that shift turns "which ad won" into "which element won, and will win again," which is the difference between rediscovering luck and engineering it.
Most teams still read creative the wrong way. They open Ads Manager, sort by ROAS, pause the bottom, scale the top, and call it analysis. The problem is that the ad ID tells you nothing about why it won. Two ads can share the same ROAS for completely different reasons, and the winner you scale today can carry a hook that is already fatiguing.
Creative is worth reading this carefully because it is the single biggest lever you have. According to a Nielsen analysis of nearly 500 campaigns, creative quality drove 47% of incremental sales, more than reach, brand, and targeting combined. Meta's own research puts the figure even higher for digital, where creative accounts for 56% of sales lift. If creative is half your result, reading it at the ad level is leaving most of the signal on the table.
This guide gives you the full 30-variable reading framework, a worked decomposition that shows how one account moved from 0.9x to 3.1x ROAS, and a 7-day plan to implement it on your own account. The angle here is deliberately post-launch. This is not a pre-launch creative score and not a volume playbook. It is how you read the ads you already have running, and turn that read into your next brief.
Also read Why Your Meta Ads Can't Scale: Break the Creative Production Cycle Trap
Key Takeaways
A creative tag analytics framework measures performance by element, not by ad ID, so wins become reproducible instead of accidental.
Creative is the biggest driver of sales, contributing 47% of incremental sales in Nielsen's analysis and 56% of digital sales lift in Meta's research.
The 30 variables group into seven readable layers: hook, message, structure, visual, audio, CTA and offer, and delivery context.
Each variable maps to a specific metric. Hook variables move hook rate, structure and audio move hold rate, message and CTA move CTR and CVR.
Hook rate is 3-second video plays divided by impressions. Hold rate is ThruPlays divided by 3-second plays. You read them together.
Manual tagging holds up to roughly 100 active creatives before consistency drifts. Past that, auto-tagging is what keeps the read reliable.
An element earns systematic replication once it has driven above 2x average ROAS across 10 or more ads, not after one lucky winner.
Why ad-level reporting hides the real signal
Platform reporting is built to optimize delivery, not to explain creative. Meta, TikTok, and Google show you outcomes, not causes. You see that one ad returned 3.2x and another returned 0.8x, and you are left guessing whether the hook, the angle, the color, the CTA, or some combination drove the gap.
That gap is expensive in three ways. First, knowledge gets lost. When you test 50 variations a month and a campaign manager leaves, the institutional memory of what worked walks out the door. Second, learnings stay siloed by platform, so a winning Meta hook never gets transferred to TikTok. Third, fatigue arrives without warning, because nobody is watching performance at the pattern level.
Tagging fixes all three by giving every creative a consistent set of labels. Once your ads carry the same tags, you stop comparing individual ads and start comparing cohorts. All question hooks versus all statistic hooks. All creator voiceovers versus all music-only edits. That is when the real signal surfaces.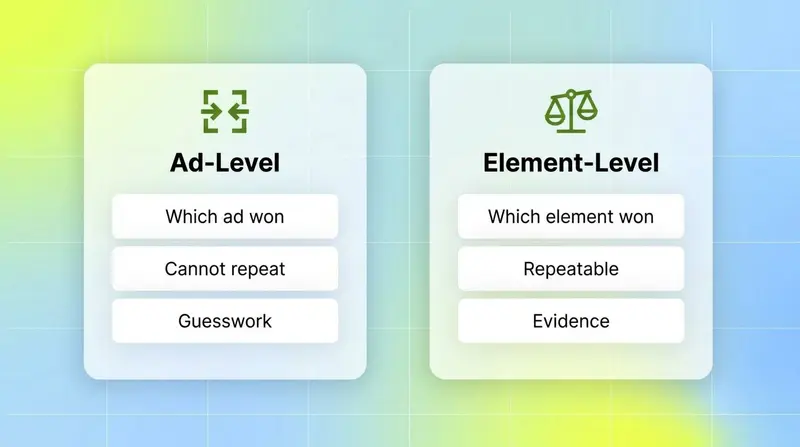
The 30-variable reading framework
Here is the full list. Think of it as seven layers stacked from the first frame to the final click. Each variable answers a strategic question and maps to the metric it most directly influences. This is the artifact to copy into your own tagging sheet.
Layer 1: Hook (reads to hook rate)
Layer 2: Message and angle (reads to CTR and CVR)
Layer 3: Format and structure (reads to hold rate)
Layer 4: Visual (reads to hook rate and recall)
Layer 5: Audio (reads to hold rate)
Layer 6: CTA and offer (reads to CVR and CPA)
Layer 7: Delivery context (reads to eligibility and CPM)
A practical note on reading this. Headline, angle, and offer tags carry the most explanatory weight, so prioritize them when you start. The discipline that matters most is consistency, not volume. A taxonomy applied unevenly produces noise that looks like insight, which is worse than no tagging at all.
Start with the four highest-signal categories, hook, format, offer, and CTA, get them perfectly consistent, then layer in the remaining variables as your library grows.
How to read hook rate and hold rate together
Two of the 30 variables deserve a closer look, because most teams measure them wrong or not at all. Hook rate and hold rate are the diagnostic pair that tell you where a video creative is breaking.
Hook rate is the percentage of 3-second video plays relative to impressions. It tells you how scroll-stopping the first frames are. Hold rate is ThruPlays divided by 3-second plays. It tells you, of the people the hook stopped, how many stayed to the end. You read them as a pair.
Industry hook rate benchmarks put 25% as table stakes, 30% as good, and 40% as elite, the point where the algorithm starts treating your creative as genuinely relevant and rewards it with broader distribution. A healthy hold rate for cold prospecting sits in the 12% to 25% range, and below 10% means the body is losing the people the hook already won.
The combination tells you what to fix. High hook rate with low hold rate means the opening overpromises and the body loses people, so look at variables 11 through 24. Low hook rate with decent hold rate means the first 3 seconds are weak even though the content is good, so rework variables 1 through 5. You cannot see either diagnosis at the ad level, only at the variable level.
A worked decomposition: 0.9x to 3.1x ROAS
Here is how the framework reads in practice. The account below is a composite built from the variable mapping above, not a single client, but the pattern is one any tagged account will recognize.
The starting point was a blended 0.9x ROAS across about 40 live creatives. Ad-level reporting was useless. Some video ads hit 2x, some hit 0.4x, and the team had no idea why. So they tagged the whole library against the 30 variables and pulled performance by cohort.
The read was immediate. The winning cohort shared four tags: a question hook (variable 1), product in the opening frame (variable 4), a creator voiceover (variables 21 and 22), and a 9:16 ratio (variable 15). That cohort averaged a 41% hook rate and a 2.8x ROAS. The losing cohort shared studio b-roll, a music-only track, and a 1:1 ratio repurposed from a static campaign. It averaged a 19% hook rate and a 0.6x ROAS.
The decomposition isolated which element actually carried the win. Within an asset cluster that reused the same footage, the only difference between a 2.6x ad and a 0.7x ad was the hook format and the voiceover. Same product, same offer, same visuals. That is the level of precision ad-level reporting cannot reach.
The action was to hold the winning elements constant and vary everything else. The team briefed 12 new variants that kept the question hook, the creator voiceover, and the 9:16 frame, then tested new angles and offers on top. Over 8 weeks, as winners compounded and the losing cohort was cut, the blended account moved from 0.9x to 3.1x ROAS. Nothing about the budget or the audience changed. They just stopped guessing which elements to reproduce.
How auto-tagging reads all 30 variables for you
Reading 30 variables by hand works until it does not. Manual tagging holds up to roughly 100 active creatives before consistency drifts between people and over time. Past that, the math stops working, because the human applying the tags becomes the bottleneck and the source of noise.
This is where multimodal tagging changes the read. Segwise uses multimodal AI to automatically tag every creative element across video, audio, image, and text. Video analysis tags visual elements, scene changes, on-screen text, product shots, and pacing. Audio analysis transcribes and tags hook lines, voiceover styles, and music. Image analysis tags colors, compositions, characters, and emotions. Text analysis extracts headlines and CTAs. It is also the only platform that tags playable ads, which matters for mobile gaming teams.
Every tag is automatically mapped to performance metrics, so the cohort tables in the worked example above are generated for you instead of built in a spreadsheet. Segwise's asset clustering groups ads that share the same underlying footage, which is exactly how you isolate which single treatment caused a ROAS difference between two similar creatives. Its fatigue detection then watches your winning patterns for decline, so a tag that is burning out flags before it drains budget.
The platform unifies this across 15+ ad networks and MMPs, including Meta, Google, TikTok, Snapchat, YouTube, AppLovin, Unity Ads, Mintegral, and IronSource, plus AppsFlyer, Adjust, Branch, and Singular for attribution. That removes the cross-platform silo problem, because your Meta read and your TikTok read live in the same taxonomy.
A 7-day implementation guide
You can stand this up in a week without buying anything, then decide whether to automate. Here is the plan.
Day 1, export your data. Pull 60 to 90 days of creative-level performance for every live and recently paused ad. Include hook rate, hold rate, CTR, CVR, spend, and ROAS.
Day 2, define your taxonomy. Start with the four highest-signal categories: hook, format, offer, and CTA. Write down the allowed values for each so tagging stays consistent. Plan to expand to all 30 variables.
Day 3, tag the library. Tag every creative against your taxonomy. A structured Google Sheet or Airtable, one row per creative and one column per variable, works fine under 100 ads.
Day 4, map tags to metrics. Build a cohort table that aggregates performance by tag value. Average hook rate by hook format, average ROAS by angle, and so on.
Day 5, run the decomposition. Rank variables by performance contribution. Use asset clusters to isolate single-variable differences between similar ads. Find the elements that win across 10 or more ads, not one.
Day 6, brief from evidence. Form two or three hypotheses. Brief 8 to 12 new variants that hold the winning elements constant and vary only what you are testing.
Day 7, set guardrails and schedule the re-read. Define success criteria for new creatives and fatigue thresholds for winners. Put a weekly re-read on the calendar, because the framework only compounds if you run it on a loop.
Conclusion
Reading creative at the ad level is the most common and most expensive habit in performance marketing. The ID tells you what happened, never why, so every win stays a one-off and every brief starts from gut. A creative tag analytics framework fixes that by reading the 30 variables underneath each ad and mapping them to the metrics they move, which is how a win becomes a pattern you can reproduce on purpose.
That is the whole shift. You stop scaling lucky ads and start scaling proven elements. The worked example moved from 0.9x to 3.1x ROAS not by making better creative in a vacuum, but by reading which elements already worked and refusing to brief anything that ignored them.
If you want the 30-variable read to run without the spreadsheet grind, Segwise auto-tags every creative across your networks, maps every tag to ROAS, and flags fatigue before it costs you, saving teams up to 20 hours a week and contributing to ROAS improvements of up to 50%. Plug in your ad accounts and the decomposition runs itself.
Frequently asked questions
What is a creative tag analytics framework?
A creative tag analytics framework is a system for reading ad performance at the element level instead of the ad level. You tag every creative against a consistent set of variables, like hook format, angle, CTA, and audio, then aggregate performance by tag to see which elements drive CTR and ROAS. It answers which element won and will win again, rather than just which ad won.
How many variables should I tag per creative?
Start with the four highest-signal categories, hook, format, offer, and CTA, then expand toward a fuller 30-variable read as your library grows. Industry guidance suggests 8 to 15 tags per creative is the practical working range for most accounts. Consistency across every ad matters more than the raw number of tags.
What is the difference between a tag analytics framework and an ABCD creative score?
An ABCD-style score is a pre-launch checklist that rates a creative before it runs against best-practice attributes. A tag analytics framework is a post-launch read that ties the elements of ads already running to their actual performance. The score predicts, the framework measures. Tools like Segwise, Hawky, and Improvado focus on the post-launch read, mapping live tags to metrics like ROAS.
How do I read hook rate and hold rate together?
Hook rate is 3-second plays over impressions, and hold rate is ThruPlays over 3-second plays. High hook rate with low hold rate means the opening overpromises and the body loses people. Low hook rate with healthy hold rate means the first 3 seconds are weak even though the content holds. You diagnose the fix from the combination, not either number alone.
Can I do creative tag analysis without buying software?
Yes, under about 100 active creatives. A structured Google Sheet with one row per creative and one column per variable works well. Past that ceiling, manual tagging drifts in consistency and eats hours, which is when auto-tagging platforms like Segwise become worth it for speed and reliability.
how do I actually find which element caused my ROAS difference?
Group ads that share the same footage into an asset cluster, then compare two similar creatives that differ in only one tagged variable. If a 2.6x ad and a 0.7x ad share everything except the hook format, the hook format carried the difference. Segwise's asset clustering automates this isolation so you do not have to line up creatives by hand.
What does this mean for a small team with limited time?
It means you can stop wasting production budget on creative that ignores your own proven winners. Even a one-week manual tagging pass tells you which hook, angle, and CTA to hold constant in your next brief. For teams running hundreds of creatives, auto-tagging removes the manual ceiling so the read stays reliable without adding headcount.
