
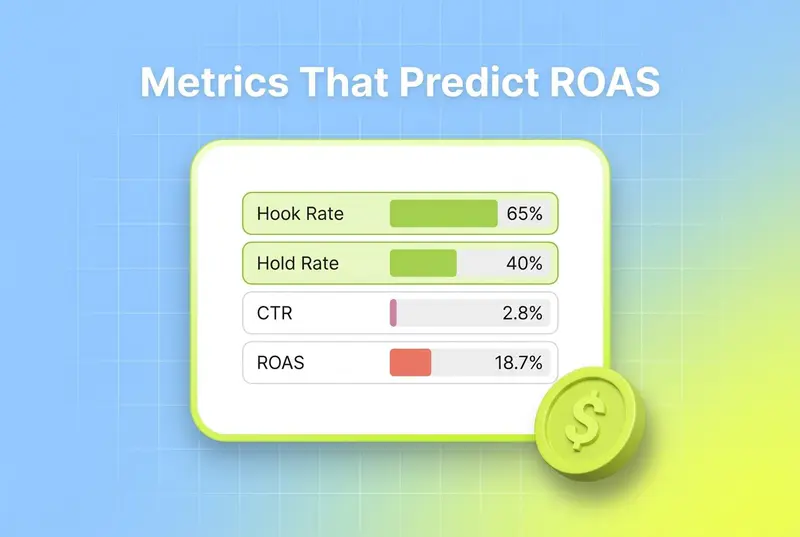
The creative metrics that actually predict ROAS are hook rate, hold rate, thumb-stop rate, CTR, and CVR, read together and per creative, not as account-wide averages. Hook rate and hold rate are leading indicators of whether an ad earns and keeps attention. CTR and CVR carry that attention toward intent and conversion. Creative-level ROAS is the scoreboard. The catch is that a single number tells you almost nothing on its own. The value shows up when you map each metric back to the creative element that produced it, which is what Segwise does by tagging every element and connecting each tag to performance.
Most teams already track ROAS. Far fewer track the metrics that predict it before the spend report lands. By then the budget is gone and the only question left is which campaign to blame. The metrics below sit upstream of ROAS, which is exactly why they are worth watching.
This post walks through each metric: what it measures, how to read it, rough industry thresholds, and how it connects to the elements that actually move revenue. Treat it as a scannable reference, not a lecture.
Key takeaways
- The creative metrics that predict ROAS are hook rate, hold rate, thumb-stop rate, CTR, CVR, and creative-level ROAS, read together rather than in isolation.
- Hook rate and hold rate are the earliest leading indicators. If creative health is weak here, no budget or targeting fix saves the downstream numbers.
- Rough industry norms: a healthy Meta hook rate sits around 28% with 35-45% as elite, and TikTok averages about 30.7% with 40%+ as top tier.
- A single metric is just a number. A metric mapped to a creative element ("UGC hook" vs "logo open") is a decision.
- AI tagging is what makes this work at scale. Segwise tags every creative element across 15+ ad networks and four MMPs and maps each tag to ROAS automatically.

Why most creative metrics are read wrong
Before the metrics, a quick warning. The reason these numbers fail most teams is not the math. It is that they get read in the wrong order and at the wrong altitude.
Read in the wrong order means starting at ROAS. ROAS is a lagging outcome. By the time it moves, the creative decision was made weeks ago. The metrics that predict ROAS sit earlier in the funnel: did the ad stop the scroll, did it hold attention, did it earn a click, did the click convert. Check creative health first, then read delivery metrics. If hook rate and hold rate are strong, ROAS usually follows. If they are weak, no targeting tweak will rescue it.
Read at the wrong altitude means looking at account averages. An account-wide hook rate blends your best and worst creatives into a number that describes neither. The signal lives at the creative level, and the decision lives one level deeper still, at the element level. This is the through-line of the whole post: the metrics that predict ROAS only predict it when you read them per creative and map them to the elements that produced them.
Hook rate
Hook rate measures how many people are still watching after the first few seconds. On Meta it is typically the share of impressions that become 3-second views. On TikTok it is closer to 2-second views over impressions. It is the earliest signal of whether a creative earns attention at all, and a weak hook rate caps everything downstream. People who scroll past in the first second never see your offer.
How to read it: treat hook rate as a gate, not a goal. A strong hook does not guarantee a sale, but a weak one guarantees you will not get the chance. Read it per creative and compare creatives that share a format.
Rough thresholds (industry norms, not Segwise numbers): on Meta, around 28% is solid and 35 to 45% is elite. On TikTok, the average sits near 30.7% with top performers at 40 to 45%. Industry consensus puts 25% as baseline and 30%+ as best-in-class.
The real insight comes from mapping it. A hook rate by itself is a number. A hook rate split by "talking-head opener vs product-shot opener" tells you what to brief next.
Hold rate
Hold rate (and completion rate) measures whether the creative keeps attention past the hook. On Meta it is often read as ThruPlays over 3-second views. It answers the question the hook rate cannot: once you stopped the scroll, did the story hold?
How to read it: always pair it with hook rate. A strong hook with a weak hold means your opening wrote a check the rest of the ad could not cash. That pattern usually points at pacing, a slow middle, or a payoff that arrives too late. Diagnose the two together before you touch the budget.
Rough thresholds (industry norms): a healthy hold rate target is around 25% and up to 45% when optimized, with cold-traffic numbers running lower than warm. TikTok hold tends to run a few points below Meta for the same creative.
Hold rate is where creative structure shows up most clearly, which makes it the metric most worth mapping to elements like pacing, scene count, or where the offer lands.
Thumb-stop rate
Thumb-stop rate measures how effectively the creative interrupts the scroll. In practice it overlaps heavily with hook rate, usually expressed as the share of impressions that become 3-second views relative to reach. Many teams use thumb-stop rate and hook rate interchangeably, and that is fine as long as you pick one definition and hold it steady across creatives.
How to read it: this is your scroll-stopping power, isolated. It rewards the first frame, the motion in the opening, and the pattern interrupt. If thumb-stop is low, the problem is almost always the first frame or the first half-second of motion, not the message.
Rough thresholds (industry norms): treat it on the same scale as hook rate, since the platforms grade both on the 2-to-3-second view window. Anything below the 25% baseline signals a weak opener.
The actionable version is comparative. Stack your thumb-stop rate by opening type across the account and the winning pattern becomes obvious.
Click-through rate (CTR)
CTR still matters as a mid-funnel intent signal, the share of people who saw the ad and clicked. It sits between attention and conversion. But it is the most misread metric on this list, because a high CTR can be a trap.
How to read it: never read CTR alone. Read it next to hold rate and CVR. High CTR with low hold often means a misleading hook that earns clicks the landing experience cannot honor. High CTR with low CVR means you are buying attention that does not convert. CTR is only good news when the metrics around it agree.
Rough thresholds (industry norms): paid social CTR benchmarks vary widely by platform and vertical, but recent 2026 analysis cites baseline Meta CTRs around 0.96 to 1.08%, with higher figures common on lower-funnel and retargeting placements. Use your own historical CTR as the benchmark that matters most.
CTR mapped to CTA type or offer is far more useful than CTR as a campaign average, because it tells you which message earns the click.
Conversion rate (CVR)
CVR ties the creative to an actual outcome, the share of clicks that become the action you care about. A creative can win attention all the way down the funnel and still convert poorly. That mismatch, attention without conversion, is exactly the kind of thing creative analytics is built to surface.
How to read it: CVR is where creative meets landing experience and offer. A creative with great hold and CTR but weak CVR usually means the ad promised something the post-click experience did not deliver. Read CVR per creative and watch for creatives that over-index on clicks but under-index on conversions.
Rough thresholds (industry norms): CVR is the most vertical-dependent metric here, so absolute benchmarks are less useful than relative ones. Compare creatives against each other and against your account median rather than chasing a universal number.
CVR mapped to offer or proof element (social proof, discount, guarantee) tells you which promise actually closes.
Creative-level ROAS and CPI
Creative-level ROAS and CPI are the bottom line, measured per creative rather than per campaign, ideally connected to MMP data so you are reading installs and revenue, not just clicks. This is the metric every other metric is trying to predict.
How to read it: ROAS is the scoreboard, but it is a lagging one. By the time creative-level ROAS confirms a winner, the upstream metrics already told you weeks earlier. Use ROAS to validate, use hook rate and hold rate to anticipate. Connecting ROAS and CPI to MMP data is what separates real outcome measurement from click-level proxies.
Rough thresholds (industry norms): ROAS benchmarks are wildly vertical-dependent, so there is no single good number. One 2026 analysis pegs blended creative ROAS in the 2.3x to 4.8x range depending on average order value. Your target is your own break-even multiple, not an industry average.
The whole point of the metrics above is to predict this one before the money is spent.
The metric is only half the answer. The element is the other half.
Here is the part most metric guides skip. Knowing your hook rate is 32% is interesting. Knowing that your 32% hook rate comes from problem-first openers while your logo openers sit at 18% is a decision. The metric tells you something happened. The element tells you what to do about it.
This is why creative-level metrics only predict ROAS when they are mapped to creative elements. A hook rate mapped to opener type, a CTR mapped to CTA, a CVR mapped to offer, a hold rate mapped to pacing. That mapping is the difference between a dashboard you stare at and a brief you can write.
The problem is doing it at scale. Tagging every creative by hand, then connecting each tag to each metric across every network, is brutally slow. Teams that try often spend 20+ hours a week per app or brand on tagging alone, which is why most quietly give up and go back to reading averages.
Segwise closes that gap. It unifies creative and performance data across 15+ ad networks, including Meta, Google, TikTok, Snapchat, YouTube, AppLovin, Unity Ads, Mintegral, and IronSource, alongside MMPs AppsFlyer, Adjust, Branch, and Singular. Its Creative Tagging Agent uses multimodal AI to tag every element across video, audio, image, and text automatically, including playable ads, which it is the only platform to tag. Then every tag is mapped to performance, so hook rate, hold rate, CTR, CVR, and creative-level ROAS each carry the element that produced them. The analysis that takes a team 20 hours a week runs continuously in the background.
Card View shows creative thumbnails next to their performance data, so you read the actual ad and not an abstract row. And the always-on Creative Strategy Agent lets you ask in plain language which hook style drove the most installs last month, with full context across your account.
How to read these metrics together
The metrics are not a menu to pick from. They are a sequence to read in order.
- Start at the top of the funnel. Read thumb-stop and hook rate first. If the ad cannot stop the scroll, nothing downstream matters.
- Check the hold. Pair hook rate with hold rate. A good hook and a bad hold is a pacing problem, not a targeting problem.
- Read CTR against hold. High CTR only counts if hold and the message agree. Otherwise you are buying hollow clicks.
- Tie CTR to CVR. Attention that does not convert is a creative-promise mismatch, usually between the hook and the landing experience.
- Confirm with creative-level ROAS. ROAS validates what the upstream metrics already predicted. If it surprises you, your upstream reads were probably blended at the account level.
Read this way, the metrics that predict ROAS do exactly that. They give you the answer before the spend report does.

Common mistakes to avoid
- Reading account averages. A blended hook rate or ROAS describes none of your creatives. The signal is always per creative.
- Starting at ROAS. ROAS is the last metric to move, not the first. Read creative health first.
- Trusting CTR on its own. A high CTR with weak hold or CVR is a misleading hook, not a win.
- Skipping the element mapping. A metric without the element behind it cannot tell you what to brief next.
- Ignoring fatigue. Today's winning hook rate decays. Watch the trend, not just the snapshot, and refresh before the budget burns.
Conclusion
The creative metrics that actually predict ROAS are hook rate, hold rate, thumb-stop rate, CTR, and CVR. Read them per creative, in funnel order, and they tell you where revenue is heading before the spend report confirms it. Read them as account averages and they tell you almost nothing.
The harder half is mapping each metric to the creative element that produced it, and doing it across thousands of creatives and a dozen networks without drowning in spreadsheets. That is the job an AI-powered creative intelligence platform exists to do.
If you want to read the metrics that predict ROAS at the element level instead of the account level, Segwise unifies your creative data across 15+ networks and four MMPs, tags every element automatically, and maps each tag to performance, saving teams up to 20 hours a week and helping them improve ROAS by up to 50%.
Frequently asked questions
Which creative metrics actually predict ROAS?
The creative metrics that best predict ROAS are hook rate, hold rate, thumb-stop rate, CTR, CVR, and creative-level ROAS or CPI. Hook rate and hold rate are leading indicators of attention, CTR and CVR carry that attention toward conversion, and ROAS is the lagging scoreboard. The key is reading them together per creative and mapping each back to the element that produced it, which is what platforms like Segwise automate by tagging every creative element and connecting it to performance.
What is a good hook rate?
Hook rate measures the share of impressions that become 2-to-3-second views, and benchmarks vary by platform. On Meta, around 28% is solid and 35 to 45% is considered elite. On TikTok, the average sits near 30.7% with top performers at 40 to 45%. Treat these as industry norms and benchmark against your own historical hook rate, since vertical and audience shift the numbers.
What is the difference between hook rate and hold rate?
Hook rate measures whether viewers stay past the first few seconds, so it grades your opener. Hold rate measures whether they stay engaged through the middle, usually from 3 to 15 seconds, so it grades your story and pacing. A strong hook with a weak hold means the opening earned attention the rest of the ad could not keep, which is a pacing problem rather than a targeting one.
Is CTR a good predictor of ROAS?
CTR is a useful mid-funnel intent signal but a poor predictor on its own. A high CTR paired with low hold rate often signals a misleading hook, and a high CTR with low CVR means you are buying clicks that do not convert. CTR only predicts ROAS when the metrics around it, hold rate and CVR, agree. Always read it in context rather than as a standalone win.
Why do I need creative-level metrics if the platforms already optimize for me?
Platform automation optimizes delivery and bidding, but it does not tell you which creative element earned the result or what to brief next. As targeting got commoditized, the creative became the main lever you control, so the metrics that explain your creative are the ones that explain your performance. Segwise reads those metrics at the element level across every network, surfacing patterns the platform's black box never hands you.
How does Segwise connect creative metrics to ROAS?
Segwise unifies creative data across 15+ ad networks and four MMPs (AppsFlyer, Adjust, Branch, and Singular), then uses multimodal AI to tag every element across video, audio, image, and text, including playable ads. Each tag is automatically mapped to performance, so hook rate, hold rate, CTR, CVR, and creative-level ROAS each carry the element that produced them. That tag-to-metric mapping is how you see which creative choices actually drive ROAS, rather than guessing from account averages.
How do these metrics relate to creative-level versus campaign-level analytics?
These metrics only predict ROAS when read at the creative level, not the campaign level. Campaign-level analytics blends every creative into one average that hides which ads and elements actually worked, while creative-level analytics gives every creative its own profile. For the full picture of how creative analytics fits together, see the complete creative analytics guide.