Creative-level vs campaign-level analytics: what's the difference in 2026?
Creative-level analytics measures ad performance for each individual creative and its elements (hooks, CTAs, formats, visual styles), so you learn why an ad won. Campaign-level analytics rolls every creative inside a campaign or ad set into one average, which is fine for budget pacing but hides which specific ads and elements drove the result. The difference is simple: campaign data tells you a bucket of spend returned a number, creative data tells you what to make next.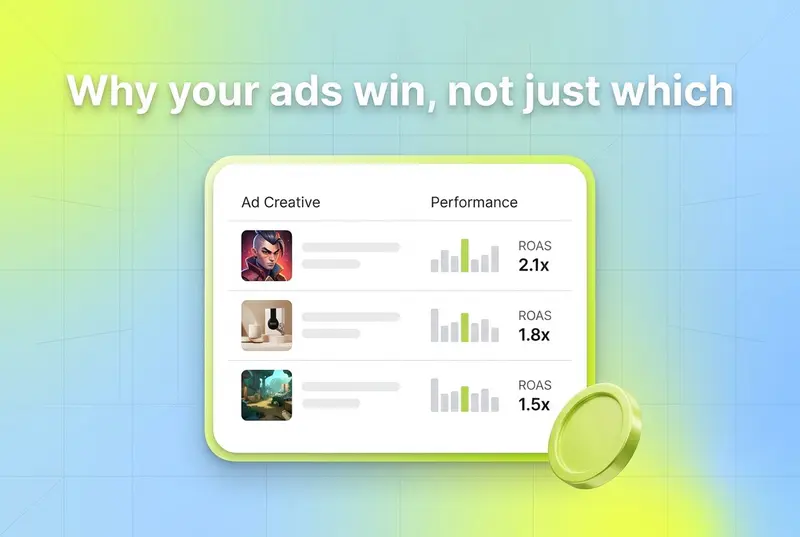
Most teams can tell you which campaign spent the most last month. Far fewer can tell you which hook, format, or offer caused the wins inside it. That gap is the difference between scaling on evidence and scaling on a vibe.
The myth worth busting here is that a healthy campaign-level ROAS means your creative is working. It does not. A 2.5x campaign can be carried by two creatives while eight others quietly drain spend, and the average will never tell you. To see that, you have to stop treating the campaign as the unit of analysis and start looking at the creative.
This post lays out what each type of analytics measures, what each one hides and reveals, when to use which, and what the contrast looks like with real numbers.
Key takeaways
Campaign-level analytics aggregates all creatives into one row, useful for pacing and account health but blind to which specific ads work. Creative-level analytics gives every creative its own profile and groups results by element across the account.
Creative is the biggest single driver of sales. NCSolutions found creative drives roughly 49% of incremental sales while targeting drives about 11%, yet marketers credit targeting more than creative.
Marketers underrate this badly. The same research shows they peg creative at around 19-20% of the sales effect, roughly 2.5 times below its real impact.
Nielsen attributes up to 89% of a digital campaign's in-market success to creative, more than reach, targeting, and recency combined.
Campaign reporting hides creative truth partly because each platform defines its own metrics and attributes conversions its own way, so no single campaign average is comparable across networks.
Platform automation makes the creative view more important, not less. Meta's shift toward broad targeting and creative-first delivery means the creative is now the main variable a human controls.
What campaign-level analytics measures
Campaign-level analytics reports performance for a campaign or ad set as a whole. Spend, impressions, clicks, installs, ROAS, and CPA all roll up into a single line per campaign. It is the native view inside Meta Ads Manager, Google Ads, and TikTok Ads Manager, and it is what most teams live in day to day.
This view is genuinely useful for some jobs. You use it to pace budget, check account health, compare campaign objectives, and decide where money flows at a high level. If prospecting is returning 2.1x and retargeting is returning 4.0x, that is a campaign-level decision and a fair one.
The problem starts when you try to use campaign data to make creative decisions. A single campaign usually holds many creatives, and broad targeting now pushes you to run 10 to 20 creative concepts per campaign. The campaign number is the blended average of all of them. The two ads carrying the result and the eight ads dragging it down get melted into one figure that points you nowhere.
What campaign-level analytics hides
Averages are comforting and dishonest. A campaign reporting a respectable ROAS can contain creatives spanning a 5x spread in performance, and the report smooths all of that into one calm number. You cannot see which hook earned attention, which format converted, or which creative is already fatiguing, because none of those live at the campaign level.
You also cannot compare across campaigns in any creative sense. The same UGC hook might appear in four campaigns with four different audiences and budgets. Campaign reporting treats those as four separate rows, so the pattern, the thing you could act on, stays invisible.
What creative-level analytics measures
Creative-level analytics breaks the campaign row apart. Every creative gets its own performance profile, and then every creative gets described by its elements through tagging: the hook, the CTA, the format, the visual style, the on-screen text, the audio, the emotion.
Once each creative is tagged, you can group performance by element across the entire account rather than by campaign. All ads with a problem-first hook. All 9:16 vertical videos. All creatives featuring a specific offer or character. That cross-account grouping is where patterns surface, and patterns are the only thing you can repeat on purpose.
The shift matters more every year because of where performance is actually decided now. As platforms automated targeting and bidding, the creative became the lever a human still controls. Meta's Andromeda update reframed delivery around matching the right creative to each user rather than picking the audience first. When everyone shares the same targeting machine, the creative is the durable edge, so the analytics that explain the creative become the analytics that explain performance.
What creative-level analytics reveals
This is the half campaign reporting cannot reach. Creative-level analytics tells you that your 3-second talking-head openers hold 40% more viewers than your text-on-screen openers. That your social-proof CTAs beat your discount CTAs at the same CPM. That one visual style is quietly carrying half your ROAS while you keep briefing the other one.
The metrics that matter here are different too. At the creative level you read hook rate, hold rate, thumb-stop rate, CTR, CVR, and creative-level ROAS, not account-wide averages. A hook rate by itself is just a number. A hook rate mapped to "talking-head opener vs product-shot opener" is a decision you can brief tomorrow.
The contrast in one example
Picture a prospecting campaign that returned 2.3x ROAS last week. Here is what each view says about the exact same spend.
The campaign view: "Prospecting returned 2.3x this week, up slightly from last week. Healthy."
The creative view: "Our top-quartile creatives all open on a problem-first hook in the first second and return 3.6x. The bottom quartile open on brand logos and return 1.1x. Two of the bottom-quartile ads are eating 30% of spend."
Same campaign, same week, same dollars. The first statement tells you nothing to do. The second writes your next brief, flags your budget leak, and tells you which ad to cut, all at once. That is the difference between knowing what happened and knowing why.
This is also where the perception gap bites. NCSolutions found marketers credit creative with about 19 to 20% of the sales effect when its real contribution is closer to 49%, while overrating targeting by roughly double. Teams that report only at the campaign level keep optimizing the lever that matters least, because their reporting never shows them the creative.
When to use each
Neither view is wrong. They answer different questions, and mature teams run both.
Use campaign-level analytics for budget allocation, pacing, account health, and comparing objectives or funnel stages. It is the right altitude for "where should the money go this week."
Use creative-level analytics for everything about the creative itself: which elements to brief more of, which to retire, which ads are fatiguing, and why a campaign is performing the way it is. It is the right altitude for "what should we make next and why."
The trap is using campaign data to answer creative questions. That is the default for most teams, and it quietly caps how good their creative can get. You cannot improve what you cannot see.
Why teams stay stuck at the campaign level
If creative-level analytics is so much more useful, why doesn't everyone do it? The honest answer is that it is operationally hard, not conceptually hard.
First, the data is fragmented. Each network defines its own metrics and attributes conversions on its own logic, and your MMP reports installs and revenue differently again, so getting every creative into one comparable view is a real project. Campaign reporting is easier because each platform hands it to you natively.
Second, the tagging is brutal. To analyze by element, every creative has to be described by its elements, and done by hand that work can eat 20+ hours a week per app or brand. Most teams skip tagging altogether, which strands them at the campaign level by default.
This is the gap modern creative analytics platforms close. The point is not a prettier dashboard. It is automating the two jobs (unifying fragmented data and tagging every creative) that otherwise keep teams from ever leaving the campaign view.
How Segwise makes the creative view practical
Segwise unifies creative and performance data across 15+ ad networks and MMPs, including Meta, Google, TikTok, Snapchat, YouTube, AppLovin, Unity Ads, Mintegral, and IronSource, alongside MMPs AppsFlyer, Adjust, Branch, and Singular. Setup is no-code and takes minutes, with historical data imported automatically (up to 14 days on the free trial and up to 3 months for paid customers).
On top of that unified data, the Creative Tagging Agent uses multimodal AI to tag every element across video, audio, image, and text, including playable ads, which it is the only platform to tag. Each tag is mapped to performance through tag-to-metric mapping, so the analysis that would take a team 20 hours a week runs continuously in the background. The same automated creative tagging keeps the taxonomy consistent across thousands of ads, which is exactly where manual tagging falls apart.
The interface is built for creative work. Card View shows creative thumbnails next to performance data, so you analyze the actual ad rather than an abstract row, and the always-on Creative Strategy Agent lets you ask in plain language which hook style drove the most installs last month and get an answer with full context across your account.
The contrast, one more time
Strip away the detail and it comes down to the unit of analysis. Campaign-level analytics treats the campaign as the thing you measure and optimize, which is right for budget and wrong for creative. Creative-level analytics treats the individual creative and its elements as the thing you measure, which is the only altitude that tells you why performance moved and what to brief next.
If campaign reporting is your speedometer, creative analytics is the diagnostic that tells you what's actually happening under the hood. You need the speedometer. But you cannot fix anything with it. Once you commit to the creative view, the next steps are learning how to measure ad creative performance at the element level and figuring out which creative metrics that predict ROAS actually deserve your attention. For deeper context on building this layer end to end, see the complete guide to creative analytics, or explore Segwise to see the creative view on your own data.
Frequently asked questions
What is the difference between creative-level and campaign-level analytics?
Campaign-level analytics aggregates every creative inside a campaign or ad set into one average, which is useful for budget pacing and account health but hides which specific ads and elements worked. Creative-level analytics breaks that average apart, giving every creative its own performance profile and grouping results by element across the whole account. In short, campaign data tells you a bucket of spend returned a number, while creative data tells you which hook, format, or CTA actually drove the result and what to brief next.
Is campaign-level analytics useless then?
No, it is just the wrong tool for creative decisions. Campaign-level analytics is the right view for pacing budget, checking account health, and comparing objectives or funnel stages. It only becomes a problem when teams use it to judge creative, because the campaign average melts many creatives into one number and hides the ones actually driving or draining performance.
Why can't I just look at campaign ROAS to know if my creative is working?
Because a healthy campaign ROAS can be carried by a couple of creatives while several others quietly waste spend, and the average will never reveal that. Campaign ROAS tells you the blended result, not which creative elements earned it. NCSolutions research shows creative drives around 49% of incremental sales, so a view that hides the creative is hiding your biggest performance lever.
What does creative-level analytics mean for a UA manager day to day?
It changes what your weekly review looks like. Instead of reading a list of campaign ROAS numbers, you group performance by creative element across the account, find the hooks and formats that repeat in your winners, and brief the next round from that. For a UA manager it turns the creative review from an opinion debate into a data decision, and it surfaces fatigue and budget leaks the campaign view smooths over.
How do I actually start doing creative-level analytics?
Start by consolidating every creative from every network and MMP into one view with consistent metric definitions, then tag each creative by its elements (hook, format, CTA, visual style), then map those tags to a real outcome metric like creative-level ROAS. The hard parts are unifying fragmented data and tagging at scale, which is why most teams use a dedicated platform rather than spreadsheets that break down past a few hundred creatives.
Do platform automation tools like Advantage+ make creative analytics unnecessary?
The opposite. Automation handles delivery and bidding, but it does not tell you why a creative worked or hand you the patterns to brief your next round. Meta's move toward broad targeting and creative-first delivery means the creative is now the main variable you control, so the analytics that explain your creative matter more than ever. The platforms optimize within your creative; creative-level analytics improves the creative itself.
