
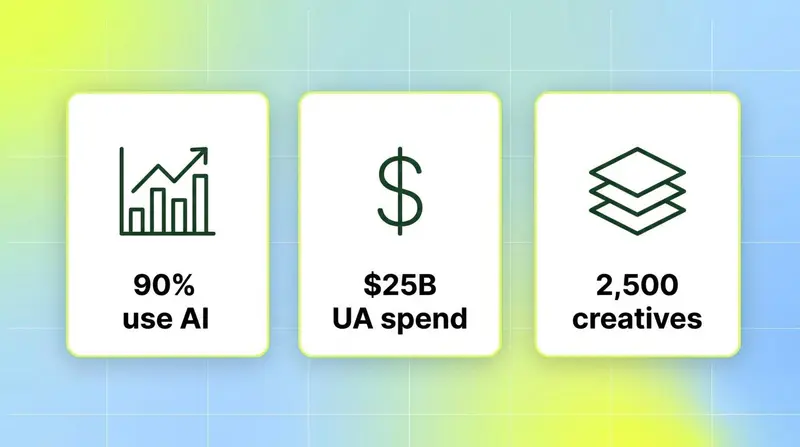
AI is now standard equipment in mobile game marketing: 90% of game developers already use generative AI in their workflows, top game advertisers ship 2,400 to 2,600 creative variations per quarter, and global gaming UA spend hit $25 billion in 2025. This report pulls together the numbers that matter, every one linked to a primary source, so UA and creative teams can benchmark where the industry actually stands.
Mobile gaming spends more on creative and acquisition than any other app category, and generative AI has reset the baseline for how fast, how cheap, and how much of it gets made. The result is a strange split: production costs are falling while the cost to win a player keeps climbing. This report gathers the current, sourced statistics on AI adoption, generative creative production, testing volume, spend and ROAS, playable and video format performance, and gaming-specific benchmarks. For the broader, cross-category picture beyond games, see our companion AI in advertising and marketing statistics report.
Every figure below is dated and cited. Where a stat comes from a paid or private report, we link the primary announcement or the publisher's own summary. This is a gaming-and-UA-specific report, so we have kept general adtech numbers out and pointed to the companion piece instead.
Key takeaways: the headline stats
90% of game developers already use generative AI in their workflows, and 97% believe it is reshaping the industry.
Global gaming UA spend reached $25 billion in 2025, up 3.8% year over year, with paid install share up 10% and ad impressions up 20%.
Top gaming advertisers now produce 2,400 to 2,600 creative variations per quarter, a 25% to 30% jump year over year.
Playable ads convert 8x to 16x better than non-playable formats on an impression-to-install basis.
Meta's AI video generation tools hit a $10 billion revenue run-rate in Q4 2025, growing nearly 3x faster quarter over quarter than overall ad revenue.
Mobile made up 56% of the $201.6 billion global games market in 2025 (about $113 billion).
Generative AI app downloads doubled to 3.8 billion in 2025 while gaming IAP revenue grew just 1.3%
The market backdrop: how big mobile gaming is
Before the marketing numbers, the size of the prize. Mobile is the largest slice of gaming, and its revenue growth shapes how aggressively studios spend on acquisition.
The global games market closed 2025 at $201.6 billion, up 9.1% year over year, with mobile accounting for 56% of revenue, roughly $113 billion.
Mobile gaming in-app purchase revenue reached about $82 billion in 2025, up only 1.3% year over year.
Total mobile IAP revenue across all categories hit $167 billion, up 10.6%, and for the first time non-gaming apps out-earned games, with non-gaming IAP up 21% year over year.
Consumers spent about $85 billion on non-game apps in 2025, nearly 2.8x the total five years earlier.
The takeaway for UA teams: gaming revenue is still enormous but growing slowly, while non-gaming and AI apps are pulling spend and attention. That squeeze is exactly why acquisition efficiency has become the whole ballgame.
AI adoption in game marketing and development
Generative AI moved from experiment to default across game studios in 2025. The adoption numbers are near-universal on the development side and climbing fast on the marketing side.
90% of game developers already integrate generative AI into their workflows, and 97% believe it is reshaping the industry, per Google Cloud's August 2025 research with The Harris Poll, surveying 615 developers across the US, South Korea, Finland, Norway, and Sweden.
The most common AI use cases in that study: automating repetitive tasks (95%), playtesting and balancing (47%), localization and translation (45%), and code generation and scripting (44%).
On the marketing side, 46% of AI assistant queries from gaming marketers focused on reporting and performance breakdowns. AI is being used first to make sense of data, not to make strategic calls.
iOS gaming advertisers increased the number of media sources they used by up to 15% year over year, spreading budget across more channels as AI makes managing that complexity feasible.
The pattern is clear. AI has saturated production and analysis, but game marketers are still using it mostly to keep up with data volume rather than to replace human strategy.
Generative-AI creative production
This is where AI has changed the physics of UA. When a script-to-video tool can render an ad in minutes, the constraint stops being production capacity and becomes knowing what to make.
Top gaming advertisers produced between 2,400 and 2,600 creative variations per quarter in 2025, up 25% to 30% year over year, growth AppsFlyer attributes largely to AI-enabled production.
Meta's AI video generation tools reached a combined $10 billion revenue run-rate in Q4 2025, with quarter-over-quarter growth nearly 3x faster than Meta's overall ads revenue. That is a direct read on how fast advertisers are adopting generative creative tools.
Generative AI is not just an advertiser tool. Consumer generative AI app downloads doubled to 3.8 billion in 2025, and IAP revenue in that category nearly tripled to top $5 billion, per Sensor Tower. The same underlying models powering consumer apps are what studios use to generate ad creative.
The flip side of cheap, infinite creative: more of it, everywhere. AppsFlyer's report title says it plainly: "AI is Flooding Mobile Gaming Marketing Channels and Raising the Cost of Standing Out." That flood of creative variations is a direct driver of the cost inflation covered below.
AI cut production cost, not the guesswork When anyone can generate thousands of creatives a quarter, the moat shifts from making ads to knowing which elements actually drive installs. See how creative tagging maps every hook, CTA, and visual to performance.
Creative testing and iteration volume
The volume of creative in market is staggering, and the datasets behind the leading reports show just how much testing now happens at scale.
Leading advertisers ship thousands of creative variations every quarter (the 2,400 to 2,600 figure above), a pace that is impossible to analyze by hand.
Liftoff's 2025 Creative Index analyzed 4.7 trillion impressions, 263 billion clicks, and 1.1 billion installs between January 2023 and June 2025, one of the largest creative-performance datasets published.
AppsFlyer's gaming analysis covered 9.6 thousand gaming apps and 24.8 billion installs (14.1 billion of them paid) in 2025. The scale of the underlying data is a proxy for how much creative testing the industry now runs.
At this volume, the bottleneck is analysis. Manually tagging what is in each creative to learn which hooks and formats win is where teams either build an edge or drown, which is the exact gap creative intelligence platforms target.
UA spend, CPI, and ROAS effects
Here is the paradox of the AI creative era: production got cheaper, but winning a player got more expensive. Supply of ads outran the supply of players.
Global gaming UA spend reached $25 billion in 2025, up 3.8% year over year, per AppsFlyer.
Paid install share rose 10% year over year across iOS and Android, and ad impressions grew 20%, signalling far more ads chasing the same players, per AppsFlyer.
The US remained nearly half of global gaming UA spend, even as US budgets fell about 5% on rising costs and genre saturation, while Turkey (+29%) and India (+19%) grew fastest, per AppsFlyer.
China-headquartered publishers captured 35% of global gaming UA spend outside China, with their share up 22% year over year, per AppsFlyer.
On the returns side, Meta reported its Q4 2025 attribution model rollout drove a 24% increase in incremental conversions versus its standard model, plus a 3.5% lift in ad clicks on Facebook and more than a 1% gain in conversions on Instagram, per Meta.
The through-line: AI lowered the barrier to entry, more advertisers and more creatives entered the auction, and media costs inflated as a result. Efficiency now comes from spending smarter, not just spending more.
Playable and video format performance
Format choice is one of the biggest levers in gaming UA, and the data on playables and video is unusually clear.
Playable ads deliver impression-to-install rates 8x higher than non-playable formats for top spenders, and 16x higher for other game advertisers, per Liftoff's 2025 Mobile Ad Creative Index.
The share of spend going to interactive (playable) ads for top apps grew 20% in 2024, per Liftoff, reflecting how hard advertisers are leaning into the format.
User-generated-content video is a top differentiator: UGC spend share rose 11% for top-spending apps, with social and utility apps up nearly 30% between 2023 and 2024, per Liftoff.
Aligning "metaplay" creative (ads showing meta-game mechanics) with the right publisher audiences drove a 93% increase in installs-per-mille, per Liftoff.
Playables are the highest-converting format in the mix, but they are also the hardest to produce and to analyze, since most tools cannot read what happens inside an interactive ad. That measurement gap is a recurring theme in gaming UA.
Gaming-specific benchmarks and the cost squeeze
Pulling the threads together, gaming UA in 2025 looks like an efficiency contest fought under rising costs.
AppsFlyer's report frames the core problem as supply and demand: AI is flooding mobile gaming marketing channels with creative and raising the cost of standing out, which intensifies competition for the same audiences and drives media cost inflation, per AppsFlyer.
Gaming IAP revenue grew just 1.3% in 2025 while UA spend grew 3.8%, per Sensor Tower and AppsFlyer. Spending outpaced revenue growth, tightening margins.
Mobile still owns 56% of a $201.6 billion market, per Newzoo, so the incentive to solve UA efficiency has never been higher.
Where does creative intelligence fit? Segwise reports that teams using its platform save up to 20 hours per week per app on manual creative tagging and data consolidation, and it is built to tag playable ads, video, image, and audio creative, the format-coverage gap most analytics tools leave open (source: Segwise capabilities). For UA teams drowning in AI-generated creative volume, the constraint has shifted from making ads to knowing which elements win, which is a tagging and measurement job.
Bottom line
The 2026 data tells one story: generative AI made game creative cheap and abundant, which flooded the auction and pushed acquisition costs up even as production costs fell. AI adoption is near-universal (90% of developers, per Google Cloud), creative volume is exploding (2,400 to 2,600 variations per quarter, per AppsFlyer), and the winners are the teams that know which of those creatives actually work. Playables convert 8x to 16x better than non-playable formats, per Liftoff, yet most teams still cannot see inside them. Creative intelligence platforms like Segwise exist to close that measurement gap. If you want the cross-category view beyond gaming, read our companion AI in advertising and marketing statistics report.
Frequently asked questions
How much do game studios spend on user acquisition with AI in 2026?
Global mobile gaming UA spend reached $25 billion in 2025, up 3.8% year over year, per the AppsFlyer State of Gaming report. AI has not reduced that spend. It has increased competition, since paid install share rose 10% and ad impressions grew 20% as generative tools flooded the market with creative. Platforms like Segwise focus on making that spend more efficient by tagging which creative elements drive installs, rather than on lowering the ad-production cost itself.
What percentage of game developers use generative AI?
90% of game developers already integrate generative AI into their workflows, and 97% believe it is reshaping the industry, per Google Cloud's 2025 research with The Harris Poll. The most common uses are automating repetitive tasks (95%), playtesting (47%), and localization (45%). On the marketing side, tools like Segwise apply the same multimodal AI to ad creative, auto-tagging hooks, CTAs, characters, and visual styles so teams can connect creative to performance.
How well do playable ads perform compared to video in mobile games?
Playable ads deliver impression-to-install rates 8x higher than non-playable formats for top spenders and 16x higher for other game advertisers, per Liftoff's 2025 Mobile Ad Creative Index. The share of spend going to interactive ads for top apps grew 20% in 2024. The catch is analysis: most tools cannot read what happens inside a playable, whereas Segwise is built to tag playable ads alongside video, image, and audio creative.
How many ad creatives do top game advertisers produce?
Top gaming advertisers produced between 2,400 and 2,600 creative variations per quarter in 2025, a 25% to 30% increase year over year driven largely by AI, per AppsFlyer. At that volume, manual tagging is impossible, which is why creative intelligence tools such as Segwise automate the tagging-to-performance mapping that Segwise says saves up to 20 hours a week per app.
Is AI making mobile game user acquisition cheaper or more expensive?
More expensive, at least on the cost-to-acquire side. Generative AI lowered production costs, but it also lowered the barrier to entry, flooding auctions with more advertisers and more creatives, per AppsFlyer. Paid install share rose 10% and impressions grew 20% in 2025, driving media cost inflation. The efficiency gains now come from smarter creative decisions, which is where measurement platforms like Segwise and attribution improvements from networks like Meta focus.
How big is the mobile gaming market in 2026?
The global games market closed 2025 at $201.6 billion, up 9.1%, with mobile making up 56% (about $113 billion), per Newzoo. Mobile gaming IAP revenue was roughly $82 billion, though it grew only 1.3% as non-gaming apps out-earned games for the first time, per Sensor Tower. Slow revenue growth against rising UA costs is exactly why creative efficiency tools like Segwise have become central to gaming growth teams.
Where can I find general AI marketing statistics beyond gaming?
For AI adoption, spend, and performance stats across all advertising categories, not just games, see the companion AI in advertising and marketing statistics report from Segwise. This report stays focused on mobile gaming and user acquisition, while that one covers the broader cross-industry picture.