
Detect app ad fatigue from fast metrics first: flag a creative when its 7-day IPM is 20% or more below its own best week and its CPI is up 20% or more. Confirm with your MMP's D7 ROAS for the newest cohort. On iOS that arrives 8 to 13 days after first launch, so act on the early flag.
You have to act on that early signal network by network, while the confirming data is still days away. Segwise is an AI creative analytics and creative generation platform that tracks IPM, CPI and ROAS for each creative against fatigue thresholds you set, alerts you by email or Slack per network, and helps your team turn winning patterns into replacement ads.
This is the app-campaign version of our guide to managing creative fatigue. That guide explains what fatigue is. This one covers the parts that are specific to app installs: which install metrics move first, how Apple's privacy delays push confirmation back by days, and where each app network (Meta, Google, TikTok, AppLovin, Unity, Mintegral and Moloco) shows the signal.
TL;DR
- Subscription apps (language, fitness, utilities): watch IPM and install-to-trial rate daily. D7 ROAS is your confirmation, not your alarm.
- Games: same fast metrics, with D1 retention and early purchases standing in for trial starts. Playables and end cards fatigue too, so check them separately on AppLovin, Unity and Mintegral.
- Automated campaigns (Advantage+ app campaigns, Google App campaigns, Smart Creative on TikTok): fatigue often shows up first as falling spend share, not a higher CPI, because the network quietly shows the tired creative less. Watch spend share.
- iOS-heavy accounts: Apple's postback delays mean D7 data lands 8 to 13 days after a user first launches the app. Use Android and network metrics as the early read on the same creative.
- Three or more networks: do the check in one table, with the same video joined across networks, or you will miss that it is tired on Meta while still winning on AppLovin.
What ad fatigue looks like in install metrics
Ad fatigue is what happens when the people a network can reach have seen a creative so often that they stop responding to it. Meta's own definition is that "creative fatigue occurs when an audience has seen the same creative too many times", which "can lead to a higher cost per result", according to Meta's creative fatigue help page.
The four install metrics ad fatigue moves, in order
For an app, "responding" means installing and then doing something valuable. So fatigue shows up across four metrics, in a fixed order:
| Metric | How to calculate it | What fatigue does to it | When you can read it |
|---|---|---|---|
| IPM (installs per mille) | installs ÷ impressions × 1,000 | Falls first, as fewer viewers install | Daily, in the ad network |
| Install rate | installs ÷ clicks | Falls if the store page or end card stops converting | Daily, in the network or MMP |
| CPI (cost per install) | spend ÷ installs | Rises as IPM falls, unless the network lowers your CPM or you bid per install | Daily |
| D7 ROAS | revenue from an install cohort in its first 7 days ÷ spend on that cohort | Falls when the installs you still get are lower quality | 7 days after install, later on iOS |
Why the order of IPM, CPI and D7 ROAS matters
The order matters. IPM is the most direct read on whether viewers still respond, though your bids still shape which inventory you win. CPI is linked to it by simple arithmetic: CPI equals CPM divided by IPM (both are per 1,000 impressions, so the thousands cancel). So CPI moves with IPM unless the network lowers your CPM, and on campaigns that bid per install, CPI can hold near your bid while delivery shrinks instead. D7 ROAS from your MMP (AppsFlyer, Adjust, Branch, Singular or Kochava) is the most important number, but it is always a week behind, and more on iOS.
Falling IPM or falling install rate: which one is it?
One pattern is easy to misread. If IPM drops but install rate holds, the ad itself has stopped earning taps. If IPM holds but install rate drops, the problem is after the tap: the App Store or Google Play page, a custom product page, or a playable's end card.
Why app campaigns fatigue differently from web campaigns
Three things make app campaigns harder to read than a web conversion campaign.
Automated campaigns starve a tired creative instead of overpaying for it
Many app advertisers now put most of their spend into campaigns where the network picks the creative: Meta's Advantage+ app campaigns, Google App campaigns, TikTok's Smart Creative and the creative sets on AppLovin's Axon. When one creative tires, the algorithm can shift impressions to the others, so the tired ad's CPI may barely move while it is simply shown less. Google's asset rating works this way in part: Google says the rating is an asset's "percentile rankings based on its average daily cost", so an asset that loses spend slides toward Low.
So in automated campaigns, fatigue often shows up first as falling spend share: the creative's portion of the campaign's spend dropping week over week while its IPM slides. As a rule of thumb, a creative whose spend share falls by a third or more over a few weeks, while its IPM slides, is being phased out by the network, whether or not anyone has noticed.
This also explains why Meta's built-in fatigue label often never appears for app advertisers. Meta says the feature "is only available for ad sets with one creative except those with Advantage+ catalogue ads (previously dynamic ads), dynamic creative or Meta Advantage+ app campaigns." If your app spend is in Advantage+ app campaigns, you need your own rule.
Apple's privacy delays push confirmation back by days
On iOS, many installs are measured through Apple's SKAdNetwork (SKAN) and its successor AdAttributionKit. Apple's documentation describes three conversion windows: "days 0 to 2", "days 3 to 7" and "days 8 to 35", counted from first launch. After each window closes, the device waits a random delay before sending the postback: "24 to 48 hours for the first postback, and 24 to 144 hours for the second and third postbacks", per Apple's AdAttributionKit page on receiving postbacks in multiple conversion windows. Apple's SKAdNetwork documentation gives the same windows and delays.
Add the window and the delay together and you get the dates below. The arithmetic is ours; the inputs are Apple's.
| Signal | What it tells you | Earliest you can read it |
|---|---|---|
| Ad network IPM, CTR, CPI | Whether people still respond to the creative | The next day |
| Android D7 cohort in your MMP | Whether the installs are still worth paying for | Day 8 after install |
| iOS SKAN postback 1 (days 0 to 2) | Early value, such as a trial start or first purchase | Day 3 to 4 after first launch |
| iOS SKAN postback 2 (days 3 to 7) | Your closest thing to a D7 read on iOS, if your campaign is above Tier 0 | Day 8 to 13 after first launch |
| iOS SKAN postback 3 (days 8 to 35) | Longer-term value, such as renewals | Day 36 to 41 after first launch |
There is a second limit. Apple says "the postback data tier determines the data you receive in the first postback", and the lowest tier gets very little: "If the app's postback data tier is Tier 0, the system sends only the first postback." So a low-volume iOS campaign may get no second postback at all, and no D7 read from SKAN. A creative that only gets a few installs a day on iOS may never show up clearly in SKAN data. That is one more reason to detect on network metrics and use SKAN to confirm. Our playbook for testing creatives on iOS goes deeper on how to read SKAN for creative decisions.
For subscription apps, the practical fix is to encode the trial start in the first conversion window, so postback 1 carries the earliest value signal you can get on iOS.
One video runs on five networks under five names
A language app might run the same 20-second UGC-style video on Meta, TikTok, Google, AppLovin and Moloco. Each network gives it a different ID, and each fatigues on its own clock. The video can be tired on Meta and still winning on AppLovin, because each network shows it to different people at a different pace. If you judge it from one network, you either kill a winner everywhere or keep paying for a loser somewhere.
A fatigue rule for app creatives, with thresholds
These thresholds are rules of thumb, not network rules. Tune them to your own account after a month of data.
| Status | What you see over the last 7 days, versus the creative's own best 7 days | What to do |
|---|---|---|
| Healthy | IPM within 10% of its best, CPI steady | Nothing |
| Watch | IPM down 10% to 20%, or spend share falling two weeks in a row | Brief a replacement now, so it is ready |
| Fatigued | IPM down 20% or more and CPI up 20% or more, or spend share down by a third while IPM slides | Launch the replacement and move budget |
| Confirmed | The newest cohort's D7 ROAS is 15% or more below the creative's first cohorts | Retire it on that network, keep it where it still works |
Two guardrails against false fatigue alarms
Two guardrails stop false alarms:
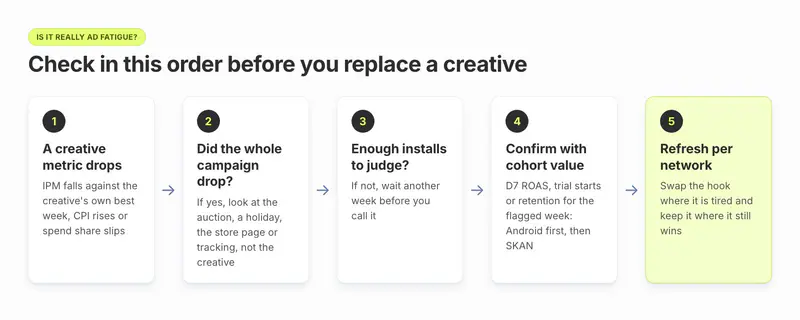
- Compare the creative with its own campaign. If every creative in the campaign lost 20% of its IPM in the same week, that is not creative fatigue. It is the auction, a holiday, a store listing change or broken tracking.
- Only judge a creative with enough installs. As a rule of thumb, wait for at least 100 installs per creative per 7-day window. With 100 installs, random noise alone moves the count by roughly 10% (the square root of 100 is 10), which is why the fatigue line sits at 20%.
Worked example: Echo's coffee UGC video
Echo is a demo language-learning app. These numbers are illustrative.
Echo's best-performing UGC video ("I ordered my coffee in Spanish. No panic.") runs in an Advantage+ app campaign on Meta and in a creative set on AppLovin.
| On Meta | Best week (week 1) | Week 4 | Change |
|---|---|---|---|
| Impressions | 1,200,000 | 900,000 | |
| Installs | 10,800 | 5,670 | |
| IPM | 9.0 | 6.3 | down 30% |
| Spend | $22,680 | $16,443 | |
| CPI | $2.10 | $2.90 | up 38% |
| Share of campaign spend | 34% | 21% | down by more than a third |
Both fast thresholds are crossed in week 4, with plenty of volume, so the video is Fatigued on Meta. The confirmation comes later: the week-4 Android cohort's D7 ROAS can be read on day 8 and comes in at 12%, against 18% for the week-1 cohort. That is a third lower, so it is Confirmed. If the campaign is above Tier 0, the iOS read from SKAN postback 2 lands between day 8 and day 13 and should point the same way.
Meanwhile, on AppLovin, the same video's IPM is only 6% below its best. The right move is to refresh the hook on Meta and leave the AppLovin creative set alone.
Watch each network's fatigue separately: Segwise lets you set your own fatigue thresholds and get email or Slack alerts per network, so a video that is tired on Meta but healthy on AppLovin shows up as exactly that. Start a free trial.
How to detect ad fatigue in app campaigns, step by step
You can run this with network exports, your MMP and a spreadsheet. For a handful of creatives on two networks, it is roughly an hour a week.
Step 1: Build one table for all networks
One row per creative per network per day, with impressions, clicks, installs, spend and MMP revenue. Add a column that joins the same asset across networks. A shared naming convention (for example ECHO_UGC_Coffee_9x16) makes this possible.
Step 2: Set each creative's baseline
Ignore the first few days while the network is still learning. Then record the creative's best 7-day IPM and CPI. That is what you compare against, not the account average.
Step 3: Run the fast check every day or two
For each creative, compare the last 7 days with its best 7 days: IPM, CPI, install rate and spend share. Apply the status rule above.
Step 4: Rule out the look-alikes
Check whether the whole campaign moved, whether the store page changed, and whether installs in the network and in the MMP still match. A gap between the two usually means a tracking problem, not tired creative.
Step 5: Confirm with cohort value
When the cohort matures, check D7 ROAS (or trial-to-paid, or D7 retention for games) for installs from the flagged week. Use Android first because it arrives first, then SKAN postback 2 for iOS where your volume earns one.
Step 6: Act per network, not globally
Replace the creative where it is tired and keep it where it still works.
Step 7: Check the replacement worked
If the campaign recovers within a few days of the swap, it was creative fatigue. If the new creative also fades fast, the audience or the budget is the limit, not the ad.
For how often to plan new creative so you are not caught short, see our guide to creative refresh cadence.
How to detect fatigue on each app network
Every network shows the signal in a different place, and some hide it inside automation. This is where to look, based on each network's own documentation.
| Network | Where to look | The fatigue signal | Watch out for |
|---|---|---|---|
| Meta | Ads Manager, ad-level breakdown | IPM, cost per install and spend share by ad | Built-in fatigue labels are not available in Advantage+ app campaigns |
| Google App campaigns | Asset report | Assets moving to "Low", falling conversions per asset | Labels are relative to other assets, over the last 14 days |
| TikTok | Ad-level report, video play metrics | Falling 2-second views and play time per impression, rising CPI | Smart Creative may pause tired videos for you |
| AppLovin (Axon) | Reporting API, by creative set | A creative set's conversion rate and share of installs falling | The Asset Reporting API has no installs; use the Reporting API |
| Unity Ads | Reporting dashboard, Creative Pack ID | Creative pack IPM and install rate | Creative insights is still in beta |
| Mintegral | Creative Monitor report | CVR falling for a creative or end card | Check the end card and playable separately |
| Moloco | Reports by creative group and creative | A creative group's spend share and IPM | Use the API or export to see trends |
Meta (Advantage+ app campaigns and manual app ads)
Meta shows two delivery statuses when it thinks an audience has seen an ad too often. When cost per result is above your past ads "but less than twice as much, you will see a Creative limited status." At "twice as much" or more, it shows "Creative fatigue". Meta also counts "all recent exposures of the ad's image or video, including those from other campaigns from your Page", so a video running in two campaigns tires faster.
The catch for app marketers is the eligibility line quoted earlier: no labels in Advantage+ app campaigns, and only for ad sets with one creative. Meta's developer docs also note that an Advantage+ app campaign has a single ad set and relies on machine learning adjustments, so all your creatives compete in one pool. Break the campaign down by ad, calculate IPM yourself from impressions and app installs, and track each ad's share of spend.
Google App campaigns
Google App campaigns build ads from your assets, so there is no per-creative ad row like the ones you read in Meta. Instead, read the asset report, which rates each asset Low, Good or Best, relative to "other assets within the same campaign and of the same type", and Google says "these insights are based on the last 14 days of data." New assets show "Learning", which means "the campaign needs more data before it can rank the asset", so give them time before you judge them.
Two cautions. First, the rating is relative, so a "Good" video can still be fading if the whole campaign is fading. Watch the clicks, impressions, cost and conversions the report shows per asset, not just the label. Second, changing the date range does not change the rating; Google says "the rating provided is always the current rating." To see a trend, export the report weekly.
TikTok
TikTok's help center describes Smart Creative as using "ad group fatigue detection and auto-refresh", pausing videos that show fatigue and replacing them from a waiting list. TikTok's API for Business also lists a "Get Creative Fatigue Detection results" endpoint, which is useful if you pull TikTok data into your own reports. TikTok says some advertisers will see a newer version of this tool called Automate Creative, so check which one your account has.
For a manual check, use TikTok's video play metrics: 2-second video views and average play time per video view. If 2-second views per impression drop while impressions hold, the hook has stopped working, usually before CPI shows it. For more on TikTok's pace, see our post on overcoming TikTok creative fatigue.
AppLovin (Axon)
On AppLovin, your ads live in creative sets, which "allow you to combine multiple ad types and sizes into one batch upload", with "a maximum of 10 files for each asset type", per AppLovin's creative sets guide. For fatigue, use AppLovin's Reporting API. It can break results down by creative set, with a creative set ID that "does not change if the creative set name changes", and it reports "conversions", which it defines as the "number of conversions (installs)", plus a "conversion_rate" of conversions divided by impressions. That conversion rate times 1,000 is the creative set's IPM. The separate Asset Reporting API lists impressions, clicks, cost and CTR, but no installs, so it can't give you IPM on its own.
AppLovin's own scaling guidance says to "regularly introduce new creative assets", naming video, HTML playables and images. Treat a creative set whose IPM and share of installs keep falling as fatigued, even if its CPI looks fine.
Unity Ads
Unity groups creatives into creative packs. In the Unity Ads dashboard, go to Reporting, then Dashboard, and choose "Creative Pack ID or Creative Pack Name" as the dimension. Unity recommends IDs "because IDs are unique and don't have duplicates." Its Creative insights view, which Unity calls "a beta release", lets you hover over any second of the ad to see "the clicks percentage of total clicks and converted clicks for that point of the ad". It shows when in the ad people click, not how many stop watching. Comparing a creative pack's early weeks with its latest week shows whether clicks are moving, for example from the hook to only the end card.
Mintegral
Mintegral's Creative Monitor report lets you filter by creative set name, ad, creative and end card, with metrics including impressions, clicks, conversions, CTR, CVR and spend, plus CSV export. Because Mintegral reports the end card separately, you can tell whether the video tired or the end card did. A falling CVR on one end card across several videos means the end card is the problem.
Moloco
Moloco's Reporting API breaks results down by ad group, creative group and creative. Pull a creative-group report weekly and track each group's spend share and IPM. As on other automated networks, a group that the model stops spending on is telling you something, even if its CPI looks stable.
What to do when an app creative fatigues
Start with the cheapest change that could work, and make it on the network where the creative is tired.
- Change the hook first. Keep the body of the video and swap the first two or three seconds: a new opening line, a new face, a new first frame. If the ad's hook metrics fell but install rate held, this is usually enough.
- Then change the end card or the offer. If install rate fell, test a new end card, a new playable ending or a new store page before you rebuild the whole video.
- Only then build a new concept. If the hook refresh fades within days, the idea itself is worn out.
How to add a replacement creative on each network
Each network has its own way to put a replacement in:
- Meta: Meta's advice is to "create a new ad with a new image or video that is materially different from the original creative", and it notes that "keeping your original ad active instead of pausing or turning it off may maximise results."
- Google App campaigns: Google's creative guidance allows "4 for text, 20 each for images, videos, and where applicable, HTML5." Below the limit, add assets similar to the Best ones. At the limit, replace the Low ones, and Google advises doing it gradually.
- TikTok: add new videos to the ad group, or let Smart Creative rotate them if you use it.
- AppLovin, Unity, Mintegral, Moloco: upload the replacement as a new creative set, creative pack or creative group, so its results stay separate from the tired version's history.
Tip: Before you upload replacements, rank them. A new draft that reuses the hook that just tired will tire faster. Compare each draft with your current winners and drop the near copies.
Which tools alert you automatically when app creatives wear out?
This question often comes in a form like: "I need a platform that automatically alerts me when my ad creatives are wearing out. What are the best tools for detecting creative fatigue across Facebook, Instagram, and TikTok?" The answer has three parts.
Native fatigue signals cover one network each
The free, native options cover one network each. Meta's delivery statuses work for single-creative ad sets but not for Advantage+ app campaigns. Google's asset labels are relative and limited to the last 14 days. TikTok's Smart Creative handles fatigue inside TikTok but does not tell you about Meta. And the labels themselves are built on cost, not on your MMP's cohort D7 ROAS: Meta compares an ad's "cost per result" with your past ads, and Google ranks assets "based on its average daily cost".
Third-party fatigue alerts: Madgicx and Birch
Third-party tools add fatigue flags and alerts. Madgicx is an AI advertising platform that, in its own words, "optimizes Meta ads only"; its Creative Insights "flags creative fatigue so advertisers know when to refresh", and its reporting also pulls in Google Ads and TikTok. Birch, formerly Revealbot, has an "Identify fatigued ads" template and "customizable Slack and email alerts", and connects Meta, Google, Snapchat and TikTok. Both suit teams whose spend sits mostly on Meta, with Birch also covering Google, Snapchat and TikTok. Neither lists AppLovin, Unity, Mintegral or Moloco on the pages we checked, which matters if much of your app spend runs on those networks. Segwise, covered below, connects all four: see its setup guides for AppLovin, Unity, Mintegral and Moloco.
When does a cross-network fatigue tool earn its cost?
A cross-network tool earns its cost once two of these are true (a rule of thumb):
- you run three or more networks at once
- you have more than about 50 live creatives
- most of your spend is in automated campaigns, where fatigue shows up as lost spend share
- your team spends more than two hours a week joining network and MMP data by hand
- iOS is a big share of installs, so you need the fast signals and the delayed ones side by side
If none or one applies, the spreadsheet method above is enough. If you are comparing vendors, our list of the best creative fatigue detection tools compares six of them, with prices and limitations.

Where Segwise fits for app fatigue alerts
Segwise's fatigue tracking looks for a sustained decline in performance and spend share for every creative, against thresholds you set (for example, a 20% ROAS decline over 7 days). It alerts your team by email or Slack, either per network or across all of them. It reports IPM, CPI, CVR and ROAS at the creative level, pulls in post-install data from AppsFlyer, Adjust, Branch, Singular or Kochava when you connect one, and clusters the same asset across Meta, Google, TikTok, AppLovin (Axon), Unity, Mintegral, Moloco and more, so one tired video shows up as one problem.
When a creative tires, the Creative Generation Agent lets you make replacement statics and videos up to 30 seconds, including AI UGC-style ads, from your own winning patterns, and Pre-flight Testing scores up to 10 drafts at a time, each out of 100, against your own winners before any spend. You can use each agent on its own, or do it all in one place by chatting with the Segwise agent: ask how your ads are performing, see what competitors are running, and make new ads from your winners. Teams at subscription apps use it to tie creatives to trials and retention, not just installs. WGT, a golf game, reports using fatigue as an early signal next to ROAS in its case study.
What Segwise can't do about app fatigue
Limitations, honestly: Segwise reads what networks and MMPs report, so it cannot remove Apple's postback delay; it gives you the fast signals and the delayed ones in one place. It needs at least one connected ad network. Setup is no-code, but not identical everywhere: some networks connect with OAuth, while AppLovin, Mintegral, Unity and Moloco need an API key from the network's dashboard. You still upload replacements in each network. The free trial imports 14 days of history, which is enough to start but short for setting baselines; paid plans import up to 3 months. Segwise starts at $499/month for advertisers spending up to $250K/month, with a special 50% discount for startups spending under $50K/month, and includes a 7-day free trial.
How to stay ahead of ad fatigue in app campaigns
App creatives tire network by network, and the first sign is a falling IPM, well before D7 ROAS can confirm it. Compare each creative with its own best 7 days, rule out campaign-wide moves and thin install counts, then check cohort value once it matures. When a creative is fatigued, change the hook first and replace it only on the network where it is tired. Start by building one table that joins each creative across every network you run.